Chenango County is easiest to understand as a rural landscape in which forest and farmland repeatedly meet. The countywide land-cover map is dominated by wooded terrain, but agricultural areas form long, irregular bands through valleys and gentler ground. Developed land is much less extensive and appears mainly around Norwich, smaller settlements, and transportation corridors. The four maps in this set separate those patterns so that the same county can be read from different angles: overall land cover, forest and farmland, impervious surface and development, and mapped class change between 1985 and 2025.
The 2025 summary printed on the maps identifies forest as the dominant cover at 60.06 percent and agriculture at 26.93 percent. Developed cover accounts for 7.37 percent, wetlands for 4.48 percent, and water for 0.53 percent. These values summarize the Annual NLCD classification used to make the maps. They should not be read as parcel acreage, zoning, ownership, or a legal description of land use. Their main value is showing the broad composition of the county and the spatial relationship among major cover classes.
Table of Contents
A county shaped by wooded hills and working land
The general land-cover map gives forest the strongest visual presence. Large green areas connect across much of the county, especially through broad upland and hilly sections. Agriculture breaks that forest into a more intricate pattern rather than forming one continuous plain. Yellow agricultural cells follow many valleys and gentler corridors, while developed cells create relatively small clusters and narrow lines. Norwich stands out as one of the clearest concentrations of development, with additional smaller concentrations distributed along the road network.
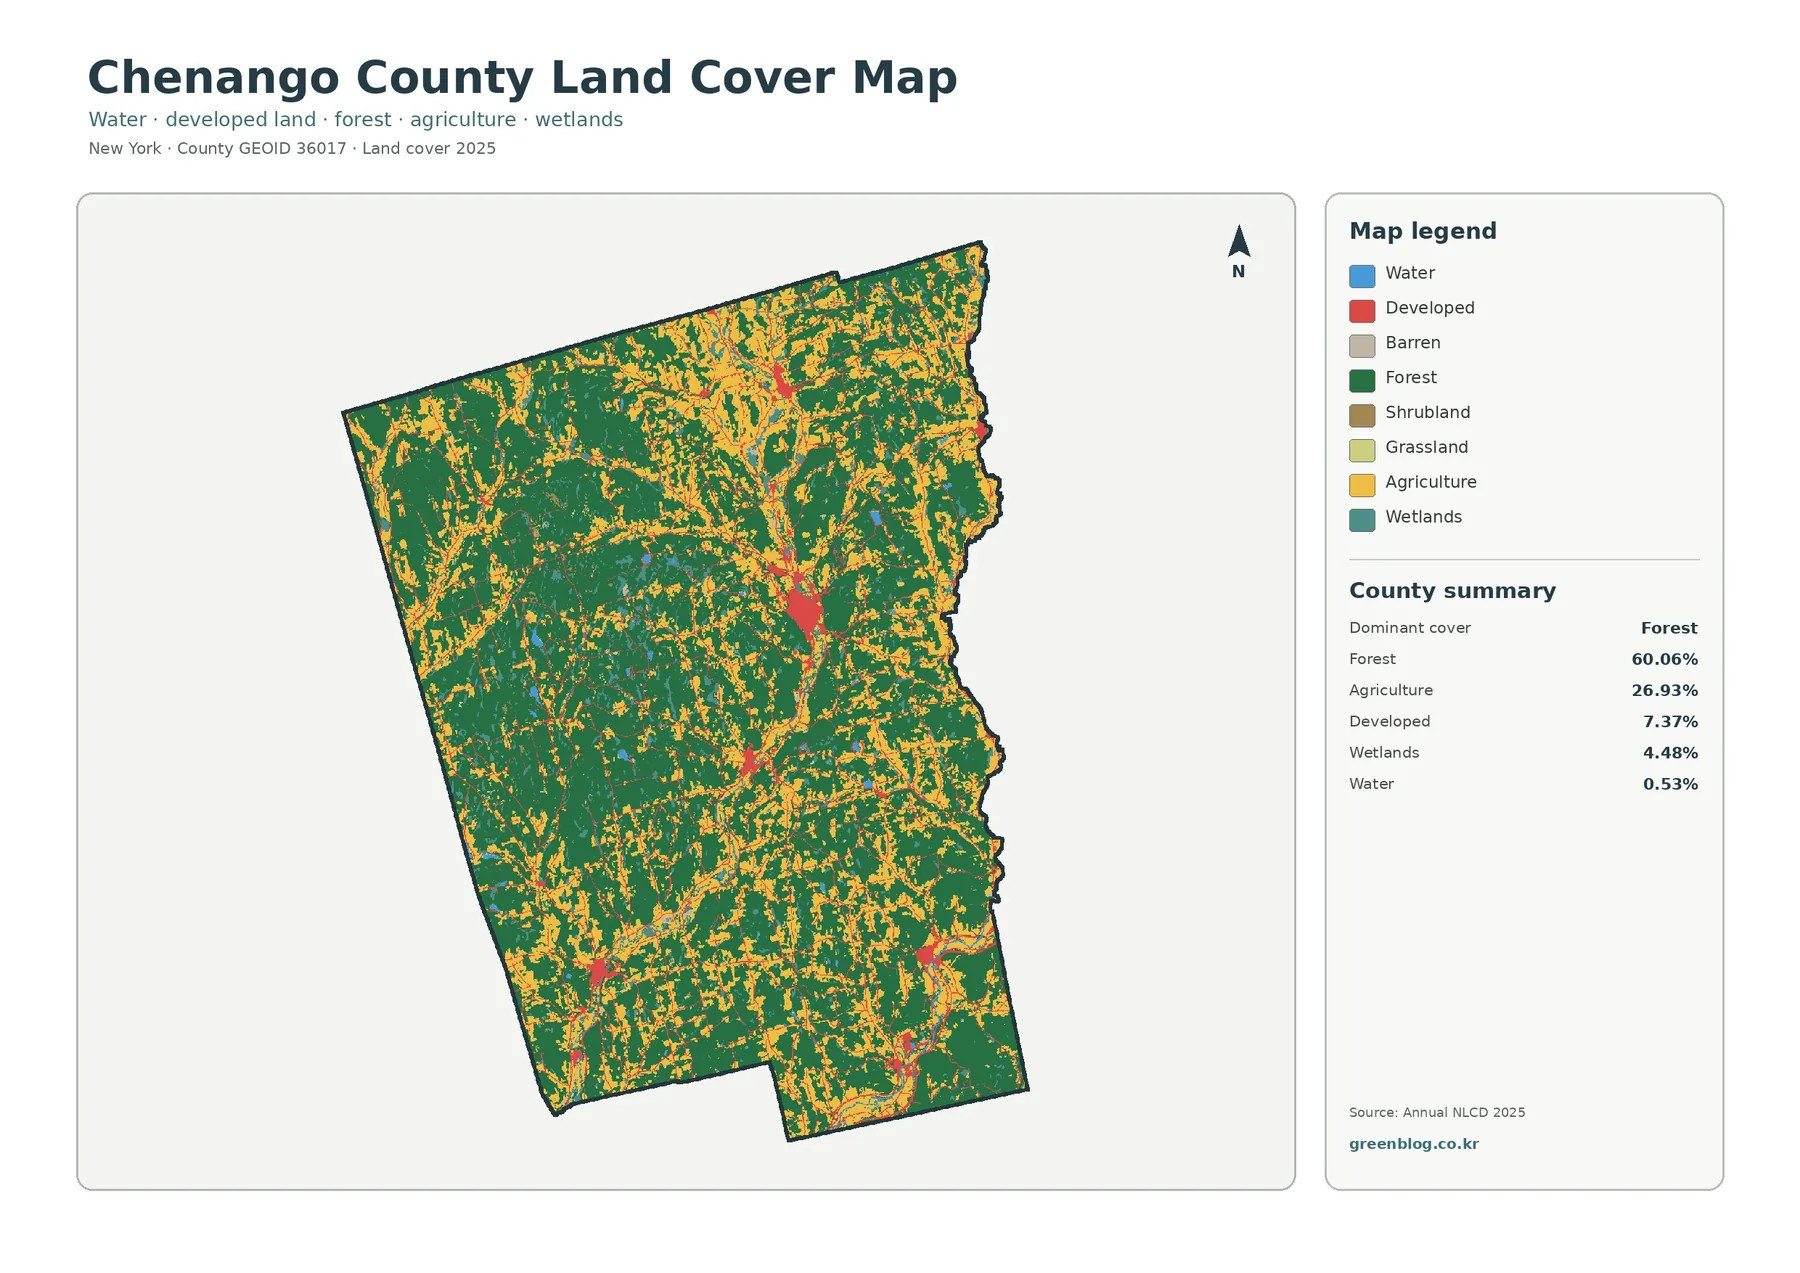
The legend also includes barren land, shrubland, and grassland, but those classes occupy much less visual space than forest and agriculture. At county scale, the important pattern is the repeated transition from wooded hills to open agricultural ground and then to small developed nodes. The boundaries between classes are not parcel lines. Rural properties can contain fields, woods, lawns, buildings, and roads within a short distance, while the raster classification assigns each grid cell a single mapped class.
Forest and farmland form a patchwork rather than two separate zones
The forest-and-farmland map simplifies the color scheme so that the rural structure becomes easier to see. Forest remains broad and connected, while cropland and pasture or hay appear in branching bands and scattered openings. The pattern is especially useful for recognizing that agriculture is not confined to one corner of Chenango County. Instead, working land is interwoven with wooded terrain in many parts of the county, creating a patchwork that changes over relatively short distances.
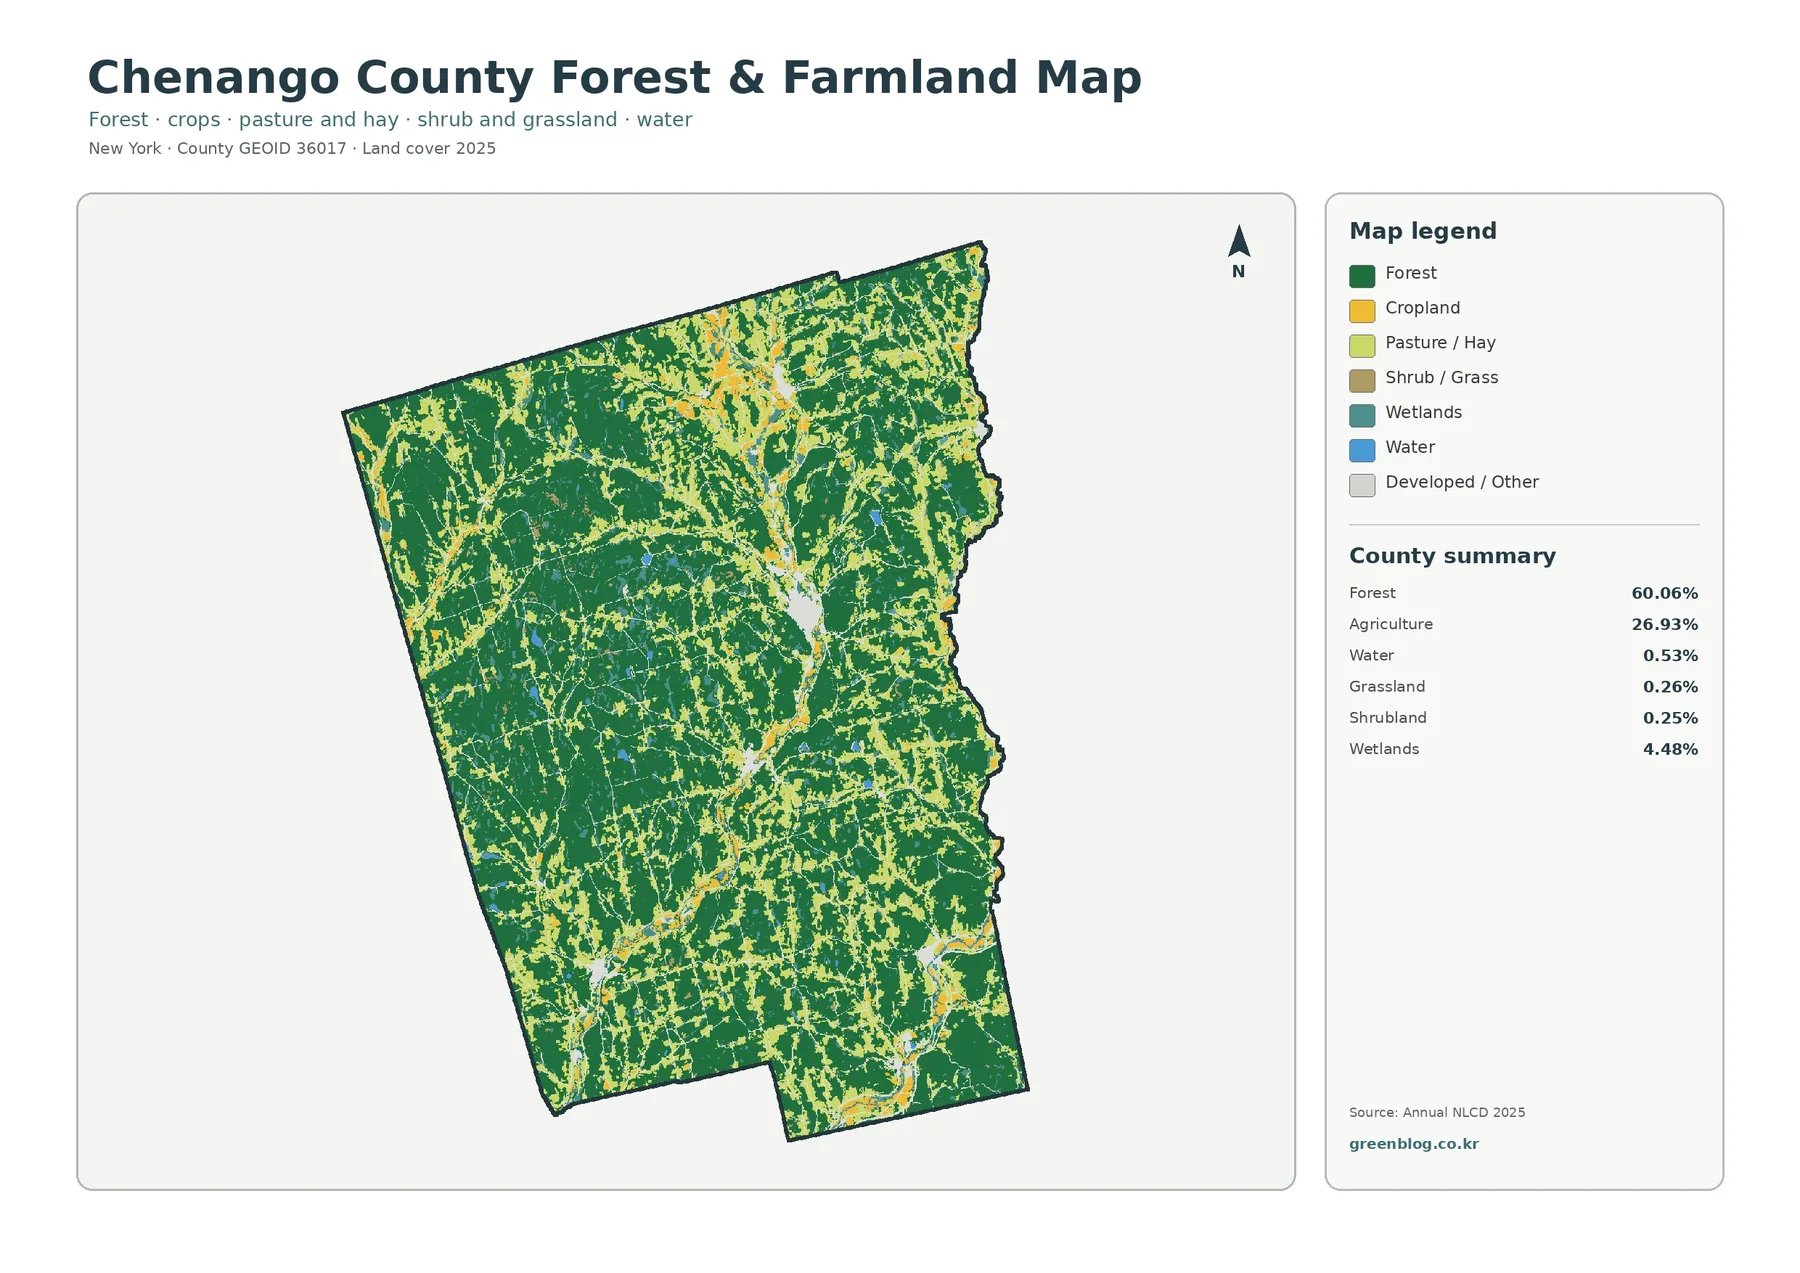
The map summary lists agriculture at 26.93 percent, a substantial share beside the 60.06 percent forest cover. Chenango County maintains an Agriculture and Farmland Protection Board and publishes an Agriculture and Farmland Protection Plan, reflecting the local importance of working land. The mapped agricultural class is not the same thing as an Agricultural District boundary, however. One is a remotely sensed land-cover category; the other is an administrative and policy designation. Using the two together can provide context, but they should never be treated as interchangeable datasets.
Wetlands account for 4.48 percent on the county summary and appear in smaller patches associated with low ground and drainage areas. Water represents 0.53 percent. Those percentages are modest compared with forest and agriculture, yet wetlands and water can be important when the map is used for watershed teaching, habitat screening, or landscape comparison. A land-cover map does not establish regulated wetland boundaries, so any permitting or property decision requires the appropriate state, federal, or local source.
Impervious surfaces concentrate around Norwich and road corridors
Impervious surface means a hard surface such as pavement or a roof where rainfall does not readily soak into the soil. On the Chenango County impervious map, most of the county remains near the low end of the scale. Stronger orange and red tones are concentrated around Norwich and other settlement nodes, then stretch outward in thin lines that follow the transportation network. This produces a very different visual pattern from the broad forest and farmland polygons on the first two maps.
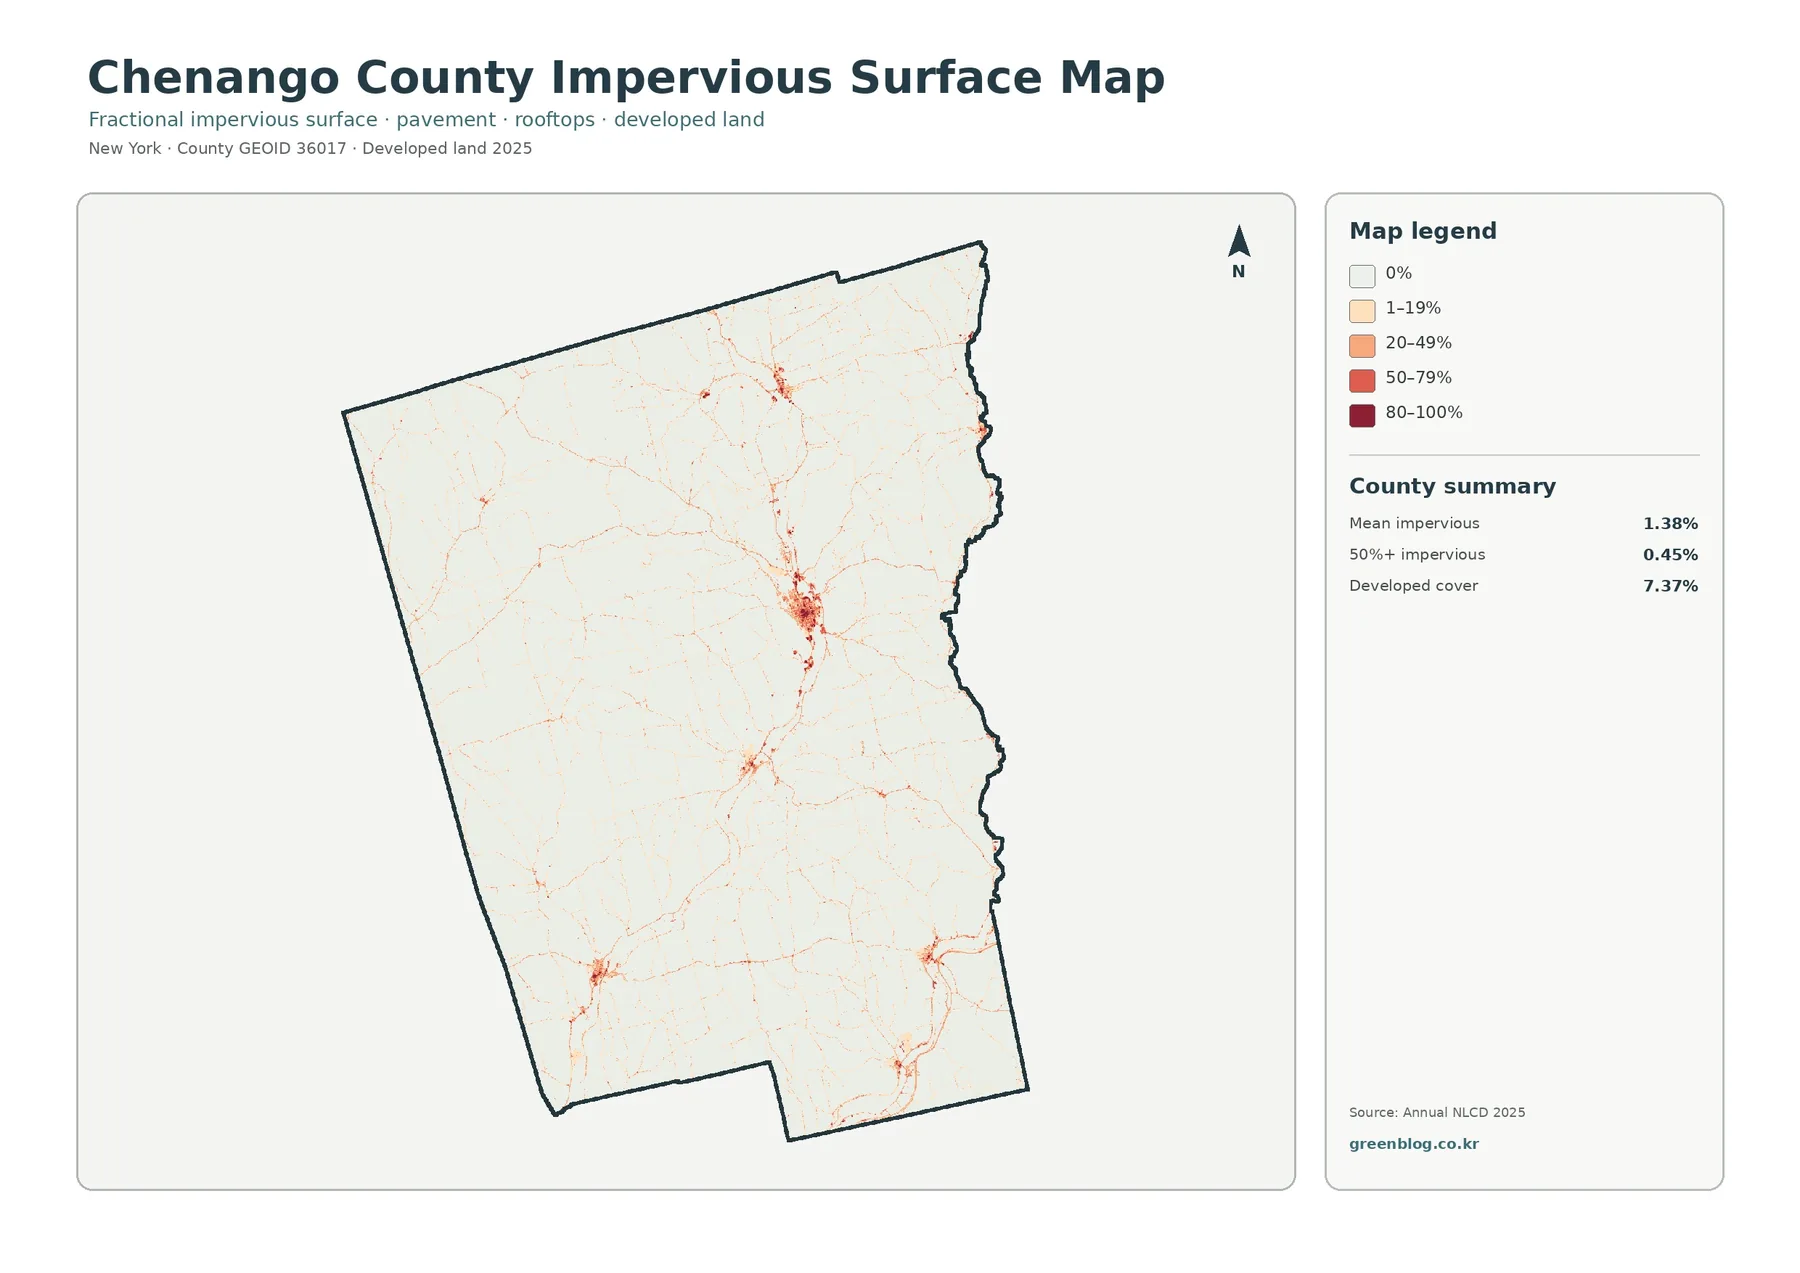
The map reports a mean impervious value of 1.38 percent across the county and shows 0.45 percent of the county at 50 percent or greater imperviousness. Developed cover as a land-cover class is higher, at 7.37 percent. That difference matters because low-density developed land can contain large amounts of grass, trees, and other permeable cover even though the area is classified as developed. The impervious map therefore gives a more focused picture of hard surfaces than the general developed-land class alone.
This view can support an initial look at runoff-sensitive areas, road-associated development, or the contrast between settlement centers and the surrounding countryside. It does not show storm drains, culvert capacity, flood probability, or site-level drainage. A narrow road or a small building may also be generalized by the raster resolution. For engineering, permitting, or parcel work, the map should serve only as a screening layer before more detailed data are consulted.
What the 1985–2025 change map actually measures
The change map compares the mapped land-cover class in 1985 with the class in 2025. Its county summary shows a class difference across 7.31 percent of the mapped area. Of that total, 0.79 percent is shown as classified to developed, 0.67 percent as forest loss, and 0.80 percent as agricultural loss. Another 4.91 percent falls into the broader “other class difference” category. The colored cells are scattered rather than forming a single large change front, which makes the map more useful for locating clusters of differences than for telling one simple countywide story.
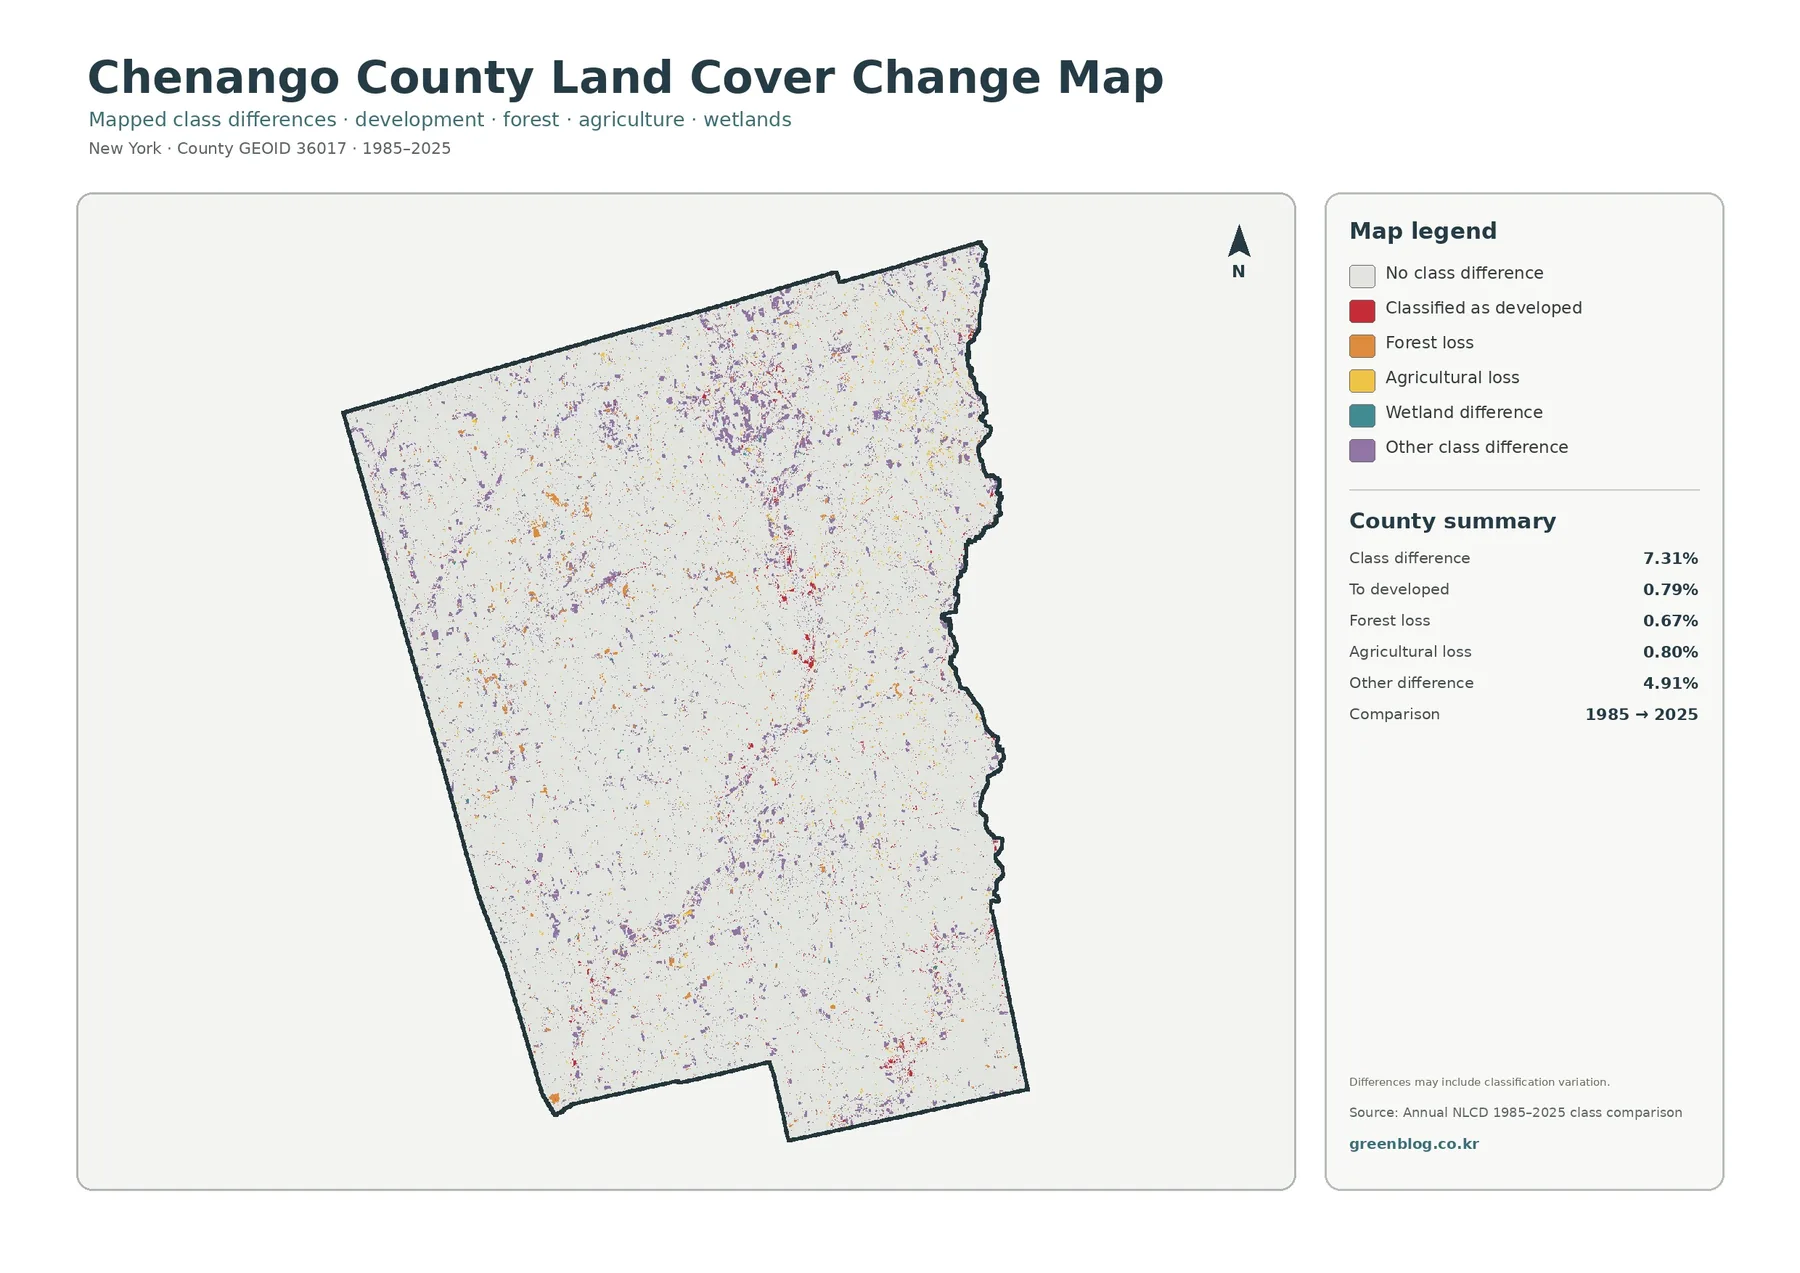
A colored change cell should not automatically be interpreted as a confirmed disturbance or development event. Two satellite-era classifications can differ because of real land-cover change, but also because of imagery conditions, mixed pixels, edge placement, or classification revisions. Forest edges, field margins, narrow roads, and wet areas are especially likely to contain cells where small positional or spectral differences affect the assigned class. The map is best used to identify places worth checking in current aerial imagery or another authoritative dataset.
Reading all four maps together
Each map answers a different question. The general map asks what covers the ground today. The forest-and-farmland version strips away some visual complexity to make the rural mosaic easier to compare. The impervious map asks where hard surfaces are concentrated, while the change map asks where two classification dates do not match. Looking at the same location across all four prevents a common mistake: assuming that one color on one map explains the whole landscape.
For example, an agricultural corridor may appear as open working land on the forest-and-farmland map, contain a thin road line on the impervious map, and show only scattered change cells on the 1985–2025 comparison. A wooded area may look continuous at county scale but still contain roads, homes, small fields, or wetland cells when viewed more closely. The four-map set is therefore most useful as a layered overview rather than a substitute for high-resolution local mapping.
Practical uses for planning, education, and field preparation
For general planning context, the maps help distinguish settlement concentrations from large wooded areas and agricultural corridors. A classroom or public presentation can use them to show how land cover differs from land use and how the same county looks when the legend is designed around a different question. Watershed or habitat work can use the maps as an early screening tool to locate forest connections, wetland-rich areas, open agricultural ground, and places where hard surfaces become more concentrated.
Agricultural discussions can benefit from the same comparison. Chenango County’s official agriculture page provides access to its Agriculture and Farmland Protection Plan and Agricultural District information, while this map set shows a satellite-derived picture of surface cover. The policy documents describe programs and designated areas; the maps show where forest, agricultural cover, development, and wetlands are classified on the ground. Keeping those roles separate makes the comparison more useful and avoids turning a visual land-cover layer into a legal land-use map.
Resolution and classification limits
Annual NLCD is a raster product, meaning the landscape is divided into a grid of cells. At roughly 30-meter land-cover resolution, a single cell can contain more than one real-world surface. A farmhouse and yard, a narrow road beside a field, or a small wet patch inside woodland may be simplified into one dominant class. This mixed-pixel effect is normal in regional land-cover mapping and becomes more noticeable when the user tries to interpret very small features.
Land cover also should not be confused with ownership, zoning, tax status, or permitted use. A forest-classified cell does not reveal whether the property is public or private. An agricultural cell does not identify a crop or confirm that the parcel is enrolled in an agricultural district. A developed cell does not distinguish residential, commercial, industrial, or public uses in a legally meaningful way. Property research, wetland determinations, engineering, and regulatory decisions require the current records from the relevant agency.
Download the four-map set
The download package contains four original JPG maps for Chenango County: the general land-cover map, forest and farmland map, impervious surface and developed land map, and the 1985–2025 land-cover change map. The article uses WebP previews for efficient viewing, while the ZIP provides the JPG versions for offline reference, presentations, and print-oriented workflows.
Frequently Asked Questions
What is the dominant land cover in Chenango County?
Forest is the dominant category in the supplied 2025 map summary at 60.06 percent. Agriculture is the second-largest category at 26.93 percent, creating the strong forest-and-farmland pattern visible across the county.
Is developed land the same as impervious surface?
No. Developed land is a land-cover class that can include vegetation and open space around buildings, while impervious surface measures hard cover such as roofs and pavement. That is why the county’s developed-cover percentage is higher than its mean impervious percentage.
Does every colored cell on the change map represent confirmed land conversion?
No. The change layer compares two classified datasets. Real change can produce a difference, but imagery, mixed pixels, class definitions, and edge placement can also contribute. Important locations should be verified with recent aerial imagery or another authoritative source.
Map File Information
Download the map files associated with this page for reference, printing, and compatible visual projects.
- Included Files: Use only the versions confirmed in the article and supplied images
- File Type: Use the confirmed download contents
- Intended Use: Printing, education, presentations, and map-based projects
Related Maps
- Albany County Land Cover Map
- Bronx County New York Land Cover Map
- Cattaraugus County New York Land Cover Map
Sources and references
- MRLC Annual NLCD Data — official access to the land-cover and related raster data used for national land-cover mapping.
- USGS Annual NLCD Land Cover Classification — explanation of the Annual NLCD land-cover classes and classification framework.
- Chenango County Agriculture — county information on the Agriculture and Farmland Protection Board, farmland planning, and Agricultural District resources.
- Chenango County Environmental Management Council — official county information on natural-resource conservation and environmentally sustainable use.
Green Map creates custom-edited map images using open geographic data sources such as geoBoundaries, Natural Earth, OpenStreetMap, and government open data.
These maps are edited visual materials, not raw data files, and are provided for education, documents, presentations, and graphic reference.