The landscape of Chemung County is easiest to understand as a contrast between wooded uplands, working agricultural ground, and the more intensely developed Elmira corridor. The Chemung County New York Land Cover Map set approaches that contrast from four angles rather than compressing everything into one image. A general land-cover map establishes the countywide pattern, a forest-and-farmland map isolates the rural mosaic, an impervious-surface map reveals where pavement and rooftops are concentrated, and a change map compares classified land cover between 1985 and 2025.
Reading the maps as a set is especially useful here because Chemung County does not have one uniform surface pattern. Forest dominates much of the county, yet agricultural cover repeatedly follows valleys and gentler terrain. Elmira and nearby developed areas create a much denser patch of built surfaces in the west-central part of the county, while road-linked development extends outward in thinner lines. The four maps make those differences visible without treating land cover as zoning, ownership, or parcel-level land use.
Table of Contents
A county framed by forest and valleys
The general 2025 land-cover map gives the broadest view. Its county summary identifies forest as the dominant class at 60.49 percent. Agriculture accounts for 22.36 percent, developed cover for 14.34 percent, wetlands for 1.94 percent, and water for 0.56 percent. Those values come from the mapped Annual NLCD classification used for this graphic. They describe classified raster cells inside the county boundary; they are not measurements of taxable parcels, zoning districts, or property ownership.
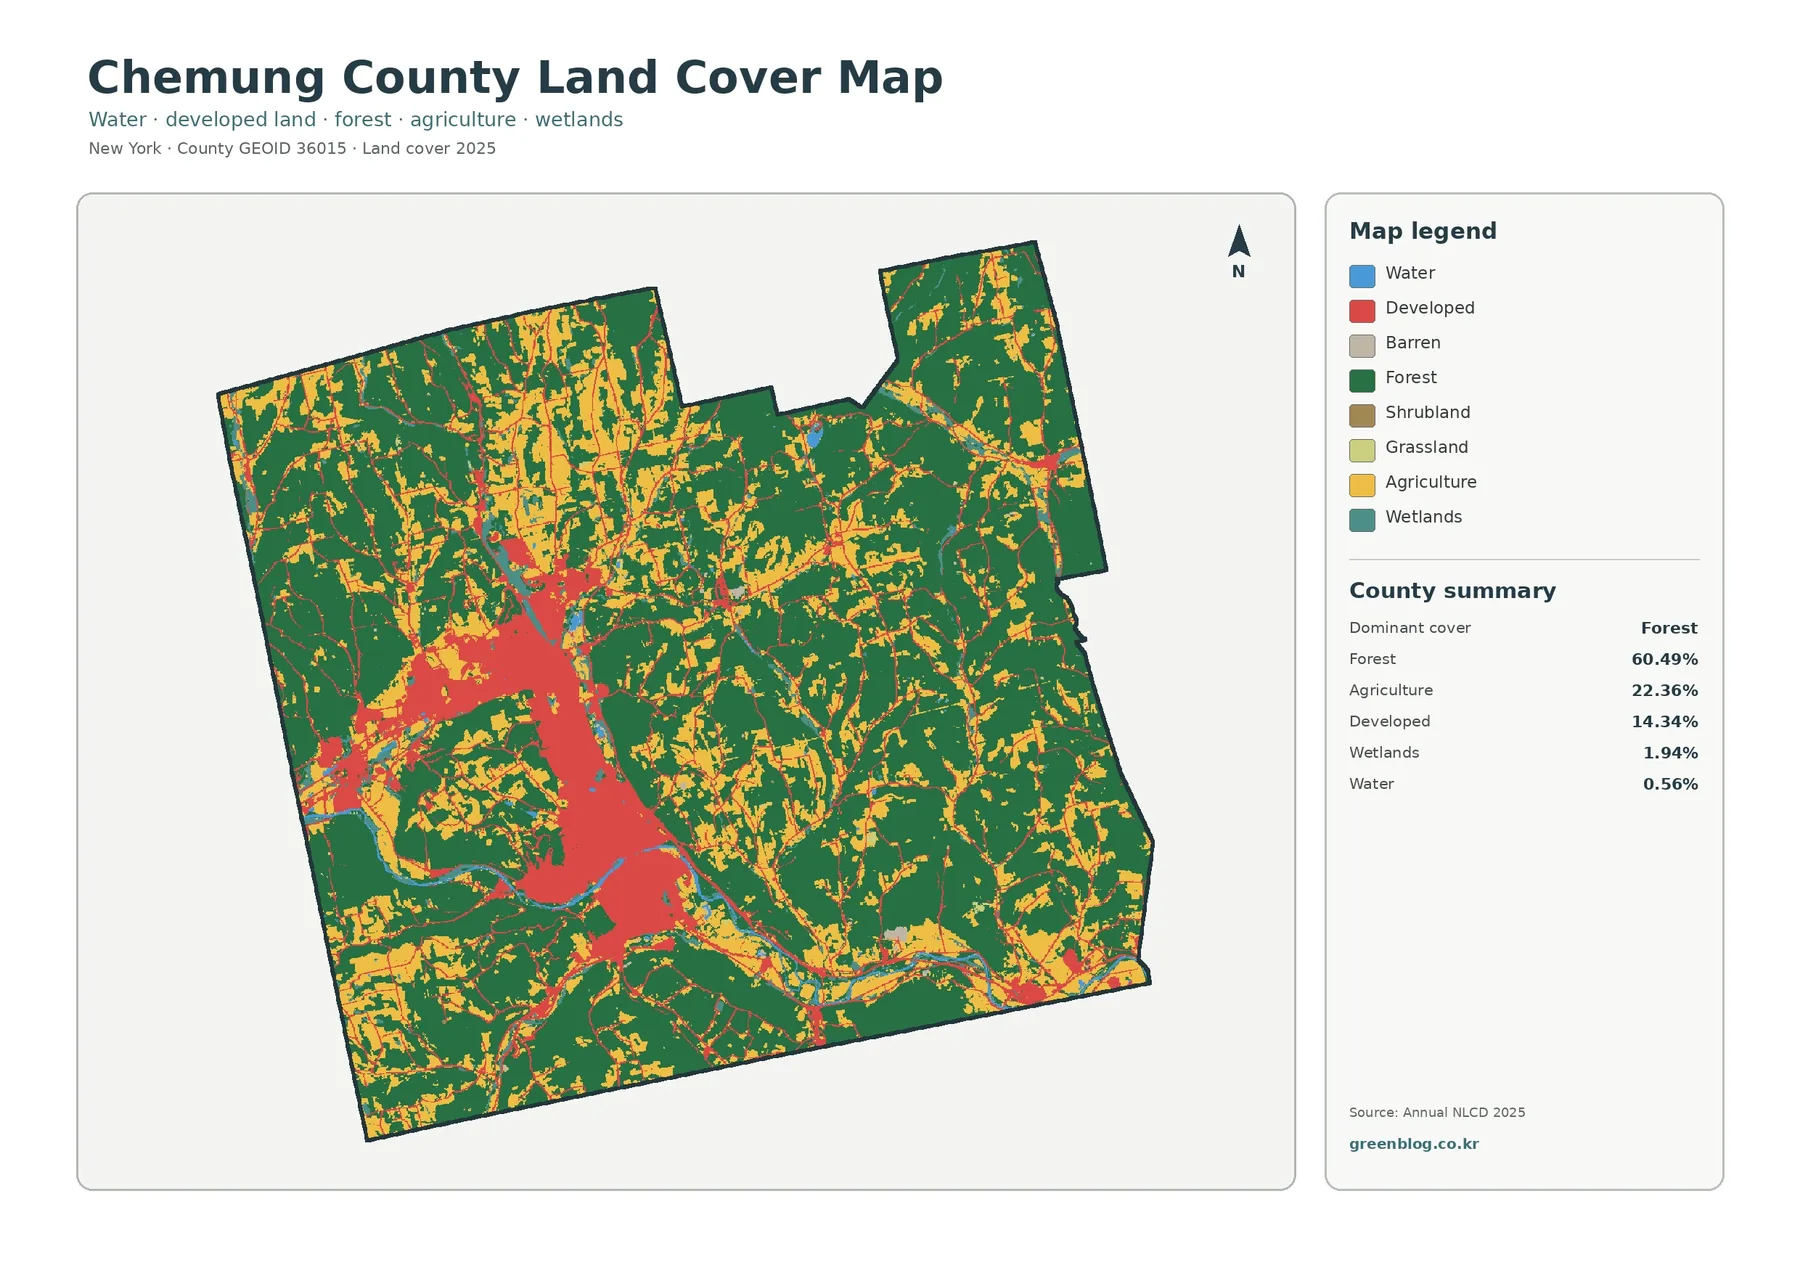
Large forest blocks occupy much of the eastern, northeastern, southwestern, and outer portions of the county. Agricultural colors break through that forest in long, irregular bands rather than forming one continuous plain. They are especially noticeable in the northwest, north-central areas, and along lower terrain toward the county’s southern side. Developed cover forms its largest connected concentration around Elmira, then narrows along transportation and settlement corridors. That pattern is one of the clearest visual signatures in the map set.
Wetlands and open water occupy much smaller mapped shares, so they can be easy to overlook at the full-county scale. Their limited area does not make them unimportant. Streams, wet ground, flood-prone lowlands, and connected habitat can matter greatly in watershed planning even when their colored cells are visually minor. For that reason, the map is most useful for regional context. A detailed wetland boundary, streambank decision, or site plan should rely on more precise local and regulatory information.
Forest and farmland form a broken rural mosaic
The forest-and-farmland map removes much of the visual competition from developed categories and makes the rural pattern easier to follow. Dark green forest remains broadly continuous across the hills and outer parts of Chemung County. Cropland and pasture or hay appear in lighter agricultural colors, often tracing valleys, broader slopes, and openings between wooded areas. The result is not a simple east-west split. Instead, forest and agriculture interlock in a patchwork shaped by local terrain and settlement patterns.
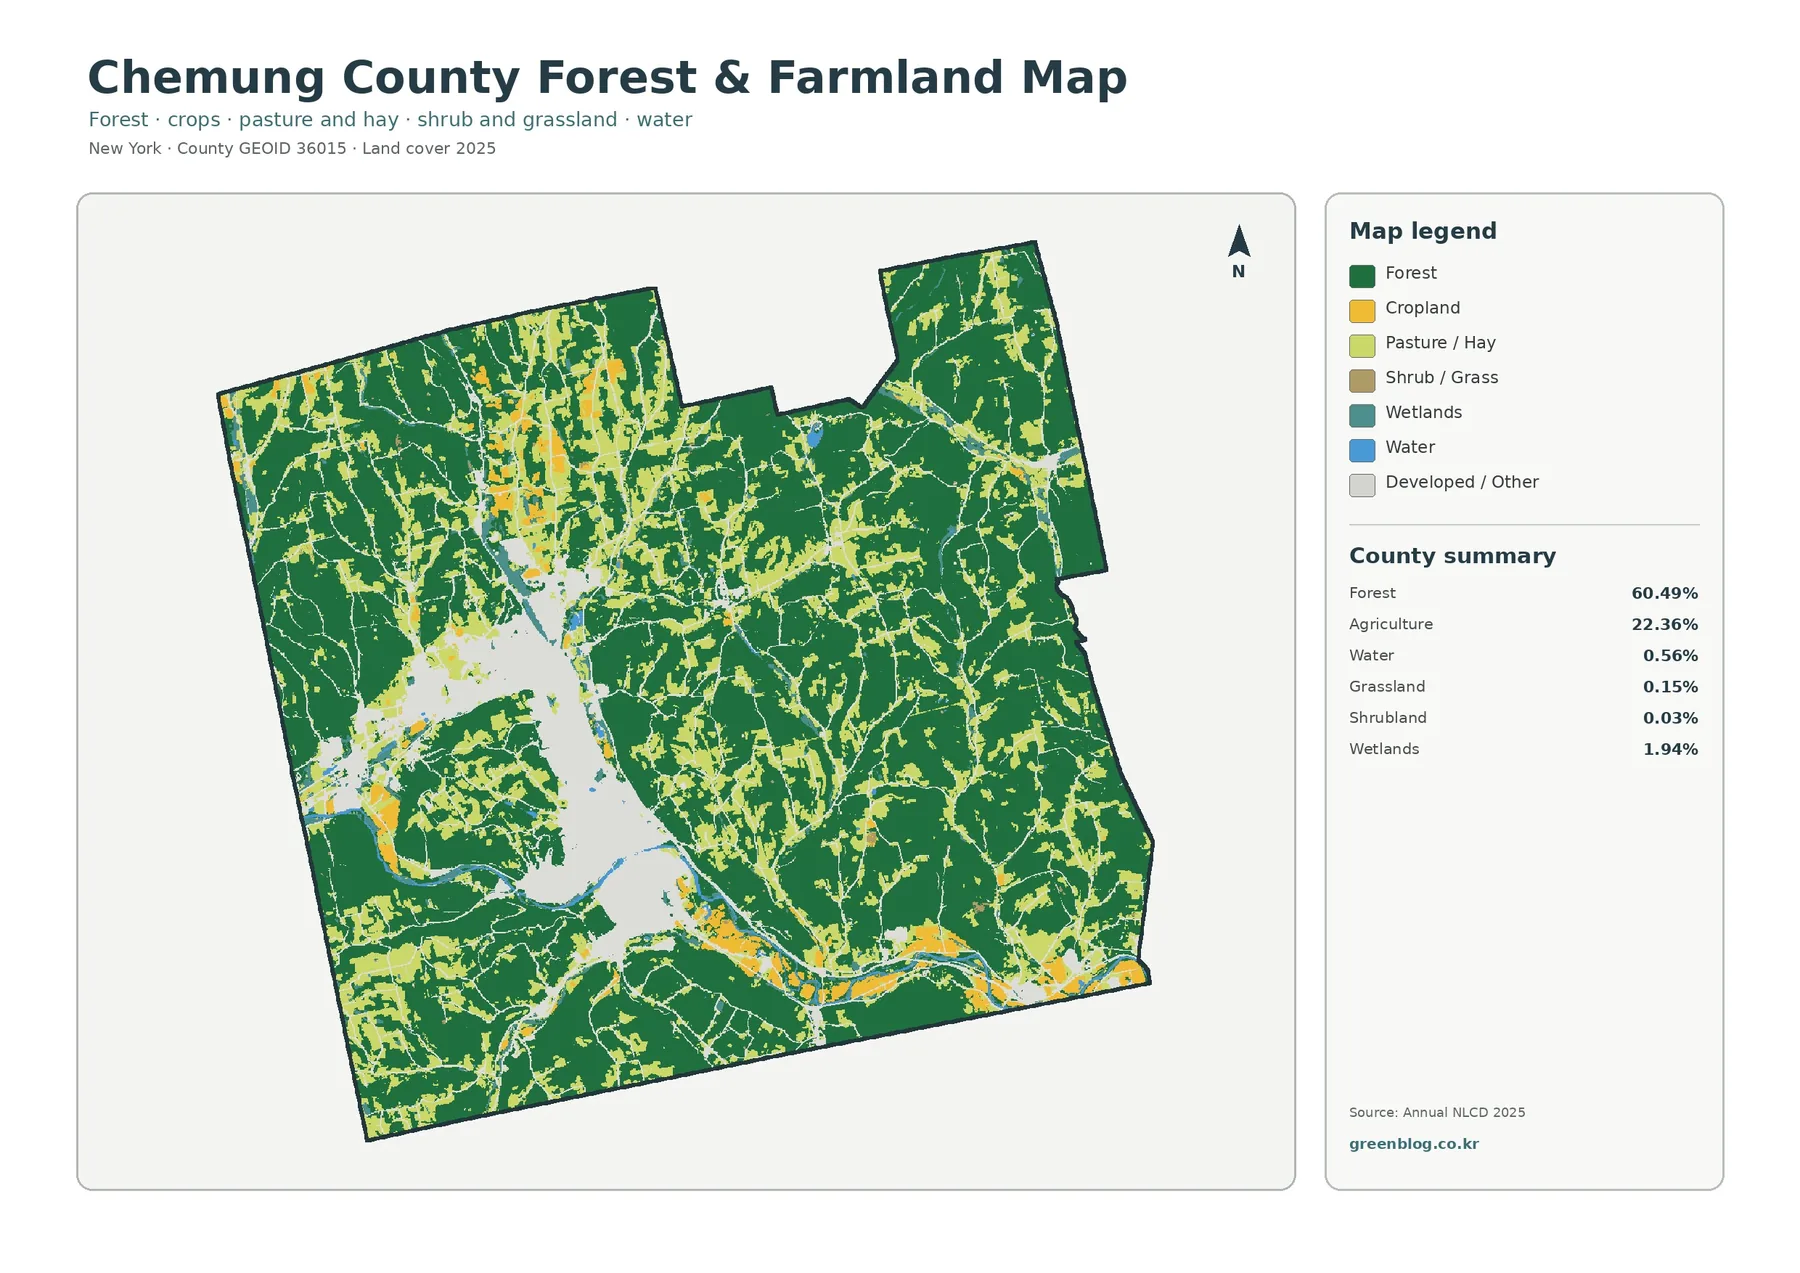
The northwest contains several comparatively broad agricultural openings, while smaller strips and pockets continue through north-central and southern valleys. Wooded land surrounds many of those openings, producing numerous forest edges rather than one sharp boundary between farming and woods. That distinction matters for habitat comparison, agricultural landscape studies, and classroom discussions about how topography and existing settlement coincide with different land-cover classes.
Land-cover classification still has limits at this scale. Annual NLCD is raster based, which means the landscape is represented by a grid of cells. A single cell can contain more than one real-world surface, such as a hedgerow, field edge, narrow road, and nearby lawn. The assigned class generalizes that mixed scene. Readers should therefore avoid treating the visible color boundary as if it were a surveyed property line.
For local context, Chemung County’s Natural Resources Inventory is a useful companion because it brings together information about forests and other natural features for planning purposes. The county’s Agricultural and Farmland Protection Board provides a separate policy and program context for agricultural districts and farmland protection. Using those resources alongside the map helps keep two different questions separate: what the satellite-based land-cover classification shows, and how land is managed or protected through local programs.
Impervious surfaces sharpen the Elmira footprint
Impervious surface refers to rooftops, pavement, parking areas, and other surfaces that greatly reduce the amount of water that can soak directly into the ground. On the Chemung County impervious-surface map, the strongest values gather around Elmira and adjacent developed areas. Several thinner branches extend away from that core along roads and smaller settlements, while much of the forested county remains close to the lowest impervious category.
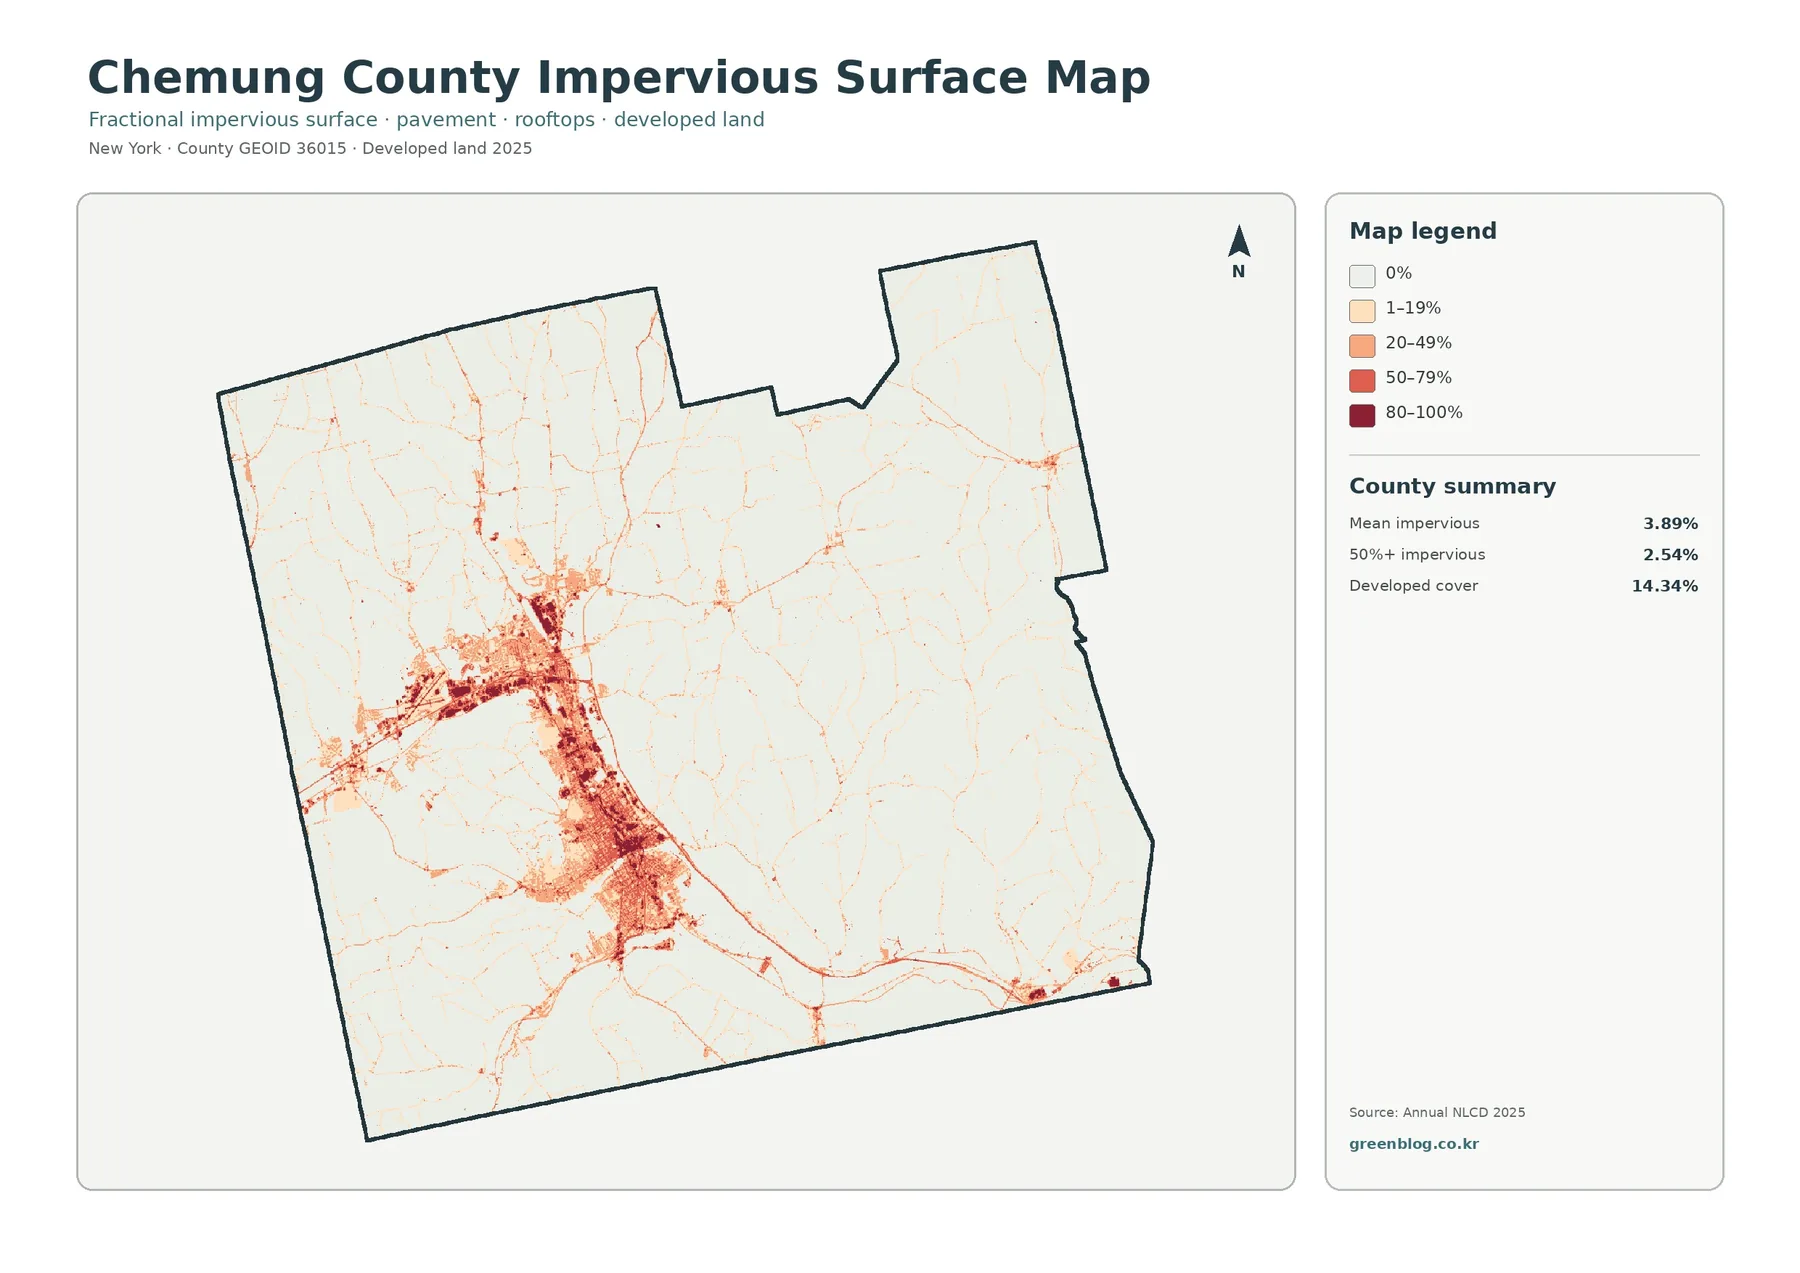
The map summary reports a mean impervious value of 3.89 percent across the county and shows 2.54 percent of the county in cells that are at least 50 percent impervious. Those numbers should not be expected to match the 14.34 percent developed-cover figure from the general map. The two products measure related but different things. A low-density residential cell may be classified as developed even though grass, trees, and other pervious surfaces occupy much of the same cell. The impervious product instead estimates how much of the surface is sealed.
This distinction can support discussions about stormwater, transportation corridors, and the intensity of built development. A concentration of impervious cover, however, is not enough by itself to prove why flooding, runoff, or heat occurs at a particular location. Slope, drainage infrastructure, soils, rainfall, stream conditions, and many other factors also matter. The map is best used to identify broad patterns that deserve closer investigation, not to substitute for engineering or site-specific analysis.
Mapped change from 1985 to 2025 is selective, not uniform
The change map compares classified cells from 1985 and 2025. Most of Chemung County remains in the no-class-difference background, while colored change cells are scattered unevenly. Areas classified as changing to developed land are most noticeable around the Elmira area and along portions of the westward and southern developed corridors. Smaller forest-loss, agricultural-loss, wetland-difference, and other-change cells appear in dispersed patches across the county.
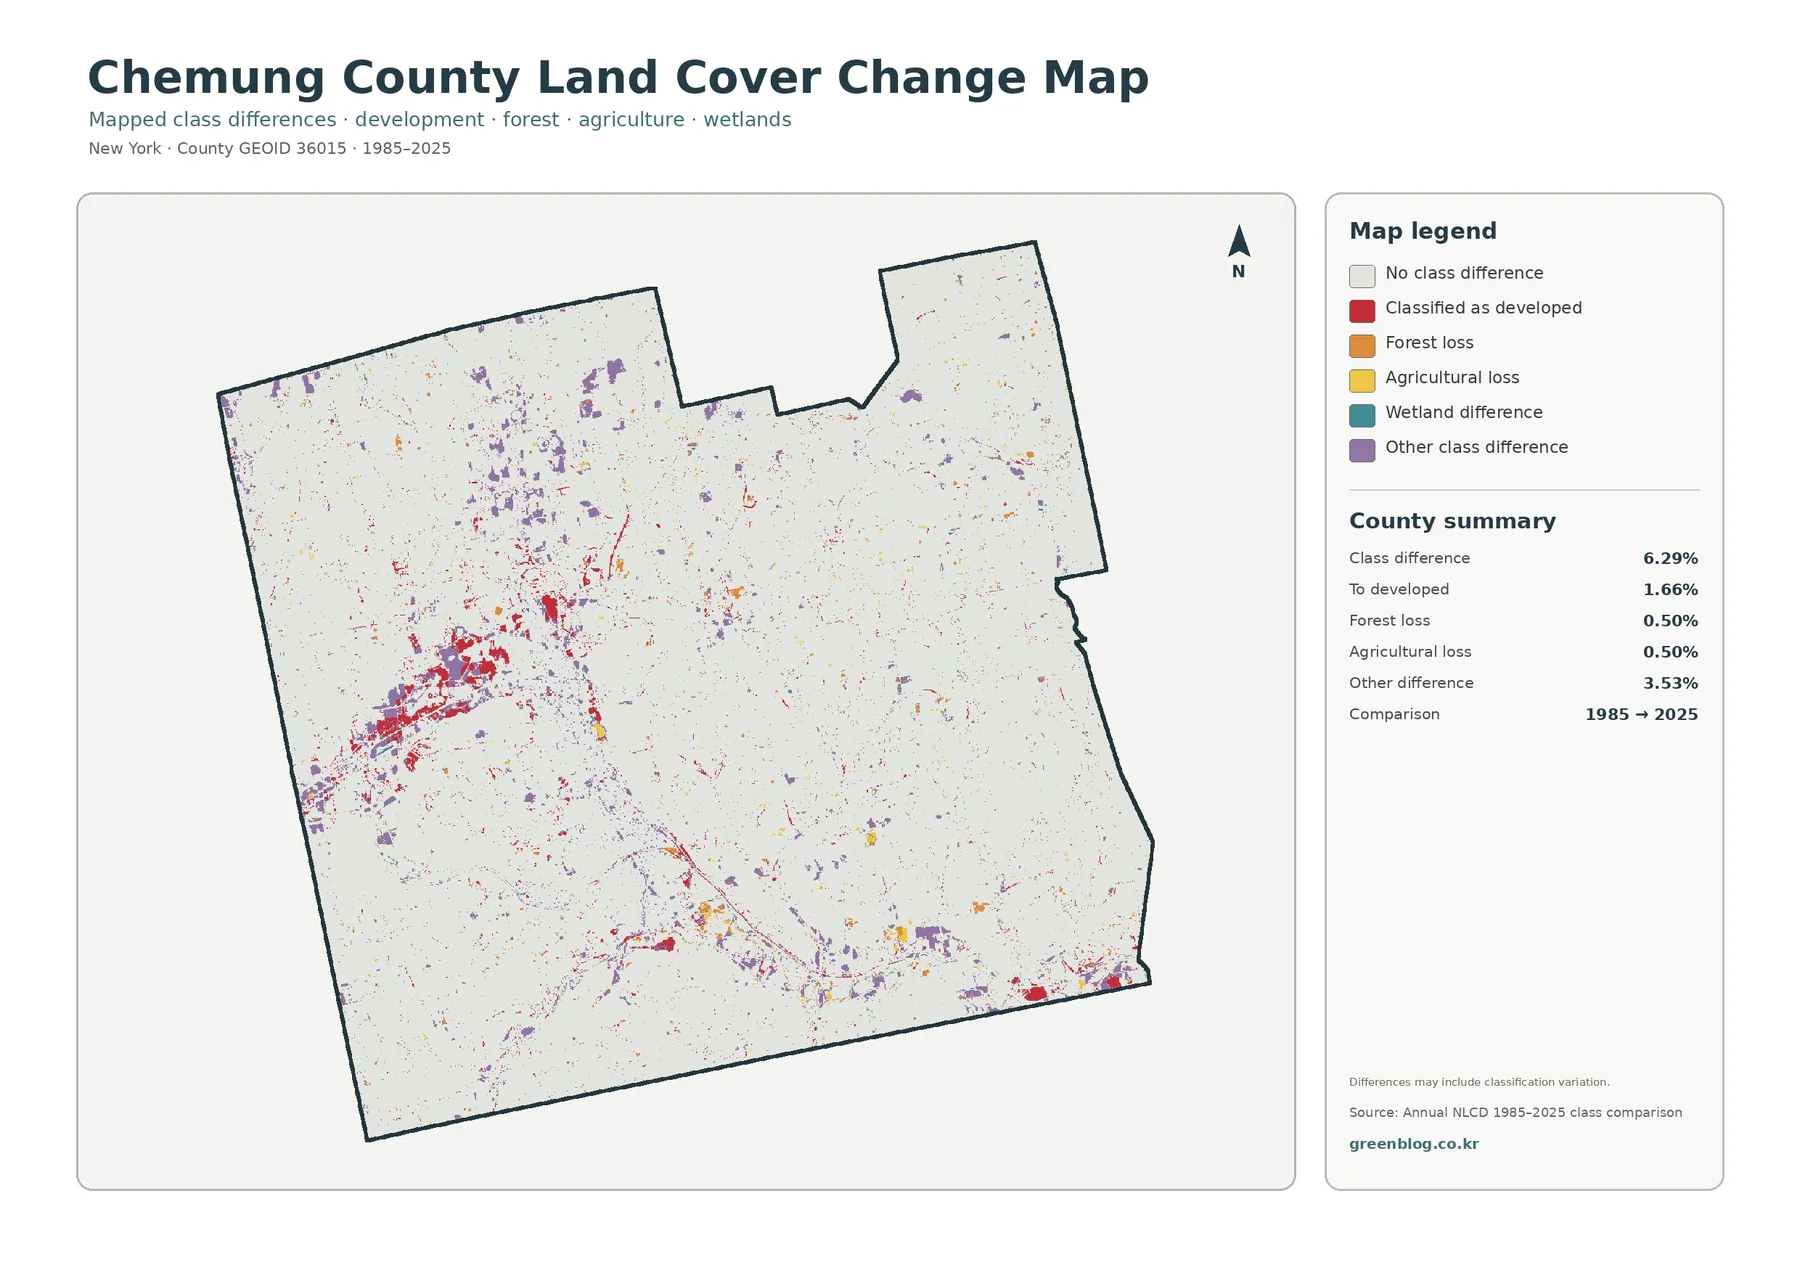
The summary shows class differences across 6.29 percent of the county. Cells mapped as changing to developed cover account for 1.66 percent, forest loss for 0.50 percent, agricultural loss for 0.50 percent, and other differences for 3.53 percent. These figures are useful for describing the map, but they need cautious interpretation. A difference between two classifications can represent real landscape change, classification variation, sensor differences, or the way mixed cells were assigned in each period.
For that reason, an isolated colored pixel should not be described as proof of a particular subdivision, logging event, field abandonment, or wetland conversion. A stronger workflow is to locate a cluster on the change map, compare it with the current land-cover and impervious maps, and then consult imagery or local records if the exact history matters. The four-map set supports that progression from broad screening to more detailed research.
What the map set can be used for
For education, the maps provide a compact way to discuss how a wooded Southern Tier county can also contain agricultural valleys and a concentrated urban center. The general map works well as an overview, while the forest-and-farmland version helps students focus on rural land cover without the full legend competing for attention. The impervious map introduces the difference between a developed classification and the physical amount of sealed surface.
For watershed or habitat work, the maps can help identify broad relationships among forest, agriculture, developed land, wetlands, and water. They can also provide presentation graphics for early planning conversations. The change map adds a historical comparison layer, but it should be presented as a classification comparison rather than a definitive inventory of every land conversion between 1985 and 2025.
For local planning, the strongest value is orientation. A reader can quickly see where the Elmira development concentration sits relative to large forested areas and agricultural openings. That overview can guide questions for more detailed county GIS, zoning, parcel, floodplain, transportation, or conservation datasets. It cannot answer those detailed questions on its own.
Important limits before using the maps
Land cover describes what is physically covering the ground in a classification system. It is not the same as legal land use, zoning, ownership, easements, or development rights. The maps also generalize real features into raster cells, so narrow roads, small ponds, forest edges, and mixed residential landscapes may be simplified. Conditions that changed after the mapped observation period may not appear.
These limitations become more important as the intended decision becomes more specific. A countywide map is suitable for comparison and regional context. Property transactions, permitting, wetland determinations, boundary questions, engineering, and survey work require authoritative local records or field-based information. Treat the four maps as a visual research layer rather than a parcel survey.
Download the four Chemung County maps
The ZIP package contains four original JPG maps: the general land-cover map, forest-and-farmland map, impervious-surface map, and 1985–2025 land-cover change map. The article uses WebP previews for faster viewing, while the JPG files are better suited to offline reference, layout work, and printing.
Frequently Asked Questions
What is the dominant land cover in Chemung County?
Forest is the dominant mapped class. The 2025 summary in the supplied map reports 60.49 percent forest, compared with 22.36 percent agriculture and 14.34 percent developed cover. The strongest developed concentration is around Elmira, while broad forest areas occupy much of the county outside the urban corridor.
Why does the impervious percentage differ from developed land cover?
Developed land is a land-cover class, while impervious surface estimates the share of a cell covered by pavement, rooftops, and similar sealed materials. A residential area can therefore be classified as developed even when lawns and trees keep its impervious percentage relatively low.
Does every colored cell on the change map represent confirmed land conversion?
No. The map shows differences between the 1985 and 2025 classifications. Some differences can reflect real change, while others may relate to classification methods, imagery, or mixed pixels. Site-specific conclusions should be checked against additional imagery or local records.
Map File Information
Download the map files associated with this page for reference, printing, and compatible visual projects.
- Included Files: Use only the versions confirmed in the article and supplied images
- File Type: Use the confirmed download contents
- Intended Use: Printing, education, presentations, and map-based projects
Related Maps
- Albany County Land Cover Map
- Bronx County New York Land Cover Map
- Cattaraugus County New York Land Cover Map
Sources and references
- MRLC Annual NLCD Data — national land-cover datasets and supporting products
- USGS Annual NLCD Land Cover Classification — class definitions and interpretation guidance
- Chemung County Natural Resources Inventory — official county context for forests and other natural resources
- Chemung County Agricultural & Farmland Protection Board — official information on agricultural districts and farmland protection
Green Map creates custom-edited map images using open geographic data sources such as geoBoundaries, Natural Earth, OpenStreetMap, and government open data.
These maps are edited visual materials, not raw data files, and are provided for education, documents, presentations, and graphic reference.