Cattaraugus County sits in southwestern New York just north of the Pennsylvania line, and its land-cover pattern is much more wooded than a quick look at its towns and highways might suggest. The countywide map is dominated by forest, while farmland forms a broken network across gentler ground and valleys. Developed land is comparatively limited and concentrates around places such as Olean and along the routes that connect smaller communities. Four maps in this collection separate those patterns so they can be read without forcing every land-cover class into one crowded view.
The first map provides the broad picture. A second isolates forest and agricultural cover, a third focuses on impervious surface and developed land, and a fourth compares mapped classes from 1985 with 2025. Used together, they are useful for geography lessons, watershed context, environmental presentations, and preliminary planning research. They should not be treated as parcel maps or zoning records, because land cover describes what is on the ground rather than who owns a property or how the land is legally designated.
Table of Contents
A county shaped by extensive forest cover
Green occupies most of the general land-cover map, making forest the defining visual feature of Cattaraugus County. The strongest continuity appears across the southern half, where large wooded areas extend between scattered clearings, water bodies, and developed pockets. Farther north, agricultural colors become more frequent and form a patchwork with forest rather than replacing it completely. This north-to-south contrast is one of the easiest ways to orient yourself when reading the county at a glance.
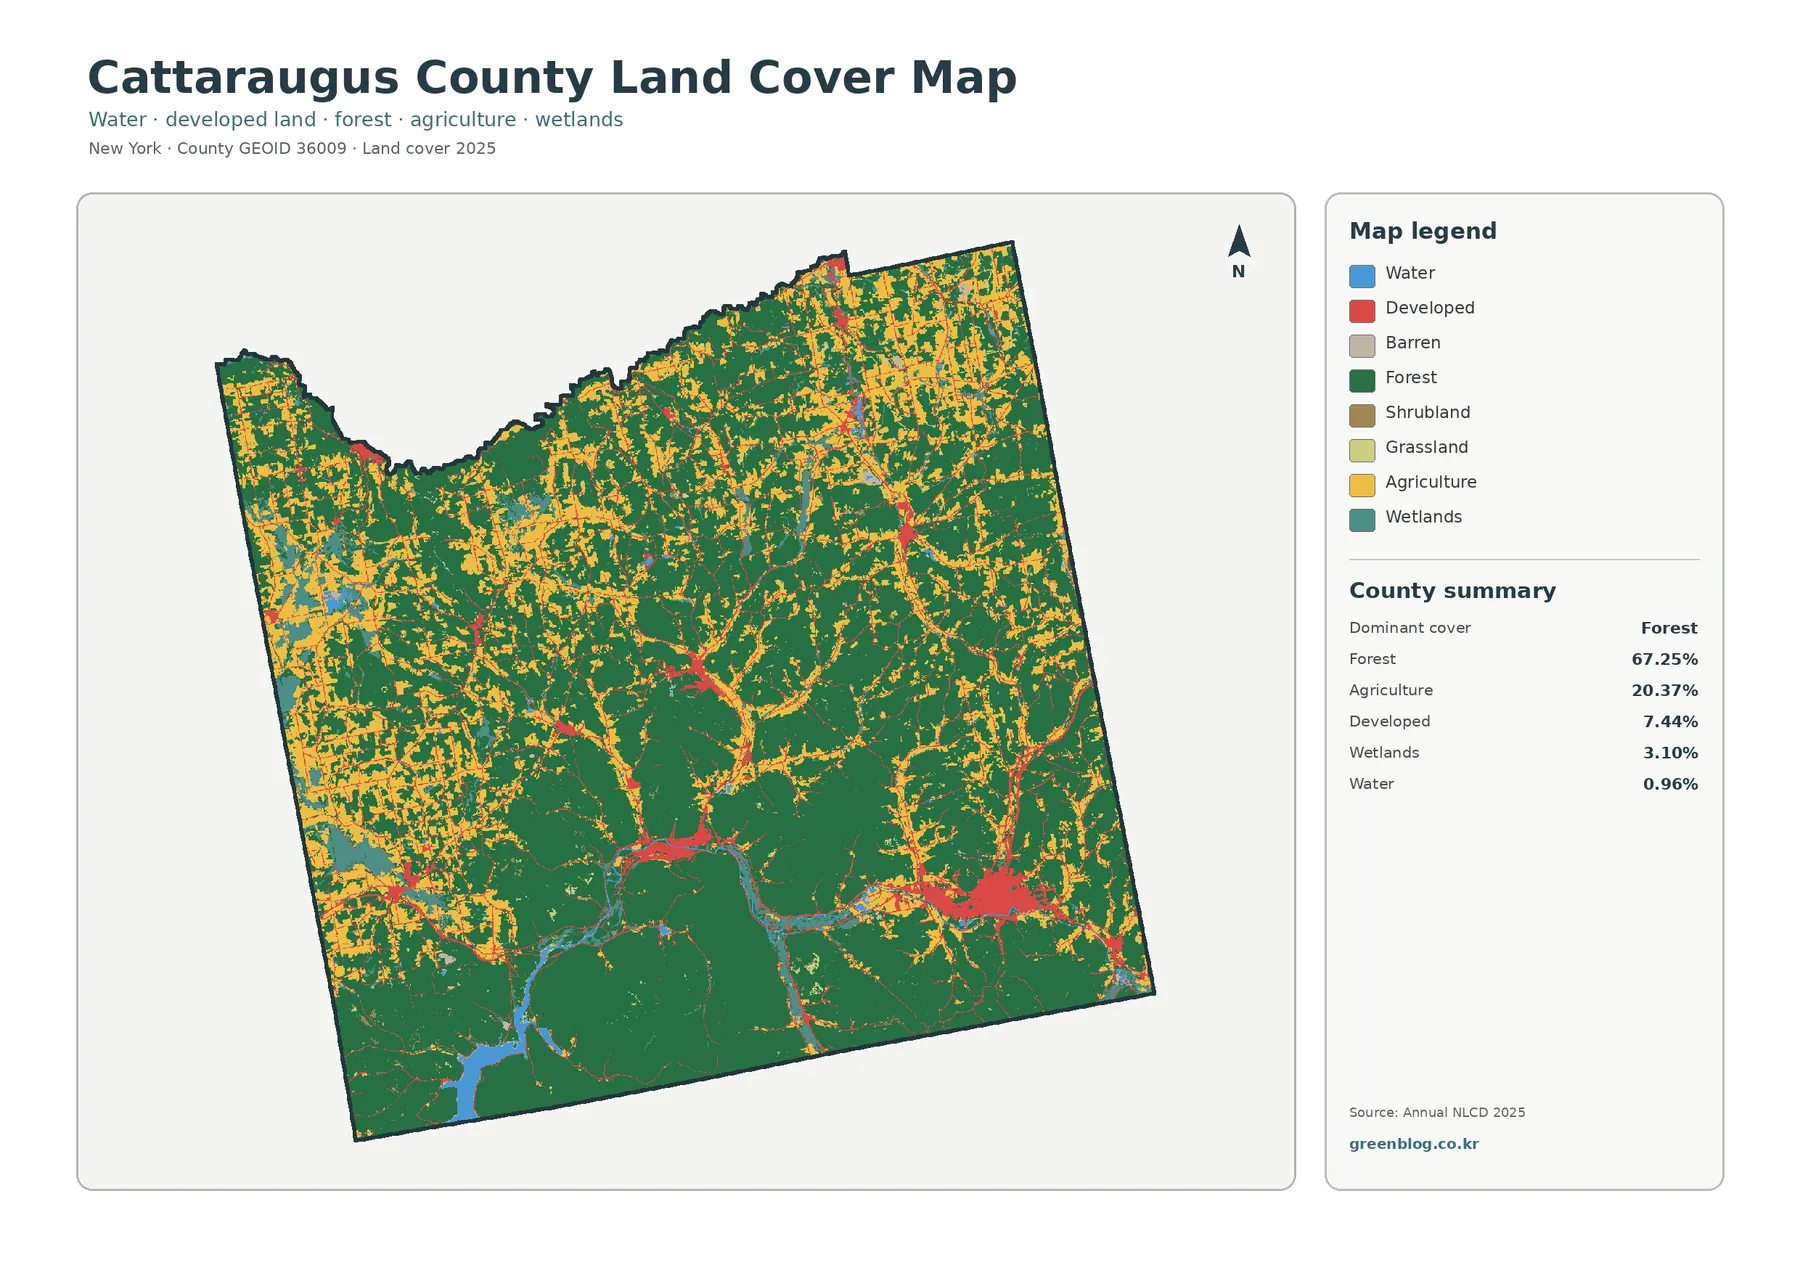
Agricultural land is not arranged as one continuous belt. Instead, it appears in irregular fields and elongated clusters that weave between wooded areas, especially in the northern and central parts of the county. Water and wetland classes are more localized, but they add useful reference points in the south-central landscape and along drainage corridors. Because several classes meet within short distances, the map is better for recognizing broad landscape mosaics than for drawing precise boundaries around individual properties.
Developed areas stand out even though they occupy far less space than forest. The Olean area in the southeast forms the clearest concentration, while smaller settlements appear as compact patches or narrow traces elsewhere. Roads and developed pixels often follow the same corridors, but the map only shows spatial association. It does not establish that one feature caused the other. That distinction matters when the map is used in planning discussions or environmental explanations.
Forest and farmland form a patchwork rather than a clean divide
The forest-and-farmland map strips away much of the visual detail and makes the county’s rural structure easier to compare. Broad forest cover remains dominant, particularly in the south, while cropland and pasture or hay appear repeatedly across the north and through several interior valleys. The result is not a simple “forest county” or “farm county.” Cattaraugus County contains both landscapes, and the boundary between them changes from one part of the county to another.
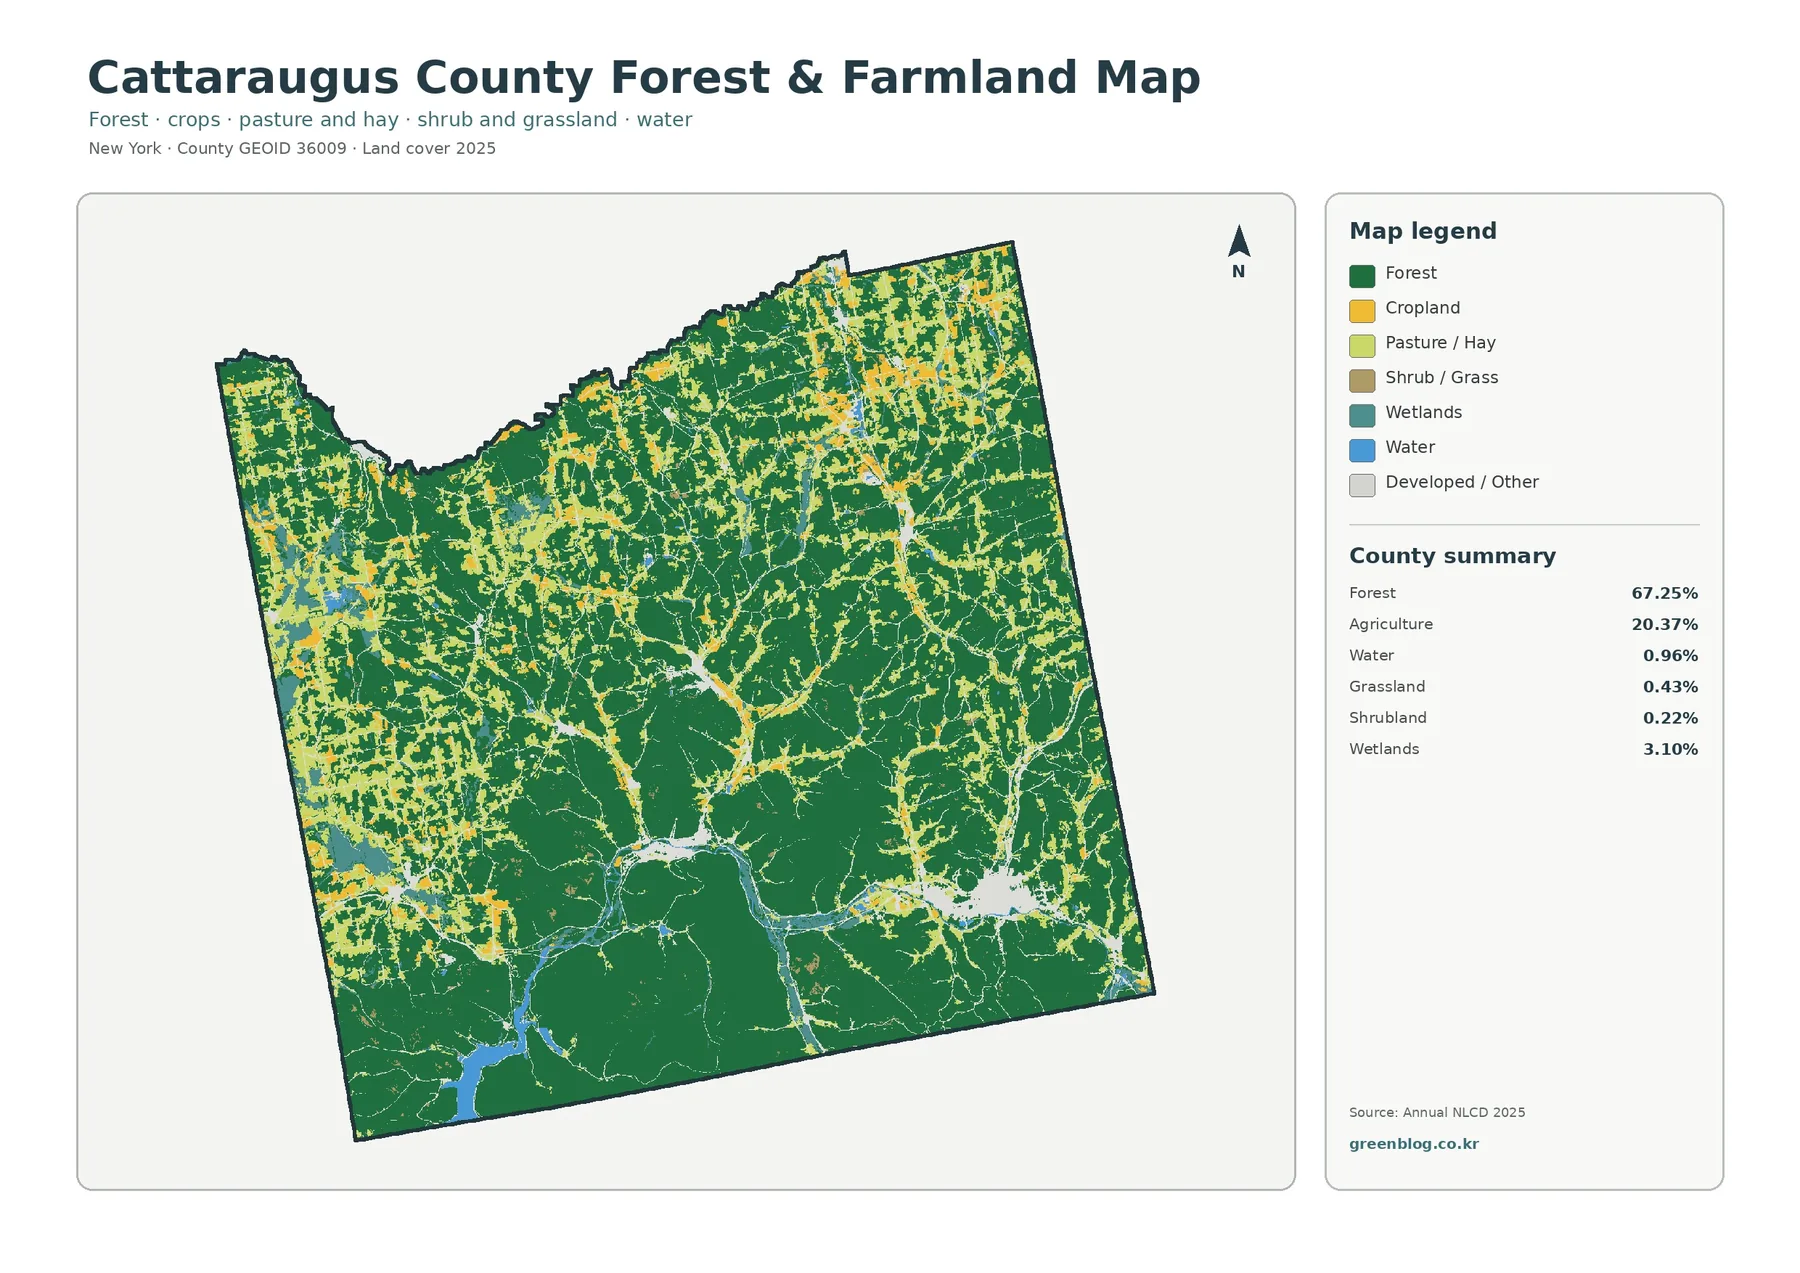
The northern edge contains some of the most persistent agricultural coloring on the map. Similar patches extend southward along more open terrain, but the wooded background becomes increasingly continuous toward the county’s southern border. New York State describes Cattaraugus County as a landscape of uplands, farms, forests, and waterways, and the county’s own planning program gives agriculture and farmland protection a formal place in long-range policy. Those sources provide useful context for the mixed pattern visible here without requiring the map to stand in for a land-use plan.
It is also important to keep the agricultural legend categories separate. Cropland is not identical to pasture or hay, and shrub or grass cover may have a different meaning again. A presentation that combines all yellow and tan areas into a single “farm” category would erase useful distinctions. For general readers, the safest approach is to use the simplified map to locate agricultural landscapes, then refer back to the legend before making a more specific statement about the type of cover.
Impervious surfaces reveal the county’s settlement footprint
An impervious surface is a hard surface, such as pavement or a building roof, that does not readily absorb rainfall. On this map, most of Cattaraugus County remains very light, while orange and red pixels cluster around towns and follow selected transportation corridors. That sparse pattern is characteristic of a largely rural county: development is visible, but it does not form the broad continuous urban fabric seen in a major metropolitan area.
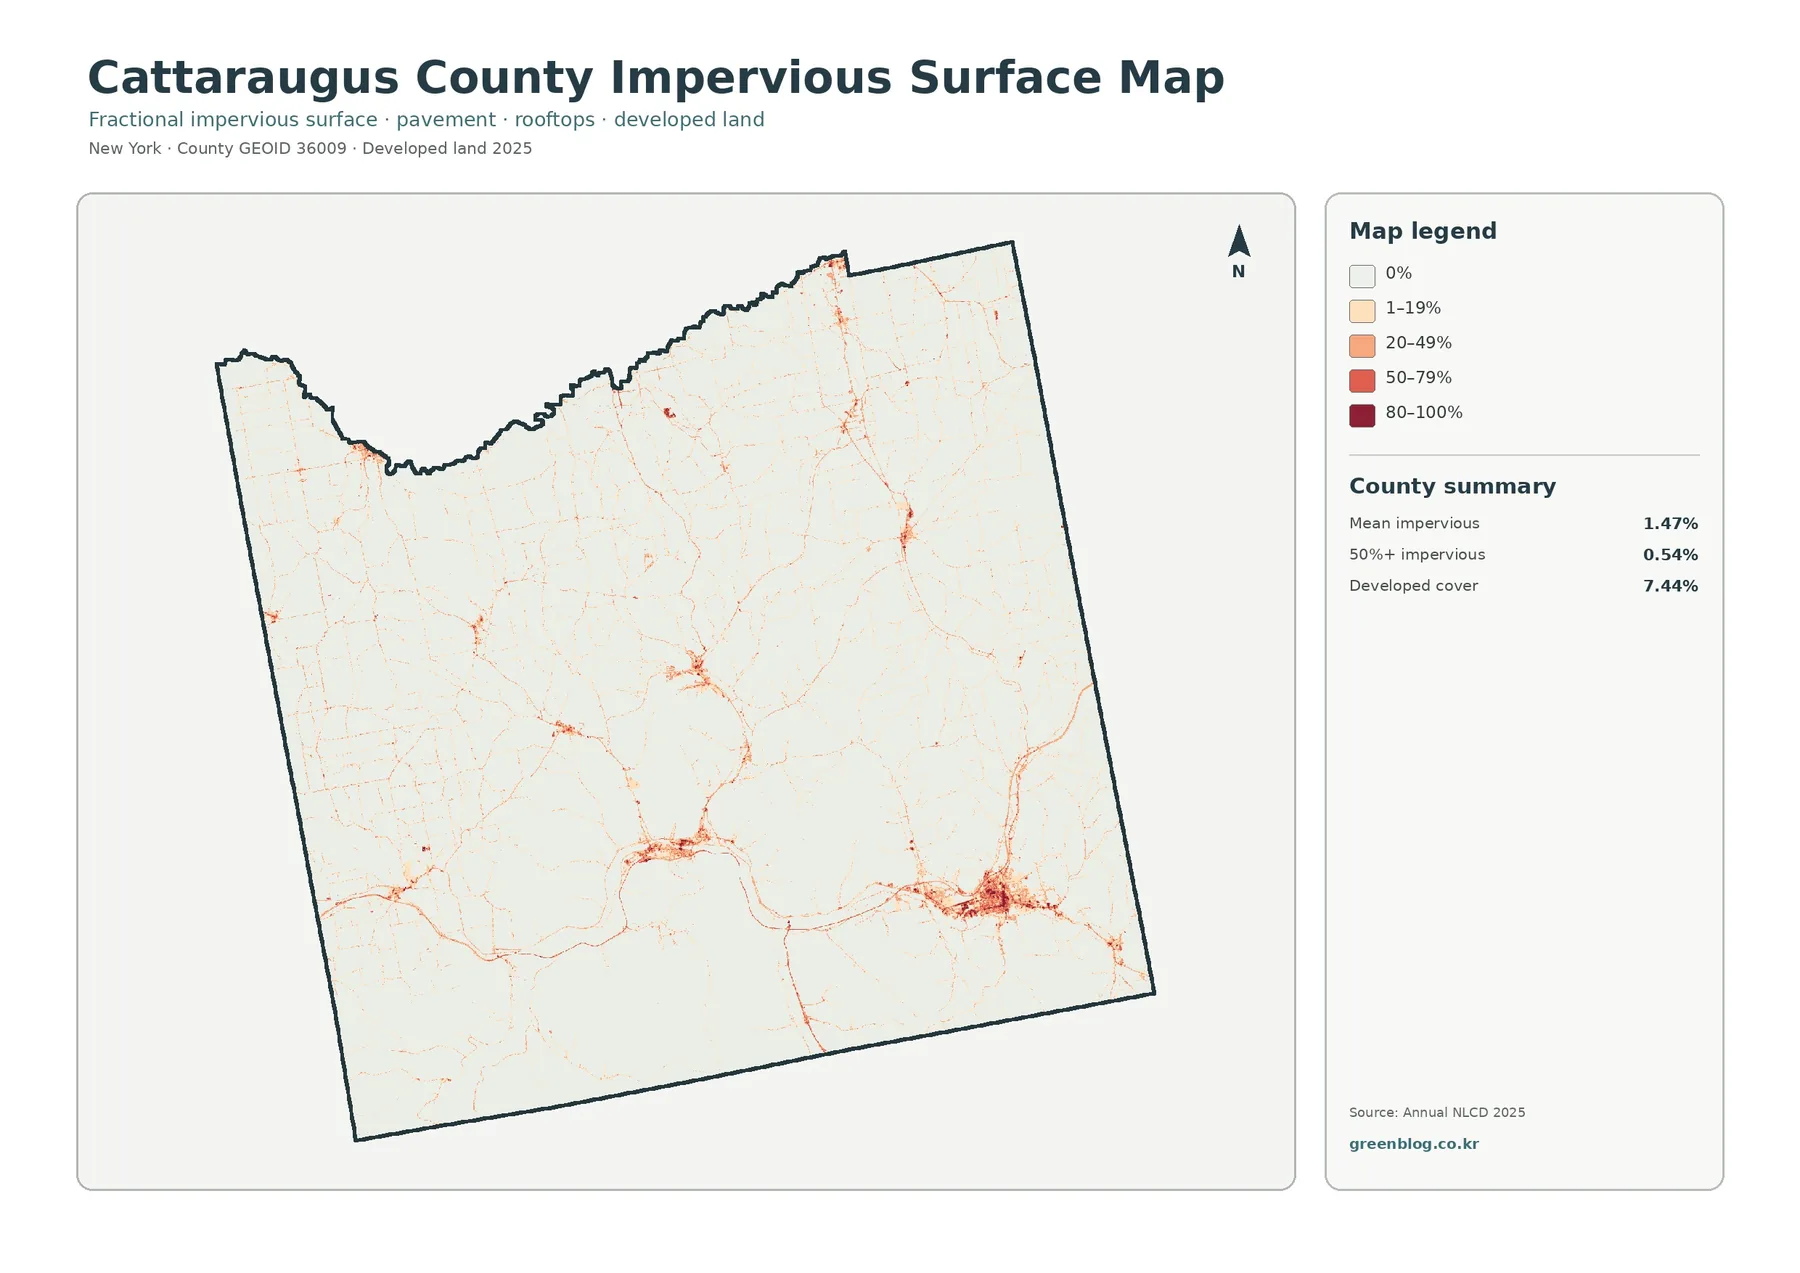
Olean is the most prominent developed cluster in the southeast. Smaller concentrations occur elsewhere, connected in places by thin lines of higher imperviousness. These traces help a reader locate the human footprint without losing the countywide context of forest and farmland. A pale area, however, should not be read as completely undeveloped. Low-density homes, narrow roads, and small structures can be generalized into the surrounding class when the source data are represented with 30-meter raster cells.
This map can be paired with water and wetland information when discussing watersheds or runoff in an educational setting. Impervious cover affects how rainfall reaches the ground, but it is only one factor among slope, soil, drainage infrastructure, vegetation, and storm intensity. For that reason, the map is useful for context rather than for predicting flooding or drainage performance at a specific address. Those questions require dedicated hydrologic, elevation, and local engineering data.
What the 1985–2025 comparison actually shows
The change map compares classified land-cover states from 1985 and 2025. Most of the county is shown as having no class difference, while colored marks are scattered across the landscape where the classifications differ. Those marks include areas mapped as newly developed, forest loss, agricultural loss, wetland difference, and other changes. The pattern is dispersed rather than concentrated in a single sweeping front, so the most useful reading is to identify local clusters that deserve a closer look.
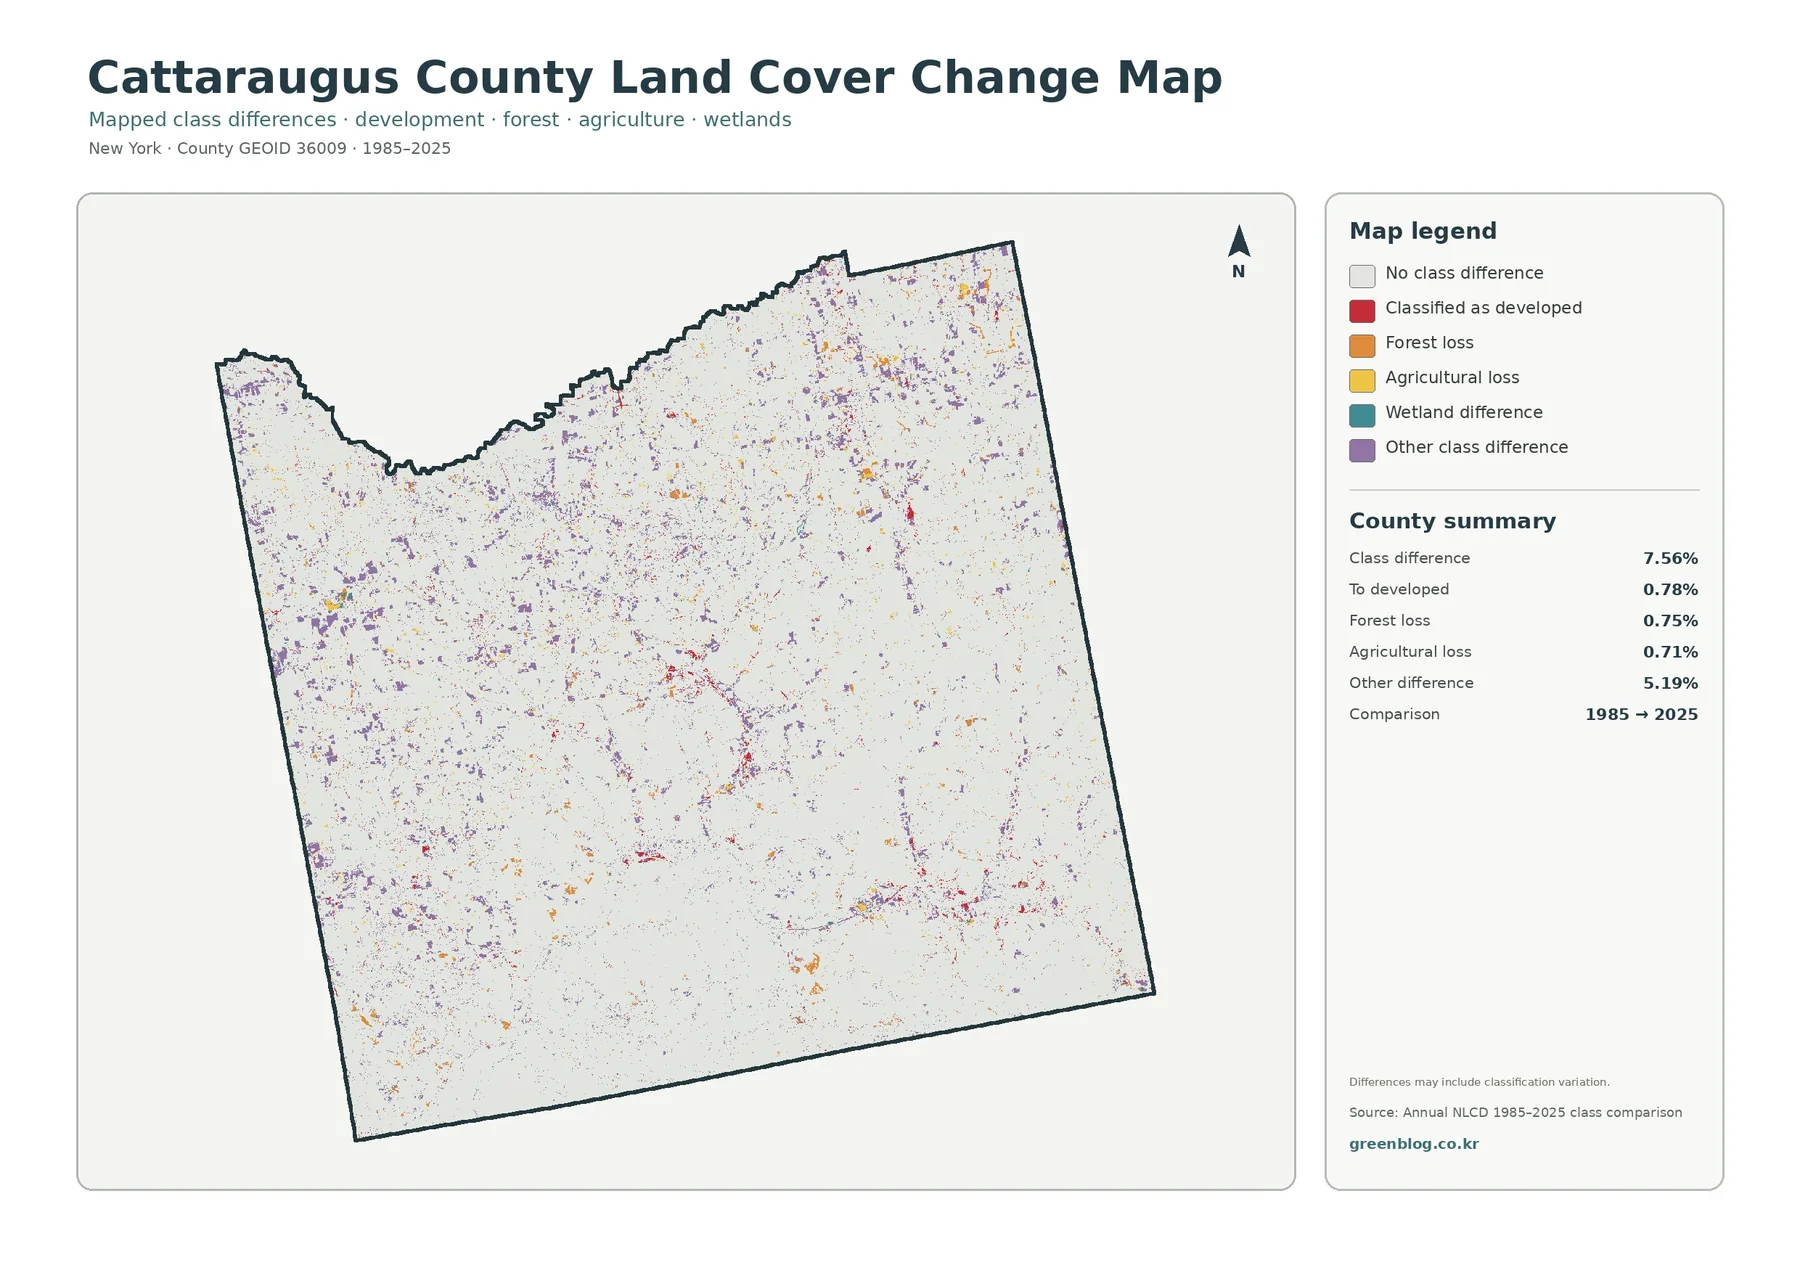
A colored pixel should not automatically be interpreted as a confirmed major land conversion on the ground. Satellite observations from different years can be affected by seasonal conditions, classification methods, edge effects, and mixed pixels. A mixed pixel occurs when more than one surface type falls within a single raster cell but the cell must still receive one representative class. These issues are especially noticeable along narrow streams, field edges, small clearings, and the boundaries between forest and agriculture.
The comparison is still valuable as a screening tool. A researcher can start with a cluster of change near a settlement, an agricultural edge, or a forest opening and then examine aerial imagery or local records for the same location. This turns the countywide map into a guide for more focused investigation rather than an endpoint. It is particularly useful in classroom projects where students need to formulate questions about landscape change before working with more detailed evidence.
How to use the four maps together
The maps are easiest to understand when they are read as a sequence. Begin with the general land-cover map to establish the dominant forest matrix and locate major agricultural, developed, wetland, and water areas. Move to the forest-and-farmland map to simplify the rural pattern. Then use impervious surface to isolate settlement intensity. Finish with the change map to see where classifications differ across the four-decade comparison. Each map answers a different question, so none needs to carry the full explanation by itself.
- For geography lessons, compare the more continuously forested south with the more fragmented farm-and-forest pattern farther north.
- For watershed study, locate water and wetlands first, then examine how developed surfaces are distributed nearby.
- For planning context, use the maps to identify broad landscape patterns before consulting official county plans, zoning, parcel, or infrastructure records.
- For presentations, place the four maps in the same order to move from current cover to rural structure, development intensity, and long-term class differences.
Cattaraugus County’s planning materials are a useful companion because they address the balance between rural and urban development and include agricultural development services. The county’s Agricultural and Farmland Protection program also provides a policy context for the farm landscapes visible in the northern and central portions of the maps. These references do not verify every individual colored cell, but they help explain why forest, agriculture, natural resources, and community development are all relevant when describing the county.
Resolution, classification and other limitations
Annual NLCD is raster data, meaning the landscape is represented as a grid of cells rather than as surveyed parcel polygons. At the commonly used 30-meter scale, a cell can contain several real-world features but still be assigned one class. Small buildings, narrow roads, stream edges, hedgerows, and tiny wetlands may therefore be simplified or absorbed into a neighboring category. The maps are designed for countywide pattern recognition, not for determining exact conditions at a lot line.
Classification also belongs to a particular observation period. New construction, timber harvest, regrowth, field abandonment, crop rotation, or wetland changes may occur after the mapped year. A crisp boundary on the image is not a legal boundary, and it should not be used to decide ownership, zoning, permitting, or environmental compliance. For site-specific work, check current county GIS layers, recent aerial imagery, property records, and the agency dataset that matches the question being asked.
Download the four map files
The ZIP package contains the four original JPG maps used for this article: general land cover, forest and farmland, impervious surface and developed land, and the 1985–2025 land-cover change comparison. They can be used as reference graphics for lessons, presentations, reports, or countywide visual comparisons.
Frequently Asked Questions
Is land cover the same as land use or zoning?
No. Land cover describes the physical surface, such as forest, water, agriculture, wetland, or developed cover. Land use and zoning describe human activities or legal designations. A land-cover class cannot tell you the zoning district, ownership, or permitted use of a parcel.
Why are some roads, buildings, or small streams missing?
The source is generalized raster data. Features smaller or narrower than a cell may be combined with the surrounding class, and a mixed cell must still receive one representative label. Use higher-resolution aerial imagery or county GIS when individual features matter.
Does every colored mark on the change map prove a real land conversion?
Not by itself. Some marks may reflect genuine change, while others can be influenced by classification differences, seasonal imagery, or edge effects. Treat the change map as a way to locate areas for follow-up and verify important sites with additional imagery or official records.
Map File Information
Download the map files associated with this page for reference, printing, and compatible visual projects.
- Included Files: Use only the versions confirmed in the article and supplied images
- File Type: Use the confirmed download contents
- Intended Use: Printing, education, presentations, and map-based projects
Related Maps
- Allegany County New York Land Cover Map
- Bronx County New York Land Cover Map
- Broome County New York Land Cover Map
Sources and references
- MRLC Annual NLCD Data – source access for land-cover and change datasets
- USGS Annual NLCD Land Cover Classification – class definitions and methodology context
- U.S. Census Bureau TIGER/Line Shapefiles – county boundary data
- Cattaraugus County Planning – county planning and agricultural development information
- Ag in Cattaraugus County – county agriculture and farmland-protection information
Green Map creates custom-edited map images using open geographic data sources such as geoBoundaries, Natural Earth, OpenStreetMap, and government open data.
These maps are edited visual materials, not raw data files, and are provided for education, documents, presentations, and graphic reference.