An Aomori Prefecture Map is unusually easy to recognize because two peninsulas reach north on opposite sides of Mutsu Bay. Tsugaru Peninsula forms the western arm, Shimokita Peninsula forms the eastern arm, and the prefecture broadens southward toward Akita and Iwate. That coastal geometry makes a municipal map more useful than a simple list: readers can see why some communities face the Sea of Japan, others line the Pacific, and many are arranged around the enclosed waters of the bay.
The collection provides three matching views: a pastel administrative map with labels, a labeled black-and-white map, and an unlabeled outline. Each supplied preview is a 1,200 × 1,050-pixel WebP image, so the versions can be compared without changing scale or orientation. Teachers can pair a reference sheet with a labeling exercise, while editors and presentation designers can choose between immediate color separation and a quieter base for their own notes.
Municipal labels create the main design challenge. Four compact areas near Hirosaki are identified by the numbers 1–4 and a separate key, several narrow coastal names are rotated, and Nakadomari appears both on the Tsugaru Peninsula and in a detached area at the upper left. These visible choices matter when the map is reduced for a worksheet or placed beside a table, and they are worth checking before the file is used in a formal publication.
Table of Contents
Included in This Collection
All three images share the same municipal boundaries, broad landscape frame, and neighboring land context along the southern edge. What changes is the amount of guidance placed over that geometry. The color and monochrome maps name municipalities and bays, whereas the outline retains only the boundary network and coastline. Because the base remains consistent, a learner can move from identification to recall without having to interpret a second drawing style.
- Color administrative map: pastel fills separate adjoining municipalities, with blue water emphasizing Mutsu Bay and Aomori Bay.
- Labeled monochrome map: names, leader lines, numbered areas, bay labels, and municipal borders remain in a restrained black-and-white layout.
- Blank outline map: municipal divisions stay visible after labels, numbers, keys, and color fills are removed.
The mapped administrative pattern comprises 40 municipalities: 10 cities, 22 towns, and 8 villages. The artwork generally uses place names without adding “City,” “Town,” or “Village,” so it shows location and extent rather than legal classification. Anyone building a municipal table should therefore verify administrative status separately instead of inferring it from label size or color.
Reading an Aomori Prefecture Map Around Mutsu Bay
The western side is anchored by Aomori, Hirosaki, Goshogawara, Tsugaru, Kuroishi, and Hirakawa, with smaller towns and villages compressed into the central Tsugaru plain. Farther north, Sotogahama and Imabetsu occupy the upper Tsugaru Peninsula, while Goshogawara and Nakadomari extend through long or separated shapes. Aomori City sits at the head of Aomori Bay, providing a central point from which the western and eastern shores can be compared.
Across the bay, Mutsu covers much of Shimokita Peninsula. Oma, Sai, and Kazamaura cluster around its northern and western tip, and Higashidori runs along the Pacific-facing side. Yokohama, Rokkasho, and Noheji form a visual chain toward the prefecture’s main body. The curved coast and narrow municipal strips explain why several labels need vertical placement or leader lines rather than ordinary horizontal text.
The southeastern Nanbu area has a different rhythm. Hachinohe occupies the coast, Towada forms a large inland block, and smaller municipalities such as Gonohe, Sannohe, Nanbu, Shingo, and Takko fill the southern edge. On an Aomori Prefecture Map, this transition from compact coastal units to broader inland shapes helps readers distinguish the Hachinohe side from the peninsula-centered north and the denser Tsugaru cluster in the west.
Color Administrative Version
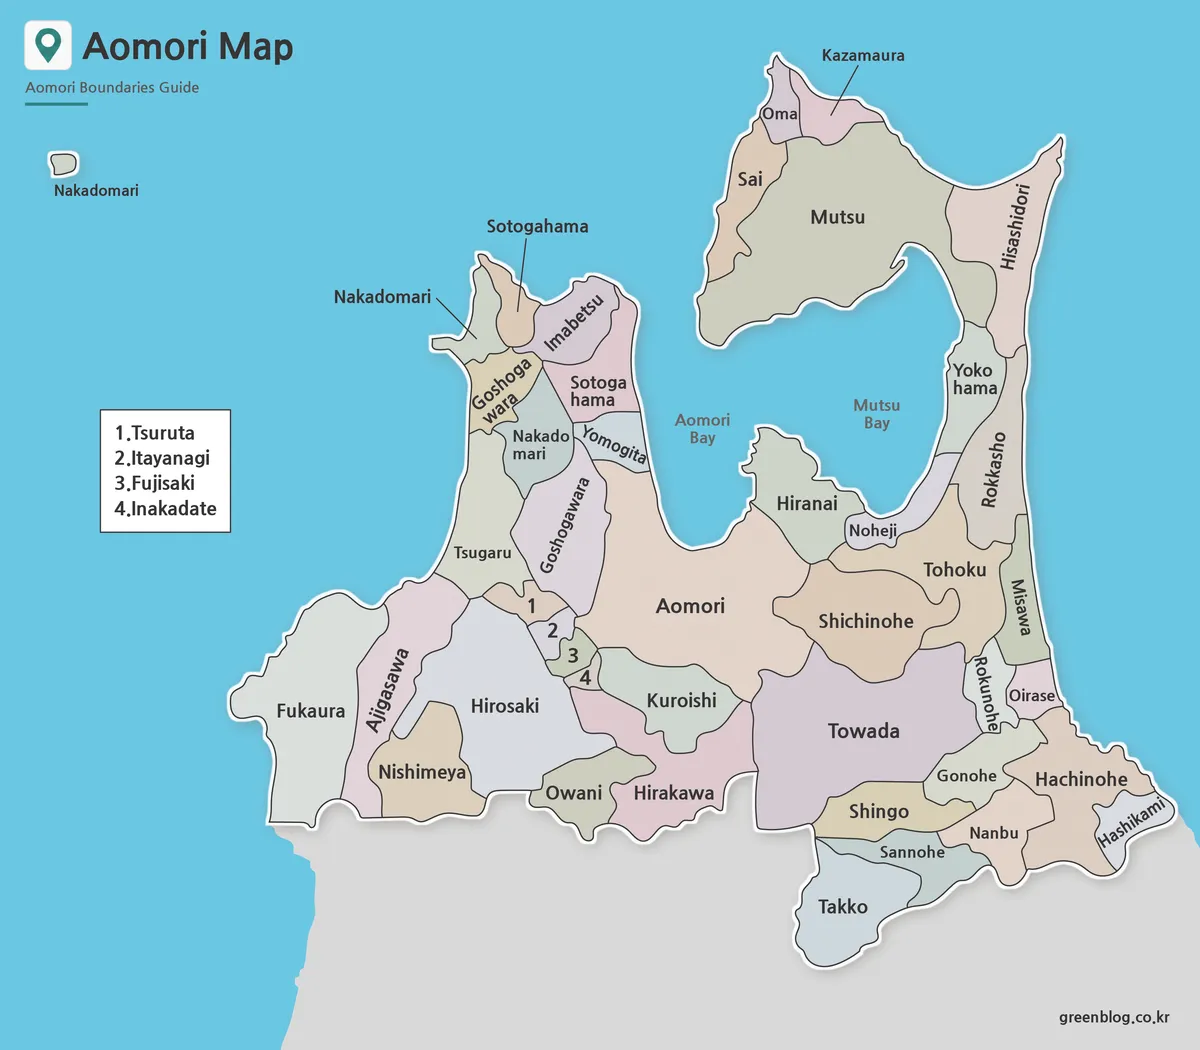
Pastel fills make the two peninsulas and the southern municipal groups readable at a glance. The color Aomori Prefecture Map is particularly helpful near Hirosaki, where four numbered polygons would otherwise blend into their larger neighbors, and along the eastern coast, where Misawa, Rokunohe, and Oirase occupy slim adjoining spaces. Blue water also turns Mutsu Bay into the organizing center of the composition instead of leaving it as empty background.
Choose this version for a screen presentation, an answer key, or a regional comparison in which adjacent boundaries must separate immediately. The palette does not encode population, terrain, climate, or economic categories; it functions only as a visual divider. If statistics are added, use distinct symbols or a new legend so the original municipal colors are not mistaken for data.
Black and White Printable Version
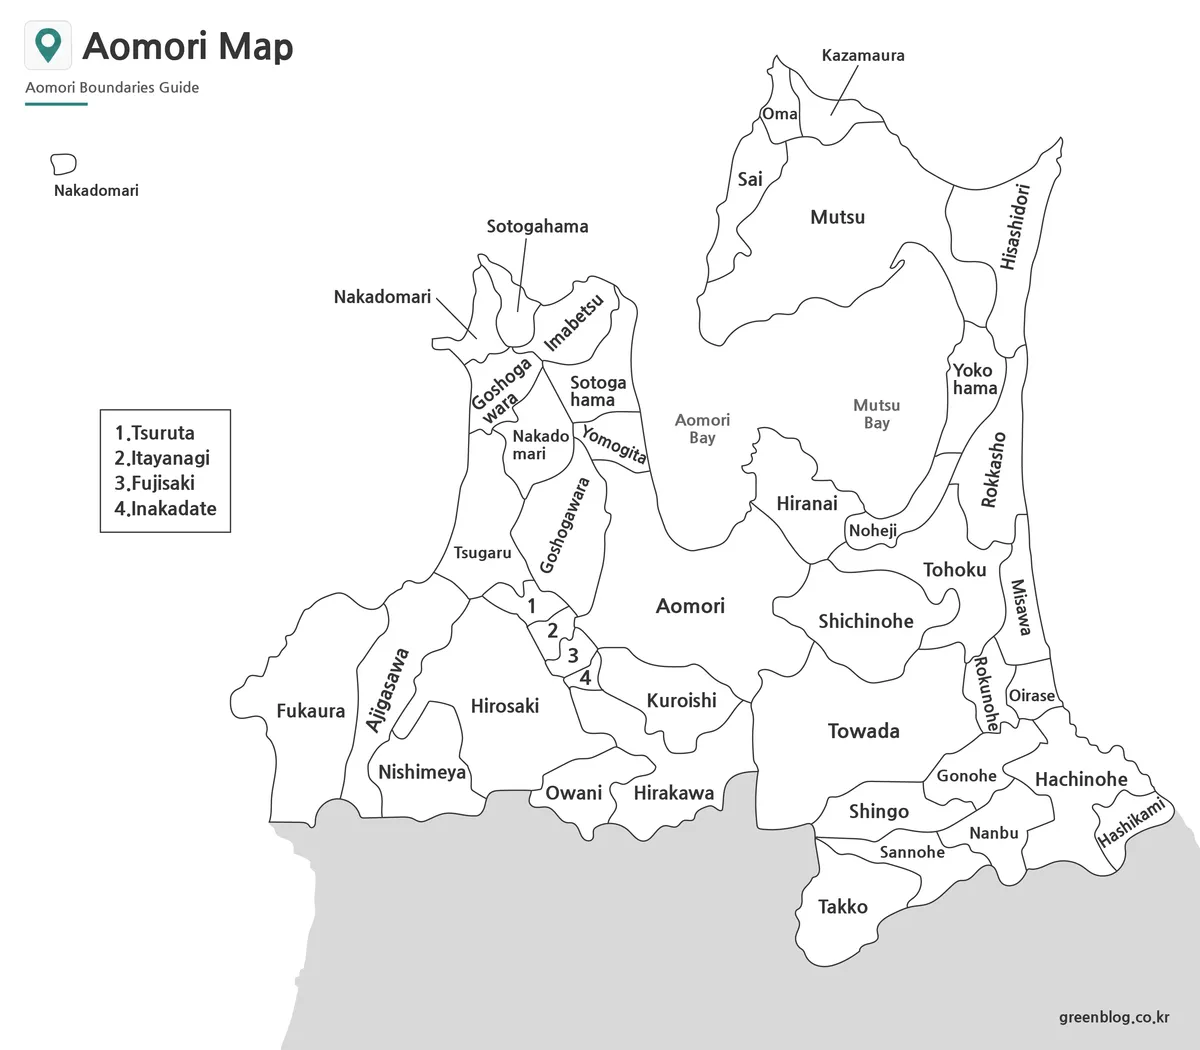
The monochrome Aomori Prefecture Map keeps the same labels, key, and boundary lines while removing the pastel fills and blue sea. That lower-contrast arrangement fits grayscale handouts, study packets, and reports in which color would compete with surrounding text or charts. Open white areas also leave room for pencil marks, highlighter groups, or numbered references tied to an accompanying table.
At the supplied 1,200 × 1,050 resolution, print legibility depends on output size and printer quality. Preserve the aspect ratio, avoid repeated recompression, and inspect a proof before using a small layout. The key for Tsuruta, Itayanagi, Fujisaki, and Inakadate, the leader line for Kazamaura, and the detached Nakadomari shape are sensible checkpoints because they contain the most easily lost detail.
Blank Outline Map for Editing
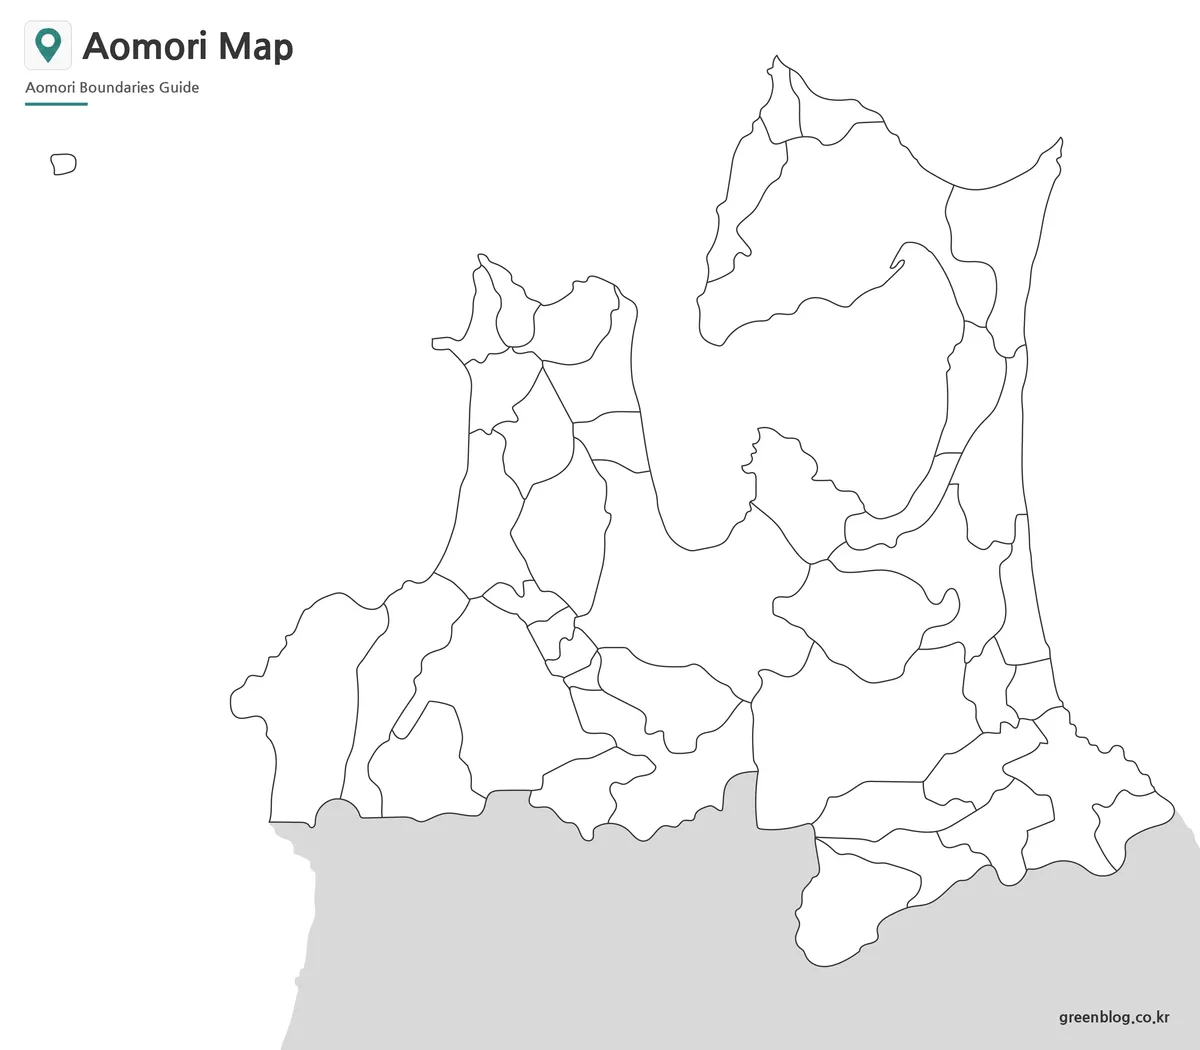
Removing names and fills turns the Aomori Prefecture Map into an assessment and annotation base. Students can identify the two peninsulas, label the 10 cities, shade western Tsugaru and southeastern Nanbu, or mark which municipalities touch Mutsu Bay. A project designer can instead add selected city symbols or statistical categories without first covering printed labels.
The outline is a flat raster image, not a confirmed vector or layered source file. Enlarging it beyond the available pixel dimensions may soften the narrow coastal lines, so annotations should be tested at the final size. Keep the small detached shape at the upper left inside the crop; although it appears isolated, it represents part of Nakadomari and is not unused margin.
Choosing the Right Version for a Project
Selection begins with the reader’s task. Use color when municipal separation and peninsula structure must be understood quickly; choose monochrome when names need to remain visible in a restrained document; reserve the blank outline for recall exercises or custom categories. A labeled Aomori Prefecture Map is the safer reference for discussing the coast because the outline version does not identify Mutsu Bay, Aomori Bay, or any municipality.
- Place the color map beside the blank outline to create a reference-and-practice pair for all 40 municipalities.
- Crop an enlarged secondary view of the Hirosaki-area cluster when the four numbered units must be discussed on a classroom screen.
- Use the monochrome map next to a municipal table and connect entries with short callouts rather than covering narrow regions with long notes.
- Add a separate Japan locator when the audience may not recognize Aomori at the northern end of Honshu.
None of the three previews shows roads, railways, ferry routes, topography, or a distance scale. Route planning therefore requires a current transport source, while formal administrative work based on the Aomori Prefecture Map should be checked against current prefectural information. Within those limits, the consistent geometry makes the set effective for comparing how labels, color, and empty annotation space change the reading of the same coast-heavy region.
Frequently Asked Questions
The preserved FAQ below answers the main questions about municipal coverage, choosing an editing base, and print use. When preparing a small handout, compare the numbered central cluster and thin coastal labels against the full-size preview before distributing copies.
Does the Aomori Prefecture Map include municipal boundaries?
Yes. Cities, towns, and villages are included throughout the collection.
Which version is best for editing?
The outline map is the most flexible option for graphic editing, custom labeling, and infographic projects.
Can the maps be printed in large format?
Yes. The files were prepared in high resolution and reviewed for A3 printing.
Map File Information
Select the color reference, labeled monochrome view, or blank municipal outline according to your print, lesson, presentation, or annotation task.
- Included Versions: Color · Black and white · Outline
- File Type: Image files
- Intended Use: Reference, classroom activities, presentation graphics, and annotation
Related Maps
Additional Resources
- About Aomori — Official Travel Guide — Read an official overview of the Tsugaru, Nanbu, and Shimokita regions and their geographic context.
Green Map creates custom-edited map images using open geographic data sources such as geoBoundaries, Natural Earth, OpenStreetMap, and government open data.
These maps are edited visual materials, not raw data files, and are provided for education, documents, presentations, and graphic reference.