A North Carolina State Map has to fit 100 counties into a long east-west shape that changes sharply from the far western border to the Atlantic coastline. This collection provides three matching county views: a pastel color map with names, a black-and-white labeled version, and an unlabeled boundary outline. All three previews use the same 1200×600 landscape composition, making it easy to compare versions without changing the underlying county geometry.
The western end contains many compact, irregular counties near Tennessee and Georgia. Central North Carolina shifts toward broader county shapes, while the east opens into river and sound shorelines before reaching the narrow barrier-island edge. The color and monochrome maps name Virginia, Tennessee, Georgia, South Carolina, the Atlantic Ocean, Albemarle Sound, and Pamlico Sound. They do not display cities, roads, terrain, travel routes, or statistical data.
This North Carolina State Map set is prepared as high-resolution A3 material and supplied as JPG files in a ZIP archive. The resources suit county-identification lessons, printed reference sheets, regional comparison slides, and carefully sourced thematic annotations. They are raster images rather than confirmed vector or layered source files, so users should not assume that each county can be selected independently in design software.
Table of Contents
Map Collection Overview
Every version preserves the state’s current 100-county framework. Cherokee and Clay form part of the far western end, Alleghany, Surry, Stokes, Rockingham, Caswell, Person, Granville, Vance, Warren, Northampton, Gates, and Currituck help define the long Virginia side, and Brunswick through New Hanover and the Outer Banks shapes establish the southeastern and eastern coast. The map’s length makes a landscape page essential for keeping these relationships visible.
- Pastel color map with all 100 county names
- Black-and-white county map with matching labels
- Blank state outline with county boundaries
- Landscape A3 high-resolution layout
- JPG image files grouped in a ZIP archive
Choose the color version for fast visual separation, the monochrome version when names are the priority, and the blank outline for labeling or an original data layer. None of the pastel colors carries a demographic, political, elevation, or economic meaning. Any project that adds such information should include a source, date, category definition, and legend.
Why a North Carolina State Map Is Helpful
The county pattern changes noticeably across the state. In the west, Cherokee, Graham, Swain, Macon, Jackson, Haywood, Madison, Buncombe, Yancey, Mitchell, Avery, and Watauga fit into a narrow and irregular mountain-side outline. The map does not show relief, but the shapes and compact labels still provide a useful administrative reference for that part of North Carolina.
Farther east, wider central counties such as Randolph, Chatham, Wake, Johnston, and Sampson contrast with the coastal divisions around Albemarle and Pamlico sounds. Dare County follows a long barrier-island form, while Currituck, Camden, Pasquotank, Perquimans, Chowan, Tyrrell, Hyde, Beaufort, Pamlico, and Carteret meet complicated water edges. A North Carolina State Map therefore explains county adjacency more clearly than a simple alphabetical list.
The surrounding labels also clarify orientation. Virginia runs along the north, Tennessee borders much of the west, Georgia meets a short southwestern segment, and South Carolina follows the south. The Atlantic Ocean lies to the east. Because the artwork stops at broad geographic context, a larger regional or road map is still necessary for routes, distances, municipalities, and travel planning.
Color County Map for Regional Comparison
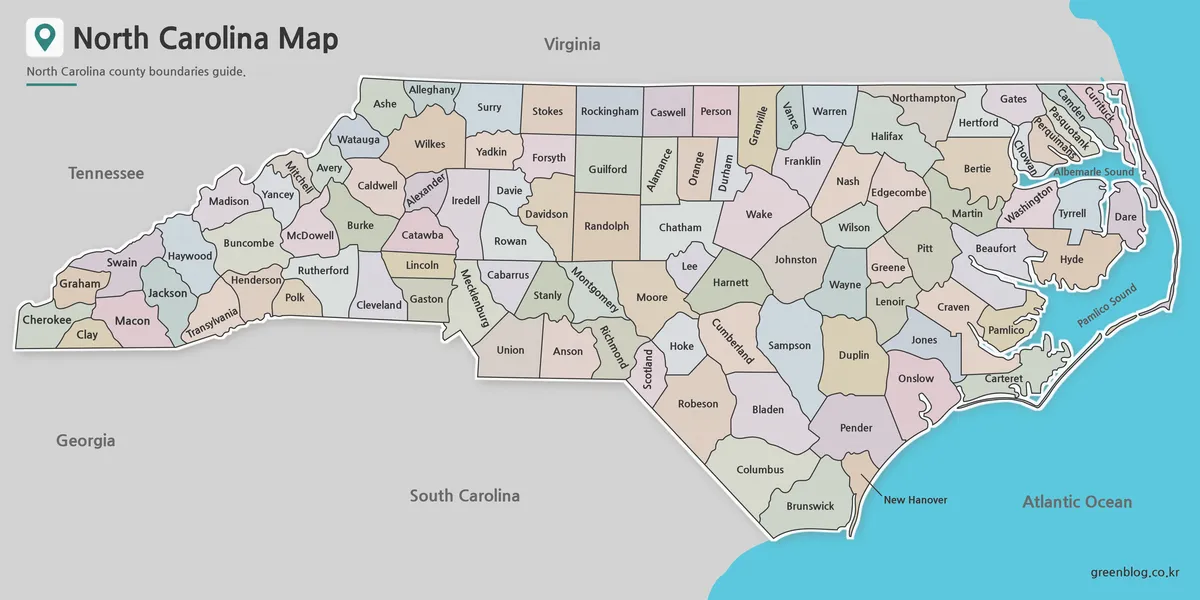
The pastel fills make adjoining counties easier to separate without overpowering the printed names. This is especially helpful in the western cluster, where small areas and rotated labels sit close together, and in the northeast, where narrow county and water boundaries share limited space. Blue water distinguishes the Atlantic and the two named sounds from the administrative polygons.
The color North Carolina State Map is the best introductory visual for a classroom screen or county-comparison slide. A reader can follow the northern border from Alleghany to Currituck, trace the southern edge from Cherokee toward Brunswick, or compare inland Wake and Johnston with coastal Dare and Hyde. The map contains no city symbols, so county location should not be presented as a direct map of Charlotte, Raleigh, or other urban areas.
Use the colors only as separators. If a project groups counties by a new subject, apply a deliberate scheme and give it a legend rather than leaving the original pastels unexplained. For web use, retain enough display width for labels such as Perquimans, Pasquotank, Northampton, Mecklenburg, Montgomery, and Transylvania to remain distinguishable.
Clean Labeled Map for Printing
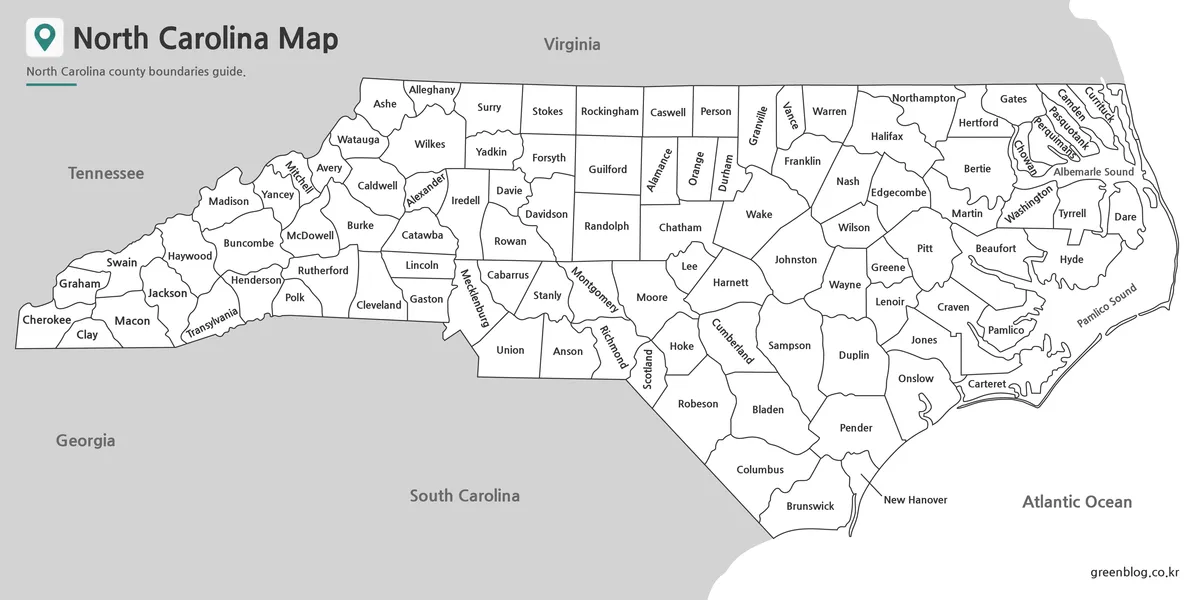
Removing the pastel fills gives county names and boundary lines visual priority. The county field itself remains readable and includes the same surrounding labels as the color map, making it suitable for a reference sheet or worksheet answer key. Neutral interiors also leave room for a few handwritten symbols or notes without competing with background color.
The supplied monochrome North Carolina State Map preview has one visible header limitation: the Virginia label overlaps the top title area, which reads as a crowded “North CarolinVirginia” rather than a clean standalone heading. County names and boundaries below remain intact. For a polished presentation, use the color edition, crop or rebuild the header area, or place an independent title above the image instead of presenting the original top banner unchanged.
Print at the intended landscape ratio and inspect the eastern counties before producing a full set of handouts. Reducing the 1200×600 preview too aggressively can affect small, rotated names first. A test print is also useful when a printer adds wide margins or automatically enlarges and crops an image to fill the page.
Blank Outline Version for Editing
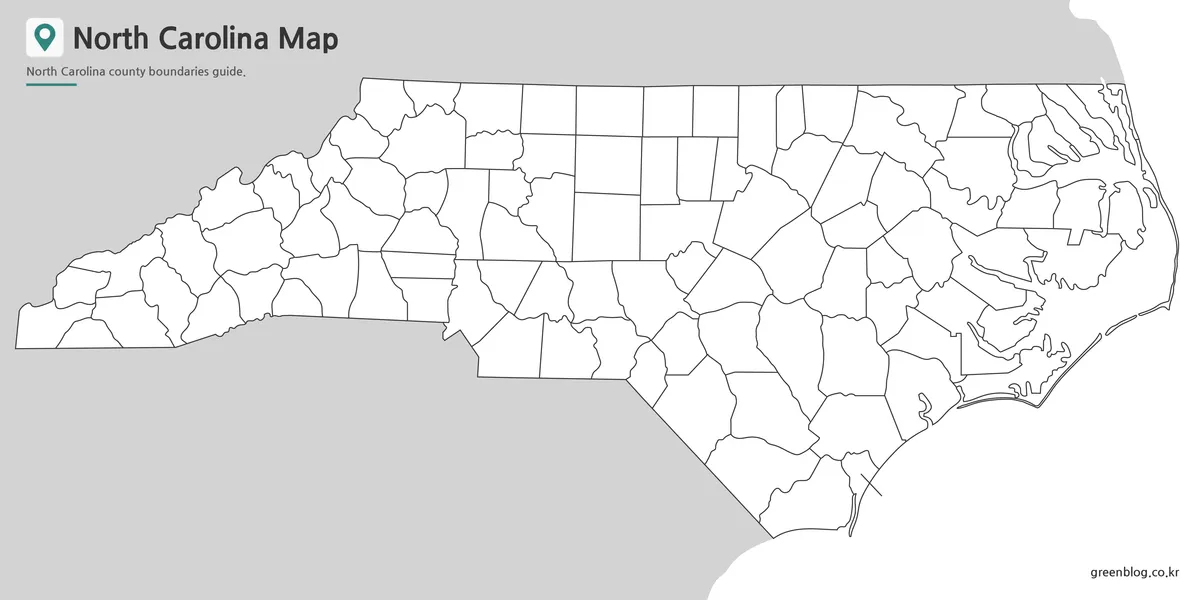
The blank outline removes county, state, ocean, and sound names while retaining the internal divisions and detailed coast. It can serve as a 100-county labeling exercise, a coloring sheet, or a base for a carefully sourced thematic map. The complex eastern water edges remain visible, which gives students more geographic structure than a simplified rectangular county grid.
A blank North Carolina State Map becomes easier to use when the task is divided by region. Students might first label the western border counties, then the northern row, then the central Piedmont counties, and finally the coastal and sound-side counties. A designer can instead add categories, but should preserve an untouched master and avoid treating this raster image as a vector file with independently editable polygons.
Election results, population values, storm impacts, economic tiers, routes, and tourism areas all change or require outside evidence. If any are added, identify the reference year and authoritative source. The outline only establishes county shapes; it does not verify a current statistic, municipality, highway, terrain feature, or emergency condition.
Designed for Practical Projects
For classroom work, introduce the color map, use the monochrome version as a name reference, and distribute the blank outline for recall. One lesson can compare compact western counties with broad central counties; another can focus on Albemarle Sound, Pamlico Sound, and the barrier-island edge. Keeping the same geometry across all three versions makes answers easier to check.
For presentations, select a version based on the final medium. Color supports quick visual orientation, monochrome fits a restrained report layout, and the blank base allows a custom category system. Keep annotations in a separate layer whenever possible and give added facts their own citation, because the North Carolina State Map itself contains boundaries and labels rather than a complete thematic dataset.
For regional comparisons, the neighboring-state labels and Atlantic setting provide a useful starting frame. They are not a substitute for a full Southeast map, however, because surrounding county boundaries and transportation links are absent. Use the collection for North Carolina’s internal county structure, then pair it with a broader source when the project crosses state lines.
Frequently Asked Questions
Can I print the North Carolina State Map in A3 size?
Yes. All versions were prepared as high-resolution A3 resources for printing.
Does the North Carolina State Map include county boundaries?
Yes. County boundary lines are included in all three versions.
Which version is best for editing?
The outline map is the best choice for custom coloring, annotations, infographic work, and graphic design projects.
Is the labeled map suitable for classroom use?
Yes. The black and white labeled version was designed specifically with educational printing and reference use in mind.
Map File Information
Download the color labeled, black-and-white labeled, and blank county-boundary maps for A3 printing, lessons, reference, or annotation.
- Included Versions: Color county, black-and-white labeled, and blank outline maps
- Printable Size: A3 High Resolution
- File Type: JPG / ZIP
- Intended Use: County reference, worksheets, presentations, and annotation
Related Maps
Additional Resources
- North Carolina County Government Websites – Review the official county list with county seats, areas, formation dates, and government links.
Green Map creates custom-edited map images using open geographic data sources such as geoBoundaries, Natural Earth, OpenStreetMap, and government open data.
These maps are edited visual materials, not raw data files, and are provided for education, documents, presentations, and graphic reference.