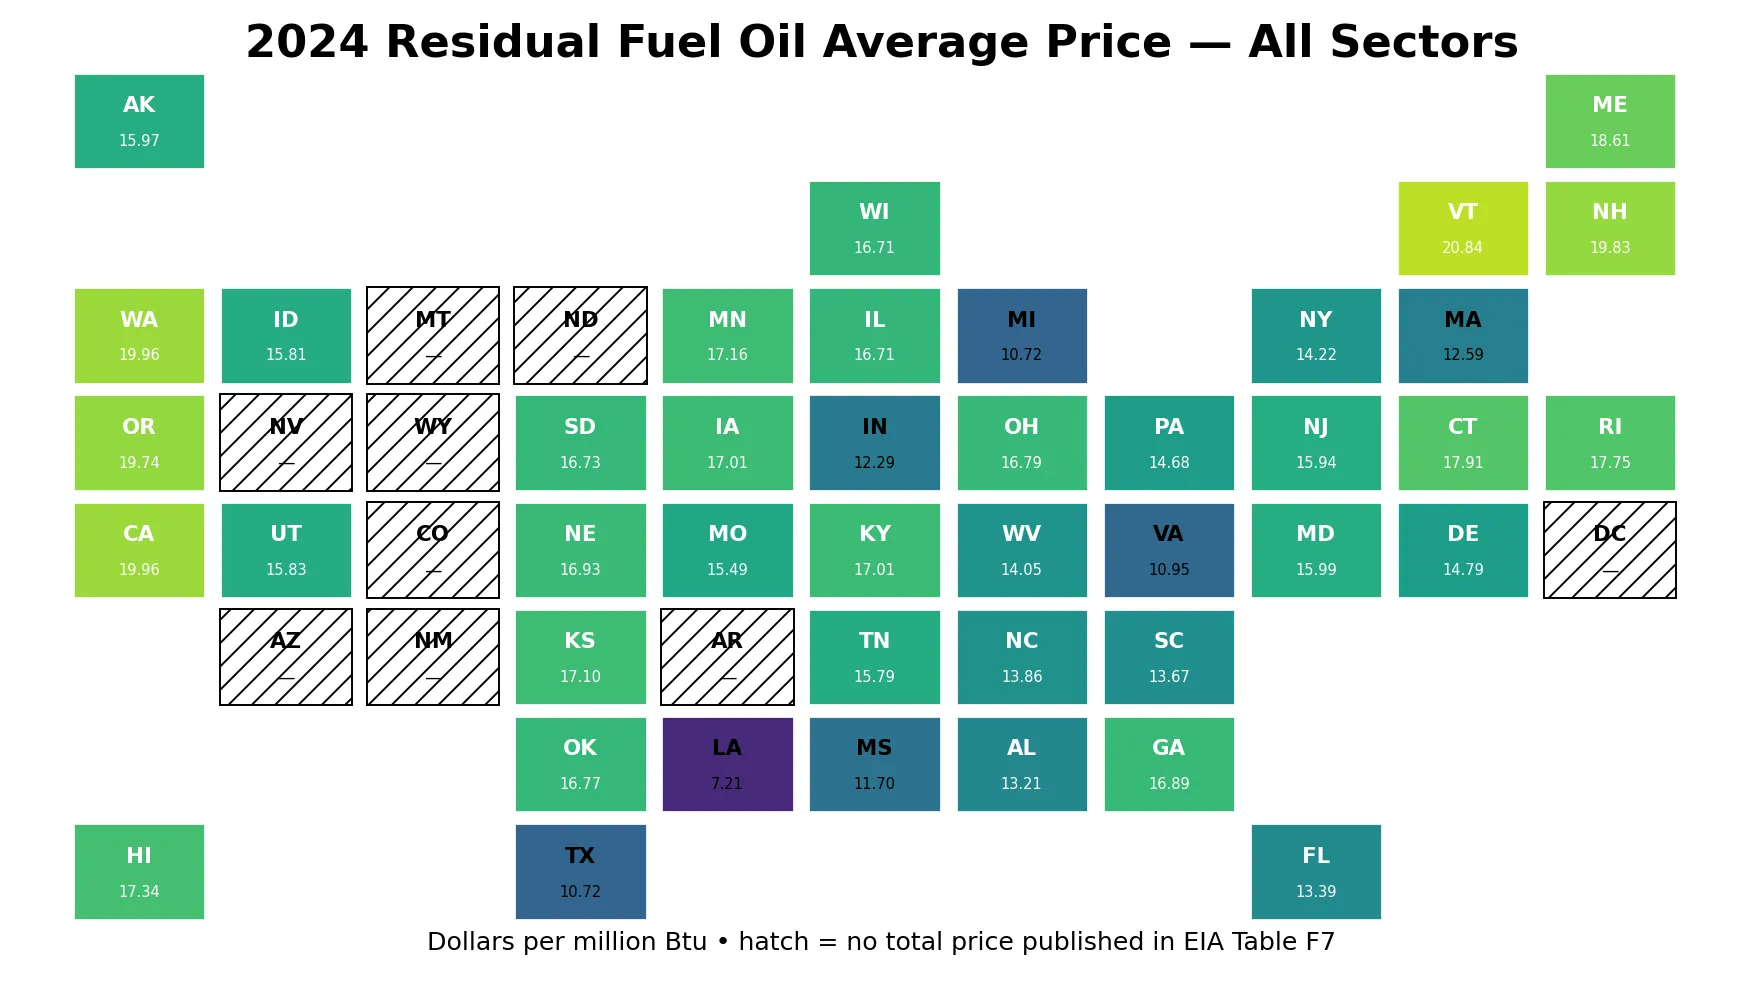
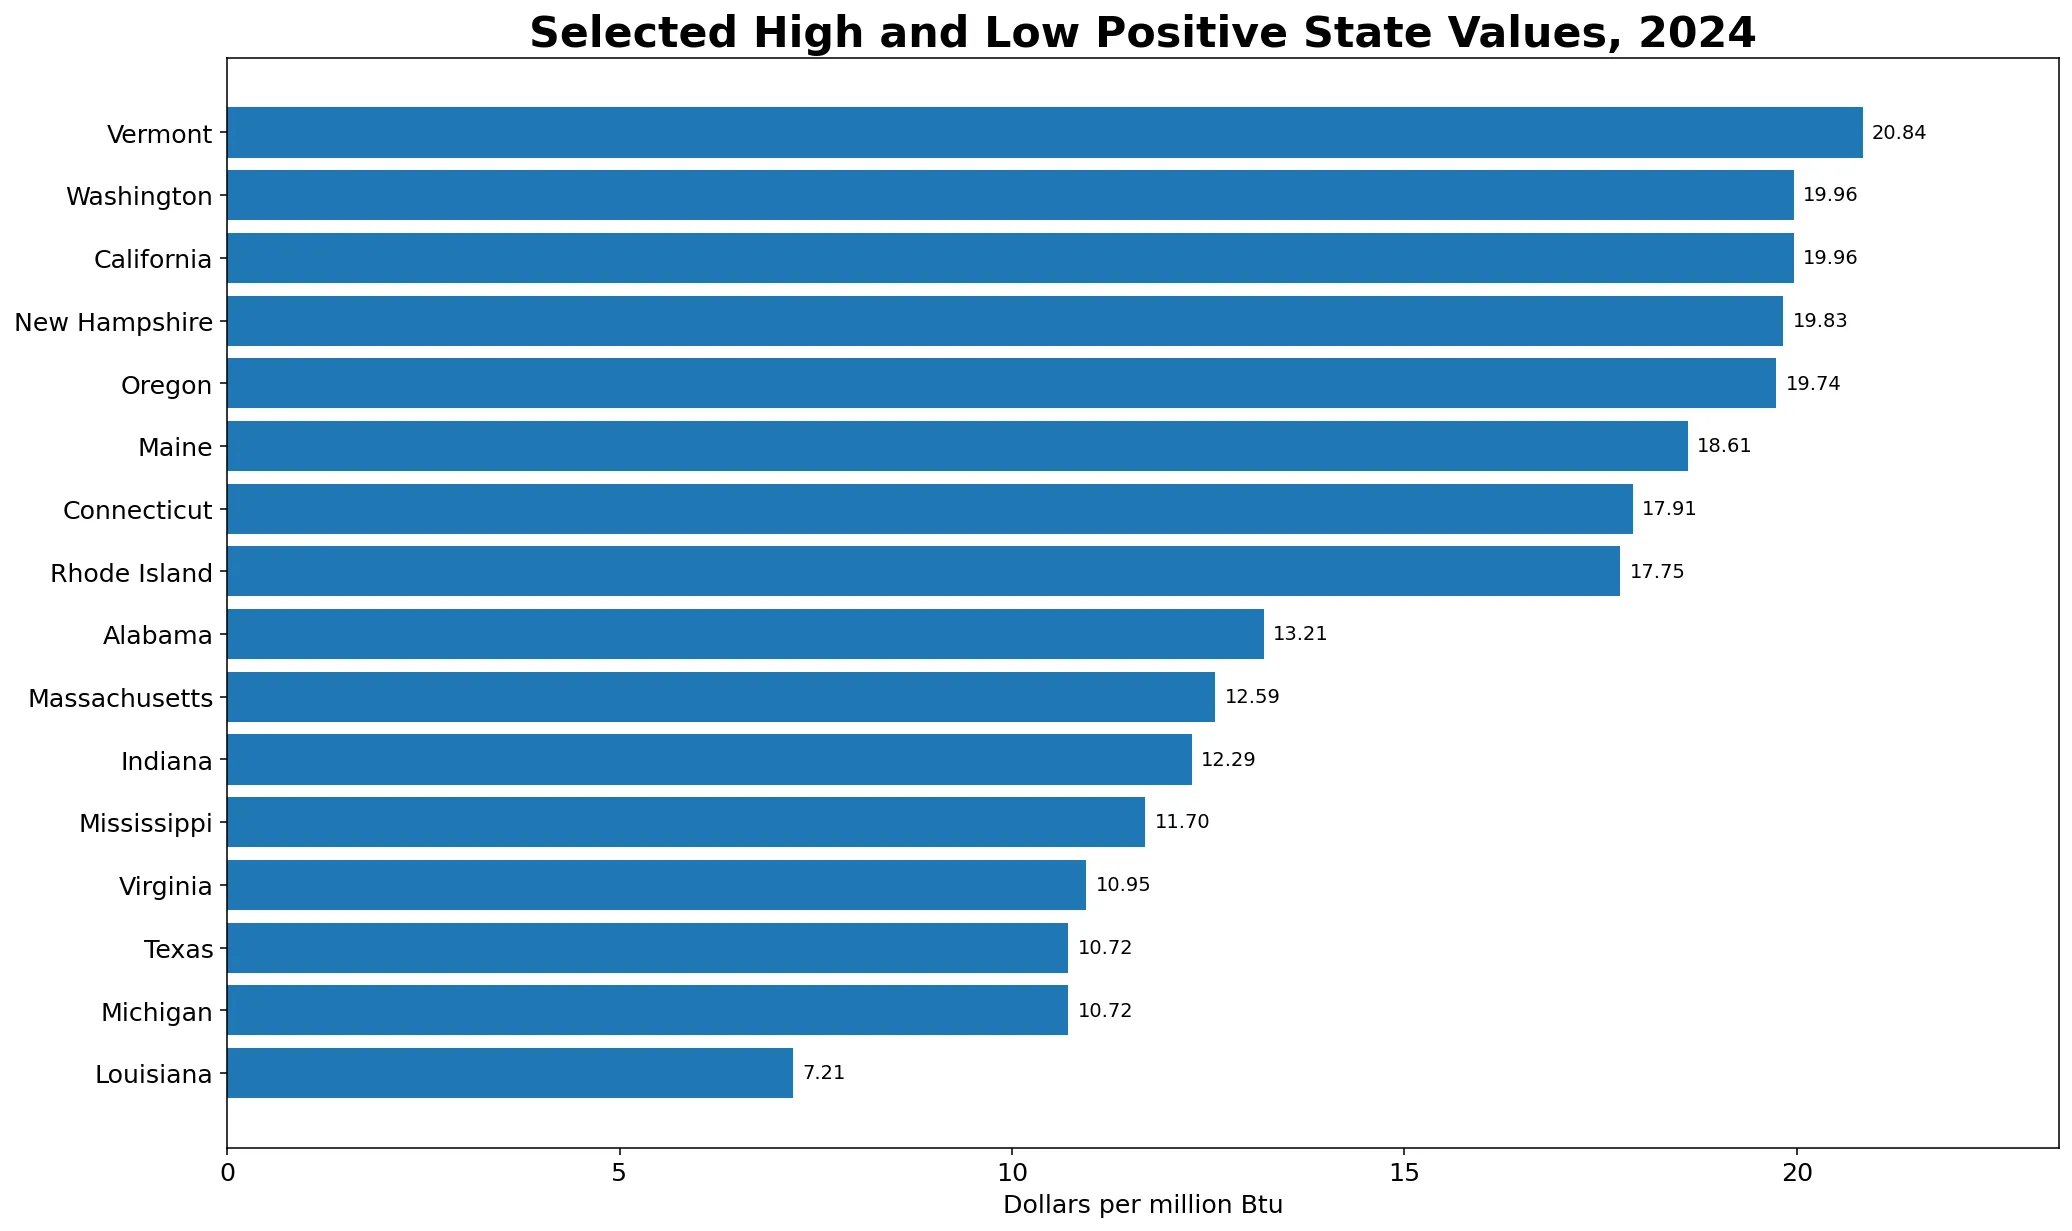
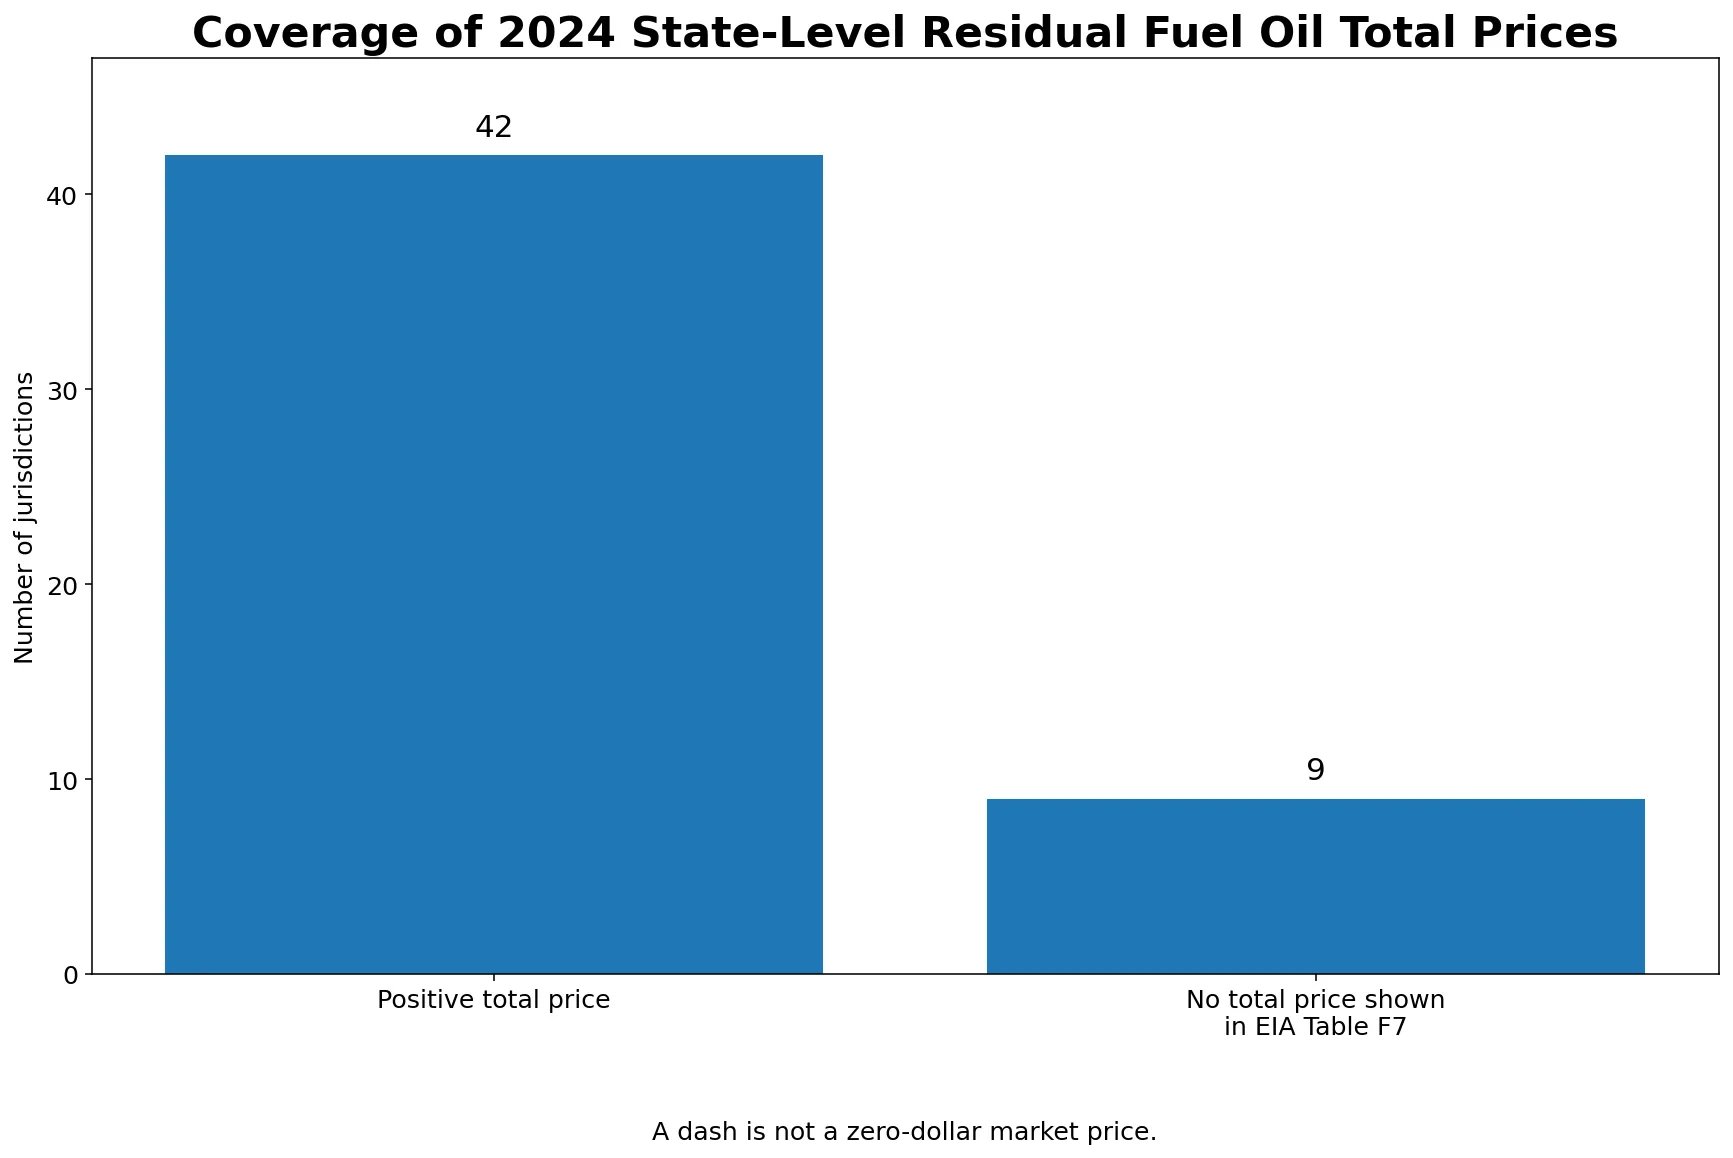
State-level residual fuel oil average prices for all sectors in 2024 are available as positive values for 42 of the 51 U.S. jurisdictions in the EIA State Energy Data System. Vermont has the highest positive total price at $20.84 per million Btu. California and Washington follow at $19.96, while Louisiana has the lowest positive value at $7.21 per million Btu. Nine jurisdictions are shown with a dash in EIA Table F7 rather than a published total price.
Across the 42 positive values, the median is $15.98 per million Btu and the simple mean is $15.63. The simple state average is useful only for describing this distribution. It is not a substitute for an official U.S. residual-fuel-oil price because states differ in consumption and in the mix of sectors using the fuel.
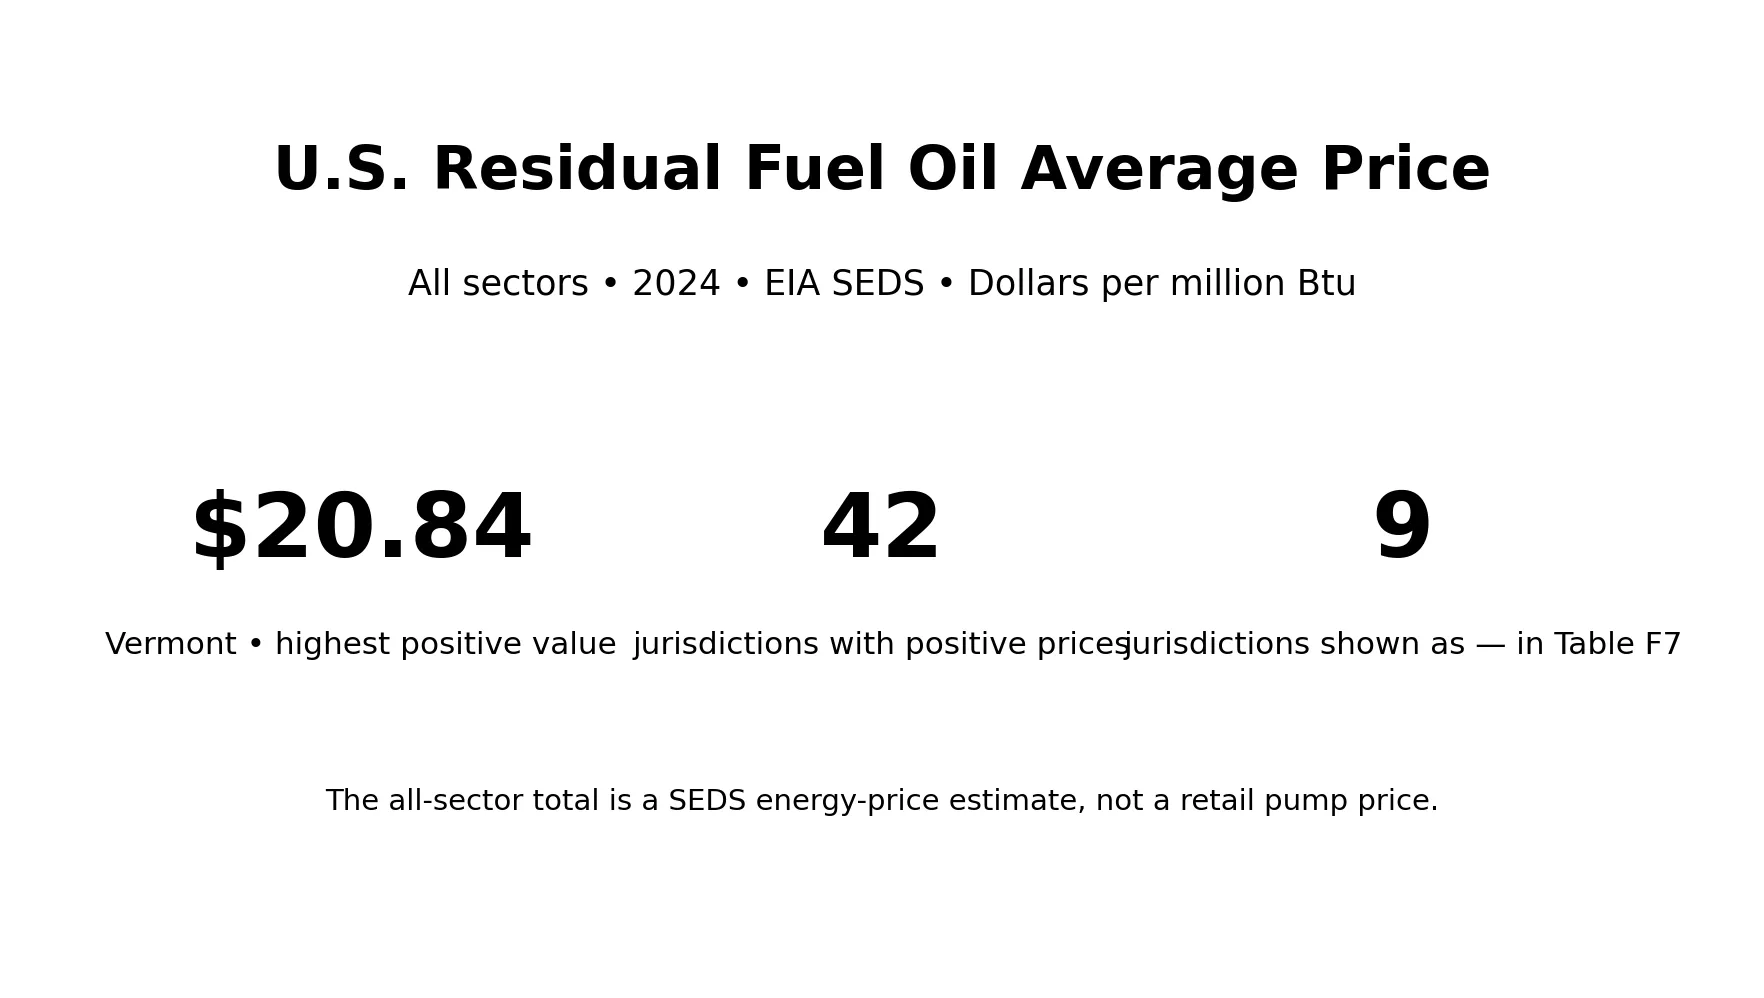
Table of Contents
What the all-sector residual fuel oil price measures
EIA State Energy Data System Table F7 reports residual fuel oil prices for the commercial, industrial, transportation, and electric-power sectors and then provides a total price. This page compares that total column. It therefore answers a different question from a transportation-only, industrial-only, or electric-power price comparison. A state can have very different sector prices because each sector uses residual fuel oil in a different setting and volume.
The unit is dollars per million Btu, an energy-content price. It is not a pump price per gallon, a bunker-fuel quote at a particular port, or the price on an individual industrial contract. SEDS converts energy prices to a common thermal basis so sources and sectors can be compared consistently. Vermont’s $20.84 figure should therefore be read as a 2024 annual state energy-price estimate, not as a single transaction price.
The total column is also not the arithmetic mean of the sector prices. Alabama, for example, has commercial and industrial prices of $16.69 and a transportation price of $10.50 per million Btu in Table F7, yet its total is $13.21. The total reflects the combined energy-use and expenditure structure rather than giving equal weight to every sector.
Vermont recorded the highest positive total price
Vermont leads at $20.84 per million Btu. California and Washington are tied at $19.96, followed by New Hampshire at $19.83, Oregon at $19.74, and Maine at $18.61. Several New England and West Coast states appear near the upper end, but the distribution alone does not establish why those states have higher estimates.
The next group includes Connecticut at $17.91, Rhode Island at $17.75, Hawaii at $17.34, Minnesota at $17.16, and Kansas at $17.10. Iowa and Kentucky each show $17.01, Nebraska $16.93, and Georgia $16.89. Half of the 42 positive jurisdictions are above $15.98 and half are below it.
Louisiana sits well below the rest of the lower group
Louisiana’s $7.21 per million Btu is more than three dollars below the next-lowest values, Michigan and Texas at $10.72. Virginia is $10.95, Mississippi $11.70, Indiana $12.29, and Massachusetts $12.59. Alabama and Florida are higher at $13.21 and $13.39, respectively.
The distance from the highest positive value, $20.84, to the lowest, $7.21, is $13.63 per million Btu. The first quartile is about $13.91 and the third quartile about $17.08. The mean and median are relatively close, but the lower Louisiana value and the cluster near $20 still make it useful to look beyond a single average.
Why nine 0.00 entries should not be ranked as zero-dollar prices
Arizona, Arkansas, Colorado, the District of Columbia, Montana, Nevada, New Mexico, North Dakota, and Wyoming correspond to 0.00 in the state series used for this comparison. In EIA’s public 2024 Table F7, however, the total-price cells for those jurisdictions are displayed as dashes rather than a numeric zero. That presentation matters when building rankings and maps.
Treating those nine cases as real zero-dollar prices would create a misleading bottom tier, reduce the calculated average, and imply that residual fuel oil was available at no cost. They are therefore separated as jurisdictions without a published total price. No neighboring-state average or previous-year value is substituted. The summary statistics use only the 42 positive 2024 total prices.
The post-2021 estimation method matters
SEDS changed its method for state residual fuel oil prices after EIA suspended the EIA-782 survey following data year 2021. For 2022 forward, SEDS estimates commercial, industrial, and transportation state prices with regression models that use historical SEDS state prices and combinations of market indicators. Depending on sector, those inputs include U.S. No. 2 diesel retail prices, residual fuel costs at electric generating plants, crude-oil spot prices, and U.S. Gulf Coast ultra-low-sulfur diesel spot prices.
The electric-power sector follows its own price sources and procedures, so the all-sector total combines sectors with different underlying estimation paths and consumption patterns. A one-factor explanation such as taxes, refinery distance, port access, or local fuel policy is therefore not enough to explain every state difference. Those factors can matter in real markets, but this single SEDS series does not isolate their individual effects.
EIA’s SEDS data and methodology changes page documents the shift in residual-fuel-oil price estimation for 2022 forward. The 2024 Table F7 shows the commercial, industrial, transportation, electric-power, and total price columns together with expenditure estimates.
Complete table for all 51 jurisdictions
The table lists the positive 2024 total prices from highest to lowest and then separates the jurisdictions shown with a dash in EIA Table F7. A dash is not interpreted as a real market price of zero dollars.
| Rank | State or jurisdiction | Code | Year | Total price ($/MMBtu) |
|---|---|---|---|---|
| 1 | Vermont | VT | 2024 | 20.84 |
| 2 | California | CA | 2024 | 19.96 |
| 3 | Washington | WA | 2024 | 19.96 |
| 4 | New Hampshire | NH | 2024 | 19.83 |
| 5 | Oregon | OR | 2024 | 19.74 |
| 6 | Maine | ME | 2024 | 18.61 |
| 7 | Connecticut | CT | 2024 | 17.91 |
| 8 | Rhode Island | RI | 2024 | 17.75 |
| 9 | Hawaii | HI | 2024 | 17.34 |
| 10 | Minnesota | MN | 2024 | 17.16 |
| 11 | Kansas | KS | 2024 | 17.10 |
| 12 | Kentucky | KY | 2024 | 17.01 |
| 13 | Iowa | IA | 2024 | 17.01 |
| 14 | Nebraska | NE | 2024 | 16.93 |
| 15 | Georgia | GA | 2024 | 16.89 |
| 16 | Ohio | OH | 2024 | 16.79 |
| 17 | Oklahoma | OK | 2024 | 16.77 |
| 18 | South Dakota | SD | 2024 | 16.73 |
| 19 | Illinois | IL | 2024 | 16.71 |
| 20 | Wisconsin | WI | 2024 | 16.71 |
| 21 | Maryland | MD | 2024 | 15.99 |
| 22 | Alaska | AK | 2024 | 15.97 |
| 23 | New Jersey | NJ | 2024 | 15.94 |
| 24 | Utah | UT | 2024 | 15.83 |
| 25 | Idaho | ID | 2024 | 15.81 |
| 26 | Tennessee | TN | 2024 | 15.79 |
| 27 | Missouri | MO | 2024 | 15.49 |
| 28 | Delaware | DE | 2024 | 14.79 |
| 29 | Pennsylvania | PA | 2024 | 14.68 |
| 30 | New York | NY | 2024 | 14.22 |
| 31 | West Virginia | WV | 2024 | 14.05 |
| 32 | North Carolina | NC | 2024 | 13.86 |
| 33 | South Carolina | SC | 2024 | 13.67 |
| 34 | Florida | FL | 2024 | 13.39 |
| 35 | Alabama | AL | 2024 | 13.21 |
| 36 | Massachusetts | MA | 2024 | 12.59 |
| 37 | Indiana | IN | 2024 | 12.29 |
| 38 | Mississippi | MS | 2024 | 11.70 |
| 39 | Virginia | VA | 2024 | 10.95 |
| 40 | Michigan | MI | 2024 | 10.72 |
| 41 | Texas | TX | 2024 | 10.72 |
| 42 | Louisiana | LA | 2024 | 7.21 |
| — | Arizona | AZ | 2024 | — |
| — | Arkansas | AR | 2024 | — |
| — | Colorado | CO | 2024 | — |
| — | District of Columbia | DC | 2024 | — |
| — | Montana | MT | 2024 | — |
| — | Nevada | NV | 2024 | — |
| — | New Mexico | NM | 2024 | — |
| — | North Dakota | ND | 2024 | — |
| — | Wyoming | WY | 2024 | — |
How to use the ranking without over-interpreting it
A higher price does not mean a state consumes more residual fuel oil. Price, consumption, and expenditure are separate measures. The total price also should not be substituted for a sector-specific market price. Bunker-fuel questions call for transportation-sector data, while power-plant fuel-cost questions call for the electric-power column. The unit is dollars per million Btu, so a comparison with dollars per barrel or gallon requires an appropriate heat-content conversion.
The clearest 2024 findings are the spread between Vermont at $20.84 and Louisiana at $7.21, the cluster of several states near $20, and the nine jurisdictions without a published total price in Table F7. Reading the coverage status together with the ranking prevents the missing-price cases from being mistaken for unusually cheap fuel.
Source: U.S. Energy Information Administration, State Energy Data System, Table F7. SEDS provides state estimates of energy consumption, prices, and expenditures by source and sector.
Frequently Asked Questions
Which state had the highest all-sector residual fuel oil average price in 2024?
Vermont had the highest positive total price at $20.84 per million Btu. California and Washington followed at $19.96.
Do the nine 0.00 entries mean residual fuel oil cost zero dollars there?
No. EIA Table F7 displays a dash rather than a numeric total price for those jurisdictions, so they are not ranked as zero-dollar prices.
What was the median of the positive state values?
The median of the 42 positive total prices was $15.98 per million Btu, while the simple mean was $15.63.
Is the all-sector total an arithmetic average of the sector prices?
No. The EIA total reflects the combined sector energy-use and expenditure structure, so it should not be read as an equal-weight arithmetic average of commercial, industrial, transportation, and electric-power prices.
Related Articles
Green Map creates custom-edited map images using open geographic data sources such as geoBoundaries, Natural Earth, OpenStreetMap, and government open data. These maps are edited visual materials, not raw data files, and are provided for education, documents, presentations, and graphic reference.