Electric power consumption per person varies by orders of magnitude across the 150 economies in the latest World Bank observations. Iceland sits at the top with about 48,998 kWh per person, while the median is about 2,622 kWh. The highest value is roughly 18.7 times the median and more than 3,500 times the lowest observation, Chad at 13.7 kWh per person. The comparison is not a single-year league table, however. Forty-one economies have a 2024 observation, 107 have 2023, Haiti is represented by 2022, and Kosovo by 2014. The safest reading is therefore “latest available value for each economy,” not “2024 ranking.”
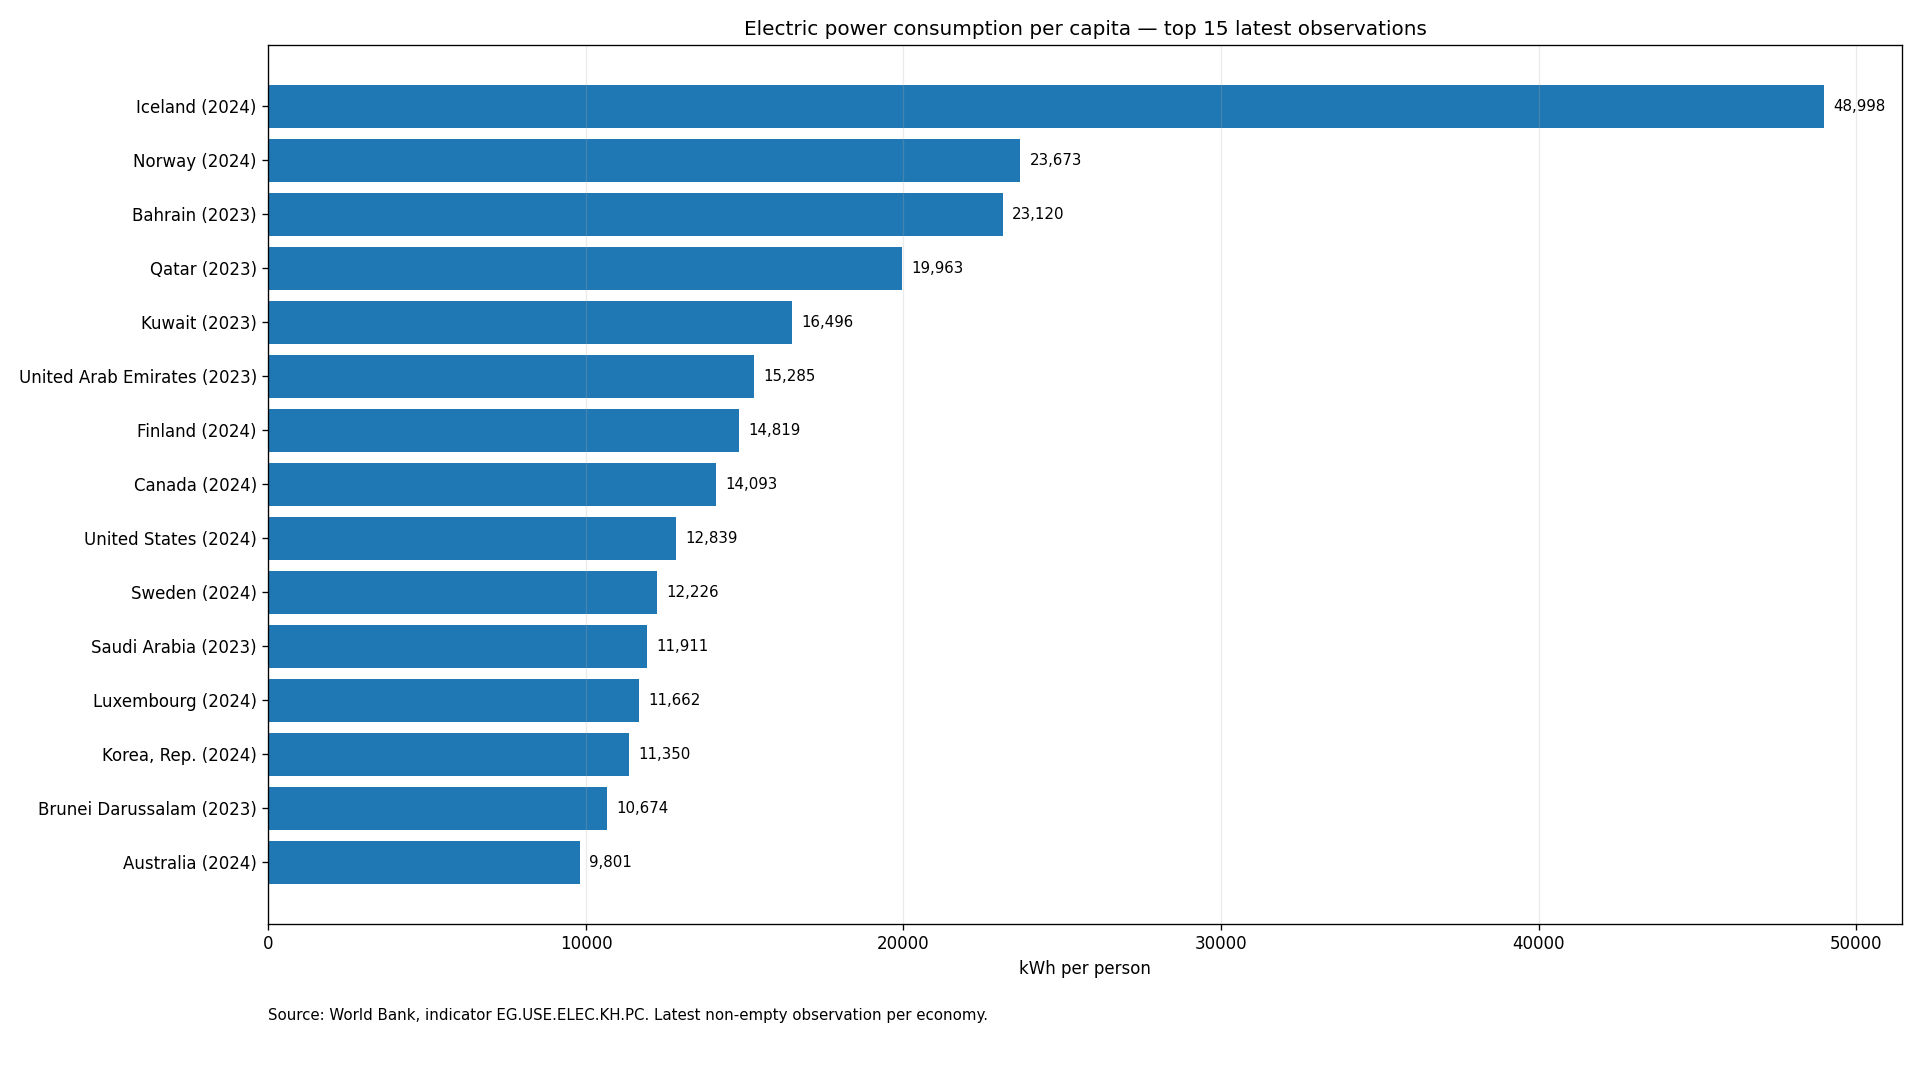
Table of Contents
What electric power consumption per capita actually measures
World Bank indicator EG.USE.ELEC.KH.PC expresses electric power consumption on a per-person basis. The indicator description starts from power-plant and combined heat-and-power production, then accounts for transmission, distribution and transformation losses as well as the electricity and heat sector’s own use. Dividing by population makes economies of very different sizes easier to compare than a table of total national electricity use.
That normalization does not turn the metric into a general score for prosperity, efficiency, sustainability or household behavior. A country can record a high per-capita value for many possible reasons, including an electricity-intensive industrial base, climate-related heating or cooling demand, extensive electrification, or the scale of commercial activity. The indicator does not identify which explanation dominates. It also does not show the fuel mix behind the electricity, so the same consumption level can be supplied by very different generation systems.
Most latest observations are from 2023 or 2024
The time coverage is recent for almost the entire table. Among the 150 economies, 107 latest non-empty observations are dated 2023 and another 41 are dated 2024. Together, those two years account for 148 of the 150 rows. Haiti’s latest non-empty value is from 2022, while Kosovo’s is much older at 2014. That vintage difference matters because a ranking built from “latest values” can mix structural country differences with smaller changes that occurred between observation years.
For broad cross-country context, the mixed latest snapshot is useful because it maximizes coverage without inserting estimated values. For a strict same-year comparison, it would be better to filter the series to a common year and accept fewer economies. In other words, the dataset answers a coverage-first question: what is the most recent reported level available for each economy? It does not claim that every economy was measured at the same date.
Iceland is a clear outlier at the high end
Iceland’s latest value, 48,998 kWh per person in 2024, is more than double Norway’s 23,673 kWh. Bahrain is close to Norway at 23,120 kWh in 2023, followed by Qatar at 19,963, Kuwait at 16,496, and the United Arab Emirates at 15,285. Finland and Canada are next at 14,819 and 14,093 kWh per person, while the United States and Sweden complete the top ten at 12,839 and 12,226.
The top group spans both 2023 and 2024 observations, so the ranking should be read together with the year column. This is especially important near countries with similar values, where a one-year timing difference may matter more than it does for the very large gap between Iceland and the rest of the table. The chart above therefore labels every top-15 economy with its observation year instead of presenting the bars as if they came from one synchronized release.
| Rank | Economy | Observation year | kWh per person |
|---|---|---|---|
| 1 | Iceland | 2024 | 48,998 |
| 2 | Norway | 2024 | 23,673 |
| 3 | Bahrain | 2023 | 23,120 |
| 4 | Qatar | 2023 | 19,963 |
| 5 | Kuwait | 2023 | 16,496 |
| 6 | United Arab Emirates | 2023 | 15,285 |
| 7 | Finland | 2024 | 14,819 |
| 8 | Canada | 2024 | 14,093 |
| 9 | United States | 2024 | 12,839 |
| 10 | Sweden | 2024 | 12,226 |
| 11 | Saudi Arabia | 2023 | 11,911 |
| 12 | Luxembourg | 2024 | 11,662 |
| 13 | Korea, Rep. | 2024 | 11,350 |
| 14 | Brunei Darussalam | 2023 | 10,674 |
| 15 | Australia | 2024 | 9,801 |
The median is 2,622 kWh, far below the mean
Across all 150 latest observations, the median is 2,622 kWh per person and the arithmetic mean is 4,213. The mean being substantially higher than the median shows how strongly the upper tail pulls the average upward. The first quartile is 863 kWh and the third quartile is 5,256, so half of the economies fall between roughly 863 and 5,256 kWh per person. The 90th percentile is about 9,756 kWh.
Only 14 economies reach at least 10,000 kWh per person, while 45 are at or above 5,000. At the other end, 43 economies are below 1,000 kWh per person, 26 are below 500, and 8 are below 100. The broad middle is still wide: 62 economies lie between 1,000 and 5,000 kWh per person. These counts convey the spread more clearly than a single global average.
The lowest observations are below 100 kWh per person
Chad records the smallest latest value in the table at 13.7 kWh per person. South Sudan is next at 47.9, followed by Niger at 67.7. Haiti is at 76.2, Rwanda at 76.7, Madagascar at 80.1, Yemen at 89.7, and Uganda at 95.3. Ethiopia and Benin complete the bottom ten at about 112.6 and 114.7 kWh per person. Eight economies are therefore below the 100 kWh threshold in this latest-value snapshot.
A low number is descriptive, not a diagnosis. This indicator alone cannot tell whether the limiting factor is generation capacity, grid access, affordability, reliability, economic structure, household demand or another constraint. It also cannot tell how consumption is distributed within a country. Haiti additionally uses a 2022 observation, so it should not be treated as perfectly contemporaneous with the 2023 entries around it.
| Low-value rank | Economy | Observation year | kWh per person |
|---|---|---|---|
| 1 | Chad | 2023 | 13.7 |
| 2 | South Sudan | 2023 | 47.9 |
| 3 | Niger | 2023 | 67.7 |
| 4 | Haiti | 2022 | 76.2 |
| 5 | Rwanda | 2023 | 76.7 |
| 6 | Madagascar | 2023 | 80.1 |
| 7 | Yemen, Rep. | 2023 | 89.7 |
| 8 | Uganda | 2023 | 95.3 |
| 9 | Ethiopia | 2023 | 112.6 |
| 10 | Benin | 2023 | 114.7 |
The range is so wide that averages can be misleading
Iceland’s value is about 18.7 times the median and roughly 3,572 times Chad’s value. When a distribution spans more than three orders of magnitude, a linear chart can compress most countries into a narrow band while a handful of high values dominate the scale. The arithmetic mean of 4,213 kWh can therefore sound more “typical” than it really is; half of the economies are actually at or below 2,622 kWh.
A logarithmic scale or quantile classes can make a world map easier to read, but those design choices change how visual distance is perceived. Any map should label the classification method clearly. The table in this article keeps the underlying kWh-per-person values untransformed so the numerical magnitude remains visible even when the spread is extreme.
Per-capita consumption answers a different question from total electricity use
Large-population economies can have very high national electricity consumption without ranking near the top on a per-person basis. The reverse can also occur: a smaller economy may rank highly per person even though its total electricity use is much smaller than that of a large country. This metric is therefore useful when the research question is about intensity relative to population, not when the goal is to identify the world’s largest electricity markets by total terawatt-hours.
The indicator should also not be confused with residential electricity use. National per-capita consumption includes electricity used across the economy, not just in homes. Industrial, commercial, public and other uses influence the national figure. Estimating how much electricity a typical household consumes requires a residential series, household counts and often climate or dwelling information rather than this all-economy indicator alone.
What to check before comparing two countries
Start with the observation year. A 2024 figure and a 2023 figure can still be useful in a broad latest-value comparison, but they are not perfectly synchronized. Next, confirm that the question really calls for a per-capita metric rather than total consumption. Then separate consumption from generation mix: this World Bank series does not say whether the electricity came from fossil fuels, nuclear power, hydro, wind, solar or another source. Finally, keep electricity access separate from electricity consumption. Access rates and per-person kWh can move together, but they measure different things.
These distinctions keep the ranking informative without overclaiming. High consumption is not automatically evidence of waste, and low consumption is not explained by one factor. The series is best used as a starting point for asking why national electricity-use intensity differs, after which sectoral demand, energy prices, access, climate, industrial structure and generation composition can be added as separate evidence.
Source and calculation notes
The source is the World Bank Electric power consumption (kWh per capita) indicator, code EG.USE.ELEC.KH.PC. This comparison uses one latest non-empty observation for each of 150 real economies. Although the data package is associated with a 2024 reference year, the row-level years range from 2014 to 2024 because availability differs by economy; 148 of the 150 rows are from 2023 or 2024.
Rankings are calculated by sorting those latest values from highest to lowest. The median, quartiles and threshold counts are calculated directly from the 150 observations. The per-capita values are not summed into a “world total,” because adding country-level ratios does not produce a meaningful global per-capita figure. A global per-person value would require population weighting based on total electricity use and population, not a simple sum or unweighted average of national ratios.
Frequently Asked Questions
Is electric power consumption per capita the same as household electricity use?
No. It covers electricity consumption across the national economy and divides that amount by population, so industrial, commercial, public and other uses are included.
Why do the observation years differ by economy?
The comparison uses each economy’s latest non-empty World Bank observation. Most rows are from 2023 or 2024, but Haiti is 2022 and Kosovo is 2014.
Can this indicator show which countries are most energy-efficient or green?
No. It measures consumption per person, not efficiency or generation mix. Those questions require separate data on technology, fuels, output, climate, industry and other factors.
Related Articles
Green Map creates custom-edited map images using open geographic data sources such as geoBoundaries, Natural Earth, OpenStreetMap, and government open data. These maps are edited visual materials, not raw data files, and are provided for education, documents, presentations, and graphic reference.