The poverty gap at $4.20 a day (2021 PPP) measures the average shortfall of income or consumption from the poverty line, counting people above the line as having zero shortfall. The World Bank SI.POV.LMIC.GP series contains 171 latest non-empty observations, but the observation years span 1992–2025. The map therefore shows latest-available geography, while the 2024 and 2023 groups are analyzed separately for same-year comparisons.
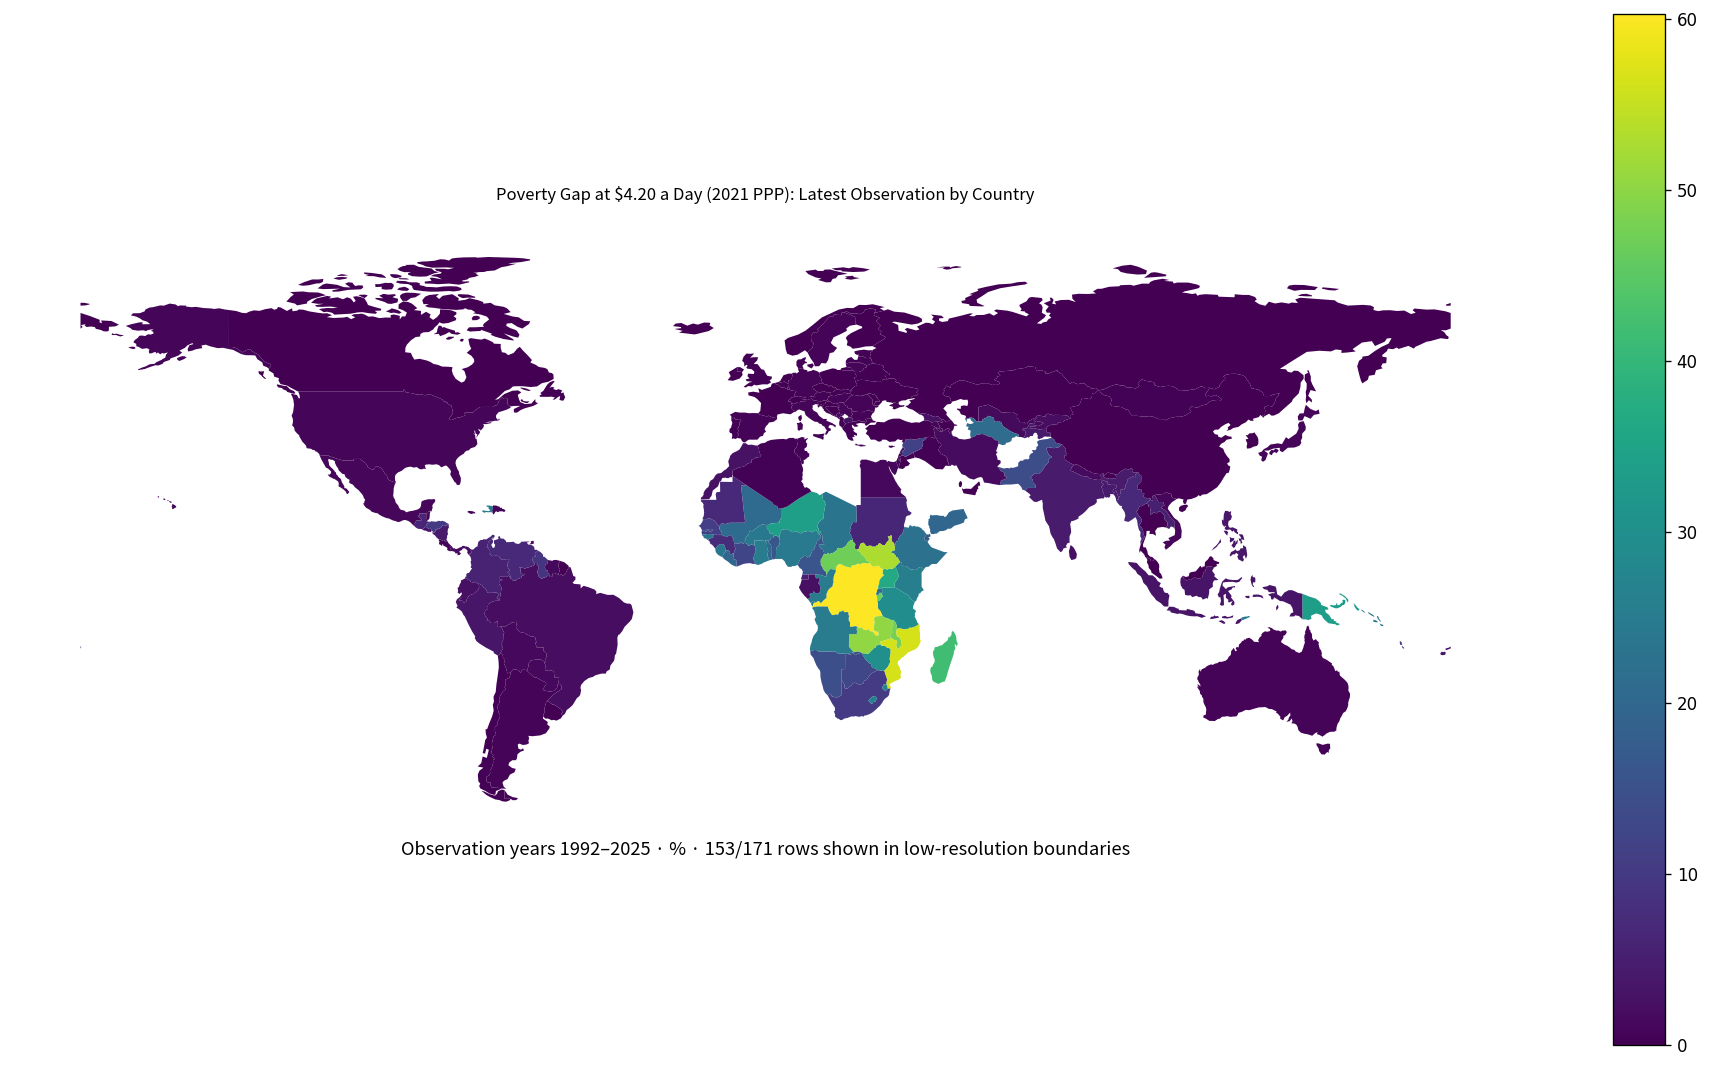
Table of Contents
The poverty gap is different from the poverty headcount rate
A poverty headcount asks what share of people live below a poverty line. The poverty gap adds the depth of poverty by measuring how far income or consumption falls short of the line. Two economies can have the same headcount rate and different poverty gaps if poor households are farther below the line in one of them.
A poverty gap of 10% does not mean 10% of the population is poor, and it does not simply mean the average poor person is exactly 10% below the line. Nonpoor people are assigned a zero shortfall and the gap is averaged across the population, so incidence and depth are combined in one measure.
$4.20 in 2021 PPP is not $4.20 converted at today’s exchange rate
The poverty line is expressed in 2021 purchasing power parity. PPP adjusts for cross-country price-level differences so that the threshold reflects comparable purchasing power. It is not constructed by converting local income into U.S. dollars at the current market exchange rate.
The year 2021 refers to the PPP price benchmark, not necessarily the survey year. A 2024 observation can still use the $4.20 2021-PPP poverty line. Survey-year income or consumption distributions are evaluated against the common PPP-based threshold.
The 171 latest observations have very different reference years
Only 4 latest observations are dated 2025, while 21 are from 2024, 37 from 2023, 22 from 2022, and 23 from 2021. Older final observations extend back into the 1990s and 2000s.
| Observation year | Economies/territories | Share of 171 |
|---|---|---|
| 2025 | 4 | 2.3% |
| 2024 | 21 | 12.3% |
| 2023 | 37 | 21.6% |
| 2022 | 22 | 12.9% |
| 2021 | 23 | 13.5% |
| 2020 | 8 | 4.7% |
| 2019 | 11 | 6.4% |
| 2018 | 8 | 4.7% |
| 2017 | 8 | 4.7% |
| 2016 | 5 | 2.9% |
| 2015 | 4 | 2.3% |
| 2014 | 4 | 2.3% |
| 2013 | 3 | 1.8% |
| 2012 | 3 | 1.8% |
| 2011 | 2 | 1.2% |
| 2010 | 2 | 1.2% |
| 2009 | 1 | 0.6% |
| 2006 | 1 | 0.6% |
| 2005 | 1 | 0.6% |
| 1998 | 2 | 1.2% |
| 1992 | 1 | 0.6% |
The mixed-year collection has a mean of 8.52% and a median of 1.8%, ranging from 0.0% to 60.3%. Those statistics combine very different survey periods and should not be presented as a current global poverty-gap average or ranking.
The 2025 group has only four observations
The four 2025 observations are Indonesia at 3.2%, Ecuador at 2.5%, Uzbekistan at 1.5%, and Costa Rica at 0.5%. They are recent but far too few to represent a broad cross-country distribution.
Using only the newest calendar year would therefore create a misleadingly narrow comparison. The four values are retained, but the statistical discussion uses the larger 2024 and 2023 groups separately.
The 2024 mean is 2.96% and the median is 2.0%
The 2024 subset contains 21 economies. Its mean is 2.96% and its median 2.0%. The first quartile is 0.9% and the third quartile 3.7%. 4 observations are at least 5%, and 2 are at least 10%.
Pakistan is highest at 13.9%, followed by Honduras at 10.1%, Colombia at 5.7%, Lao PDR at 5.2%, and Tajikistan at 4.1%. Comoros records 3.7%, Peru 3.3%, Georgia 2.7%, Kyrgyz Republic 2.1%, and Brazil and Panama 2.0%.
| 2024 rank | Economy/territory | Poverty gap at $4.20 |
|---|---|---|
| 1 | Pakistan | 13.9% |
| 2 | Honduras | 10.1% |
| 3 | Colombia | 5.7% |
| 4 | Lao PDR | 5.2% |
| 5 | Tajikistan | 4.1% |
| 6 | Comoros | 3.7% |
| 7 | Peru | 3.3% |
| 8 | Georgia | 2.7% |
| 9 | Kyrgyz Republic | 2.1% |
| 10 | Brazil | 2.0% |
| 11 | Panama | 2.0% |
| 12 | Bolivia | 1.4% |
| 13 | Paraguay | 1.3% |
| 14 | Mexico | 1.1% |
| 15 | Armenia | 0.9% |
At the low end, Thailand records 0.0%, Uruguay 0.1%, Chile 0.3%, the Dominican Republic 0.6%, and Argentina 0.7%. A published zero is retained as zero rather than being treated as missing.
| Low-order position in 2024 | Economy/territory | Poverty gap at $4.20 |
|---|---|---|
| 1 | Thailand | 0.0% |
| 2 | Uruguay | 0.1% |
| 3 | Chile | 0.3% |
| 4 | Dominican Republic | 0.6% |
| 5 | Argentina | 0.7% |
| 6 | Armenia | 0.9% |
| 7 | United States | 0.9% |
| 8 | Mexico | 1.1% |
| 9 | Paraguay | 1.3% |
| 10 | Bolivia | 1.4% |
| 11 | Brazil | 2.0% |
| 12 | Panama | 2.0% |
| 13 | Kyrgyz Republic | 2.1% |
| 14 | Georgia | 2.7% |
| 15 | Peru | 3.3% |
The 2023 group is broader but strongly influenced by Rwanda
The 2023 subset contains 37 economies. Its mean is 1.31% and median 0.3%, with a first quartile of 0.1% and third quartile of 0.8%. Rwanda is highest at 21.9%, followed by Guatemala at 6.3%, the Philippines at 3.7%, and El Salvador at 3.1%.
| 2023 high-order position | Economy/territory | Poverty gap at $4.20 |
|---|---|---|
| 1 | Rwanda | 21.9% |
| 2 | Guatemala | 6.3% |
| 3 | Philippines | 3.7% |
| 4 | El Salvador | 3.1% |
| 5 | Iran, Islamic Rep. | 1.7% |
| 6 | West Bank and Gaza | 1.4% |
| 7 | Kiribati | 0.9% |
| 8 | Italy | 0.8% |
| 9 | Lithuania | 0.8% |
| 10 | Serbia | 0.8% |
| 11 | Bulgaria | 0.7% |
| 12 | Spain | 0.6% |
| 13 | Sweden | 0.6% |
| 14 | Romania | 0.5% |
| 15 | Austria | 0.4% |
Cyprus, Czechia, Luxembourg, and Slovenia record 0.0% in 2023. Belgium, France, Ireland, Moldova, the Russian Federation, and Turkiye are at 0.1%. The concentration of many values below 1% helps explain why the median is far below the mean.
| 2023 low-order position | Economy/territory | Poverty gap at $4.20 |
|---|---|---|
| 1 | Cyprus | 0.0% |
| 2 | Czechia | 0.0% |
| 3 | Luxembourg | 0.0% |
| 4 | Slovenia | 0.0% |
| 5 | Belgium | 0.1% |
| 6 | France | 0.1% |
| 7 | Ireland | 0.1% |
| 8 | Moldova | 0.1% |
| 9 | Russian Federation | 0.1% |
| 10 | Turkiye | 0.1% |
| 11 | Finland | 0.2% |
| 12 | Croatia | 0.2% |
| 13 | Norway | 0.2% |
| 14 | Poland | 0.2% |
| 15 | Denmark | 0.3% |
The highest latest values come from different years
The largest latest observation is Congo, Dem. Rep. at 60.3% in 2020. It is followed by Mozambique at 56.5% in 2022, South Sudan at 52.8% in 2016, Zambia at 50.4% in 2022, Malawi at 47.6% in 2019, Burundi at 46.5% in 2020, Madagascar at 41.9% in 2021, and the Central African Republic at 40.7% in 2021.
| Latest-value order | Economy/territory | Observation year | Poverty gap |
|---|---|---|---|
| 1 | Congo, Dem. Rep. | 2020 | 60.3% |
| 2 | Mozambique | 2022 | 56.5% |
| 3 | South Sudan | 2016 | 52.8% |
| 4 | Zambia | 2022 | 50.4% |
| 5 | Malawi | 2019 | 47.6% |
| 6 | Central African Republic | 2021 | 46.9% |
| 7 | Burundi | 2020 | 46.5% |
| 8 | Madagascar | 2021 | 41.9% |
| 9 | Uganda | 2019 | 36.3% |
| 10 | Niger | 2021 | 33.8% |
| 11 | Papua New Guinea | 2009 | 33.3% |
| 12 | Zimbabwe | 2019 | 30.0% |
| 13 | Tanzania | 2018 | 29.6% |
| 14 | Eswatini | 2016 | 27.5% |
| 15 | Lesotho | 2017 | 26.3% |
This is not a same-year global ranking. South Sudan’s observation is from 2016, Malawi’s from 2019, and several other high values predate the most recent surveys available elsewhere. Current-country comparisons should check whether newer household-survey estimates have become available.
What a high poverty gap means
A high poverty gap means the average population-wide shortfall from the poverty line is large after nonpoor people are assigned zero shortfall. The gap can rise because more people are poor, because poor people are farther below the line, or because both conditions occur together.
The measure is useful for poverty depth, but it does not fully describe inequality among poor people. Two populations can have the same poverty gap with different distributions of deprivation. Squared poverty-gap measures or distributional indicators provide additional information.
Headcount and poverty gap answer complementary questions
The headcount rate is strongest for the question ‘how many people are below the line?’ The poverty gap adds ‘how far below?’ Reading them together separates the incidence and depth of poverty.
If the headcount falls while the poverty gap remains relatively high, the remaining poor population may still be far below the line. If the headcount is high but the gap is comparatively low, many people may be clustered just below the threshold.
A zero does not mean every form of poverty is absent
A reported 0.0% means the measured average shortfall at this particular poverty line is zero at the published precision. It should not be expanded into a claim that poverty of every type is absent. Sampling error, rounding, and alternative poverty lines can produce different pictures.
A higher international poverty line or a national relative-poverty definition can classify a different share of the population as poor. Poverty measures are conditional on the threshold and methodology used.
The map is useful for spatial patterns, but the year must remain visible
The latest-value map represents 153 of the 171 source rows in the low-resolution world boundary file. 18 small islands and territories are not drawn by that boundary dataset, but every source row remains in the complete table.
The map is valuable for seeing spatial concentration, yet two similarly shaded countries may come from different survey years. The title, caption, and table therefore keep the mixed-year nature of the data explicit.
Complete list of the 171 latest observations
The table below lists the latest non-empty observation for each economy and territory in alphabetical order. The observation year should be read together with the value, especially for countries whose latest survey is old.
| Economy/territory | Observation year | Poverty gap at $4.20 |
|---|---|---|
| Albania | 2020 | 0.3% |
| Algeria | 2011 | 0.4% |
| Angola | 2018 | 24.9% |
| Argentina | 2024 | 0.7% |
| Armenia | 2024 | 0.9% |
| Australia | 2020 | 0.7% |
| Austria | 2023 | 0.4% |
| Azerbaijan | 2005 | 0.0% |
| Bangladesh | 2022 | 4.3% |
| Barbados | 2016 | 1.3% |
| Belarus | 2020 | 0.0% |
| Belgium | 2023 | 0.1% |
| Belize | 2018 | 0.8% |
| Benin | 2021 | 16.2% |
| Bhutan | 2022 | 0.0% |
| Bolivia | 2024 | 1.4% |
| Bosnia and Herzegovina | 2021 | 0.2% |
| Botswana | 2015 | 12.9% |
| Brazil | 2024 | 2.0% |
| Bulgaria | 2023 | 0.7% |
| Burkina Faso | 2021 | 24.4% |
| Burundi | 2020 | 46.5% |
| Cabo Verde | 2015 | 9.2% |
| Cameroon | 2021 | 15.6% |
| Canada | 2022 | 0.2% |
| Central African Republic | 2021 | 46.9% |
| Chad | 2022 | 23.2% |
| Chile | 2024 | 0.3% |
| China | 2022 | 0.0% |
| Colombia | 2024 | 5.7% |
| Comoros | 2024 | 3.7% |
| Congo, Dem. Rep. | 2020 | 60.3% |
| Congo, Rep. | 2011 | 25.0% |
| Costa Rica | 2025 | 0.5% |
| Cote d’Ivoire | 2021 | 12.3% |
| Croatia | 2023 | 0.2% |
| Cyprus | 2023 | 0.0% |
| Czechia | 2023 | 0.0% |
| Denmark | 2023 | 0.3% |
| Djibouti | 2017 | 16.5% |
| Dominican Republic | 2024 | 0.6% |
| Ecuador | 2025 | 2.5% |
| Egypt, Arab Rep. | 2021 | 1.2% |
| El Salvador | 2023 | 3.1% |
| Equatorial Guinea | 2022 | 5.6% |
| Estonia | 2023 | 0.3% |
| Eswatini | 2016 | 27.5% |
| Ethiopia | 2021 | 22.5% |
| Fiji | 2019 | 3.3% |
| Finland | 2023 | 0.2% |
| France | 2023 | 0.1% |
| Gabon | 2017 | 2.4% |
| Gambia, The | 2020 | 13.1% |
| Georgia | 2024 | 2.7% |
| Germany | 2022 | 0.6% |
| Ghana | 2016 | 25.0% |
| Greece | 2023 | 0.4% |
| Grenada | 2018 | 0.5% |
| Guatemala | 2023 | 6.3% |
| Guinea | 2018 | 7.4% |
| Guinea-Bissau | 2021 | 23.1% |
| Guyana | 1998 | 9.2% |
| Haiti | 2012 | 24.9% |
| Honduras | 2024 | 10.1% |
| Hungary | 2017 | 0.7% |
| Iceland | 2019 | 0.1% |
| India | 2022 | 4.4% |
| Indonesia | 2025 | 3.2% |
| Iran, Islamic Rep. | 2023 | 1.7% |
| Iraq | 2023 | 0.4% |
| Ireland | 2023 | 0.1% |
| Israel | 2022 | 0.3% |
| Italy | 2023 | 0.8% |
| Jamaica | 2021 | 1.1% |
| Japan | 2020 | 0.8% |
| Jordan | 2010 | 0.1% |
| Kazakhstan | 2021 | 0.0% |
| Kenya | 2022 | 25.9% |
| Kiribati | 2023 | 0.9% |
| Korea, Rep. | 2021 | 0.1% |
| Kosovo | 2022 | 7.5% |
| Kyrgyz Republic | 2024 | 2.1% |
| Lao PDR | 2024 | 5.2% |
| Latvia | 2023 | 0.4% |
| Lebanon | 2022 | 3.8% |
| Lesotho | 2017 | 26.3% |
| Liberia | 2016 | 19.9% |
| Lithuania | 2023 | 0.8% |
| Luxembourg | 2023 | 0.0% |
| Madagascar | 2021 | 41.9% |
| Malawi | 2019 | 47.6% |
| Malaysia | 2021 | 0.0% |
| Maldives | 2019 | 0.0% |
| Mali | 2021 | 20.8% |
| Malta | 2023 | 0.3% |
| Marshall Islands | 2019 | 1.5% |
| Mauritania | 2019 | 6.8% |
| Mauritius | 2017 | 0.5% |
| Mexico | 2024 | 1.1% |
| Micronesia, Fed. Sts. | 2013 | 16.4% |
| Moldova | 2023 | 0.1% |
| Mongolia | 2022 | 0.4% |
| Montenegro | 2021 | 1.7% |
| Morocco | 2013 | 2.6% |
| Mozambique | 2022 | 56.5% |
| Myanmar | 2017 | 6.8% |
| Namibia | 2015 | 14.4% |
| Naoero | 2012 | 5.4% |
| Nepal | 2022 | 1.8% |
| Netherlands | 2021 | 0.1% |
| Nicaragua | 2014 | 4.4% |
| Niger | 2021 | 33.8% |
| Nigeria | 2022 | 24.6% |
| North Macedonia | 2019 | 2.7% |
| Norway | 2023 | 0.2% |
| Pakistan | 2024 | 13.9% |
| Panama | 2024 | 2.0% |
| Papua New Guinea | 2009 | 33.3% |
| Paraguay | 2024 | 1.3% |
| Peru | 2024 | 3.3% |
| Philippines | 2023 | 3.7% |
| Poland | 2023 | 0.2% |
| Portugal | 2023 | 0.3% |
| Qatar | 2017 | 0.0% |
| Romania | 2023 | 0.5% |
| Russian Federation | 2023 | 0.1% |
| Rwanda | 2023 | 21.9% |
| Samoa | 2013 | 2.7% |
| Sao Tome and Principe | 2017 | 8.3% |
| Senegal | 2021 | 10.9% |
| Serbia | 2023 | 0.8% |
| Seychelles | 2018 | 0.5% |
| Sierra Leone | 2018 | 23.6% |
| Slovak Republic | 2023 | 0.3% |
| Slovenia | 2023 | 0.0% |
| Solomon Islands | 2012 | 24.2% |
| South Africa | 2022 | 10.5% |
| South Sudan | 2016 | 52.8% |
| Spain | 2023 | 0.6% |
| Sri Lanka | 2019 | 2.2% |
| St. Lucia | 2015 | 0.1% |
| Sudan | 2014 | 6.5% |
| Suriname | 2022 | 1.2% |
| Sweden | 2023 | 0.6% |
| Switzerland | 2022 | 0.1% |
| Syrian Arab Republic | 2022 | 11.4% |
| Tajikistan | 2024 | 4.1% |
| Tanzania | 2018 | 29.6% |
| Thailand | 2024 | 0.0% |
| Timor-Leste | 2014 | 25.0% |
| Togo | 2021 | 20.4% |
| Tonga | 2021 | 0.4% |
| Trinidad and Tobago | 1992 | 2.0% |
| Tunisia | 2021 | 0.5% |
| Turkiye | 2023 | 0.1% |
| Turkmenistan | 1998 | 21.0% |
| Tuvalu | 2010 | 5.5% |
| Uganda | 2019 | 36.3% |
| Ukraine | 2020 | 0.0% |
| United Arab Emirates | 2018 | 0.0% |
| United Kingdom | 2021 | 0.3% |
| United States | 2024 | 0.9% |
| Uruguay | 2024 | 0.1% |
| Uzbekistan | 2025 | 1.5% |
| Vanuatu | 2019 | 11.6% |
| Venezuela, RB | 2006 | 7.0% |
| Viet Nam | 2022 | 1.1% |
| West Bank and Gaza | 2023 | 1.4% |
| Yemen, Rep. | 2014 | 19.8% |
| Zambia | 2022 | 50.4% |
| Zimbabwe | 2019 | 30.0% |
How to interpret the comparison
First, the poverty gap is not the poverty headcount rate. Second, $4.20 is a 2021-PPP poverty line, not a current-exchange-rate dollar threshold. Third, the 171 latest observations span 1992–2025. Fourth, zero values are real observations rather than missing values filled with zero.
Fifth, a latest-observation map should not be turned into a current single-year world ranking. The 2024 group of 21 and the broader 2023 group of 37 are more appropriate for same-year comparisons.
Source and calculation
The source is World Bank World Development Indicators SI.POV.LMIC.GP, Poverty gap at $4.20 a day (2021 PPP) (%). The 2024 and 2023 descriptive statistics use only observations from those respective years. The map and complete table use the latest non-empty observation for each of the 171 economies.
Frequently Asked Questions
Does a 10% poverty gap mean 10% of the population is poor?
No. The poverty gap is the population-wide average shortfall from the poverty line, with nonpoor people assigned zero shortfall.
Is $4.20 converted using today’s market exchange rate?
No. It is a poverty line expressed in 2021 purchasing power parity, which adjusts for differences in price levels.
Why does a latest-observation map include values from the 1990s?
The file uses each economy's latest non-empty observation. Some economies have no recent survey value, so an older estimate remains their latest observation.
Related Articles
Green Map creates custom-edited map images using open geographic data sources such as geoBoundaries, Natural Earth, OpenStreetMap, and government open data. These maps are edited visual materials, not raw data files, and are provided for education, documents, presentations, and graphic reference.