Part-time employment varies enormously across the economies that reported a 2022 value. The World Bank series does not simply count workers whose contract is labeled “part time.” It uses a common threshold based on actual weekly hours: employment is classified as part time when actual hours worked are below 35 per week. That definition makes the indicator useful for broad comparison, but it also means that a high share should not automatically be interpreted as weak employment conditions or a large population of workers holding formal part-time contracts.
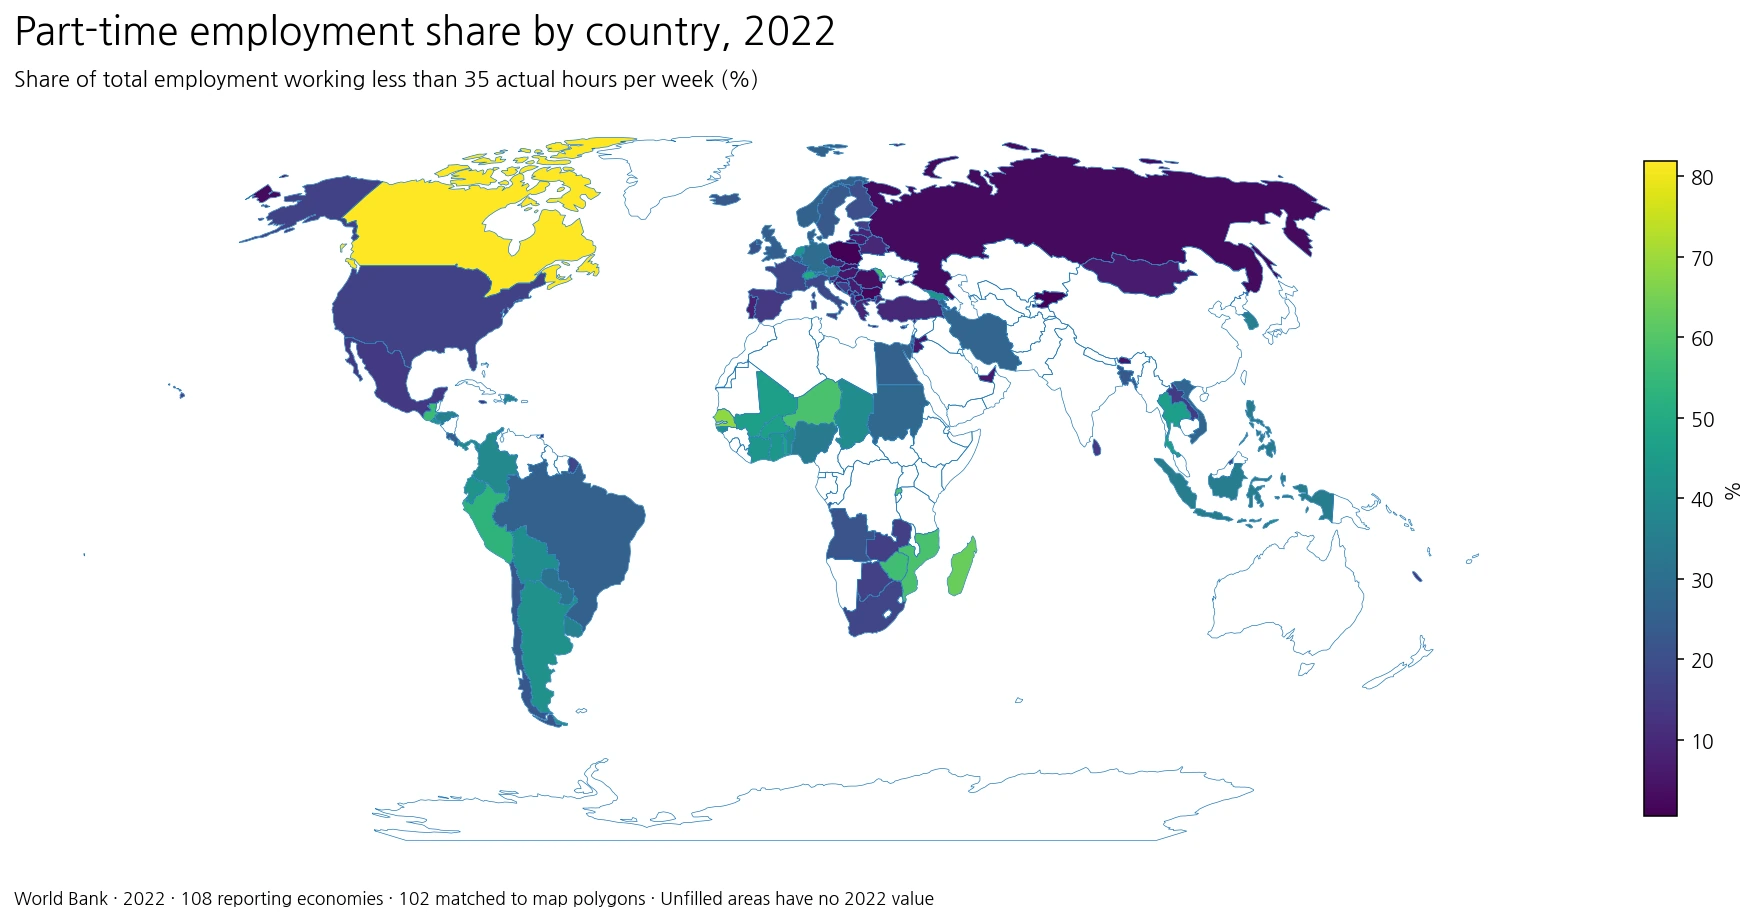
Table of Contents
The 2022 comparison contains 108 reporting economies
The analysis uses the World Bank indicator SL.TLF.PART.ZS for 2022. The country-and-economy master contains 217 entries. Of those, 108 have a non-missing observation and 109 have no value for this year. Missing observations remain missing rather than being converted to zero. An unfilled place on the map therefore means that the 2022 observation is unavailable in the dataset, not that nobody worked part time.
The simple mean across the 108 reported values is 25.21%, while the median is 21.99%. The first quartile is 9.73% and the third quartile is 39.36%, so the middle half of observations spans almost 30 percentage points. The 10th percentile is 5.39% and the 90th percentile is 48.14%. This wide distribution is a warning against describing a single percentage as “normal” across countries. The median and quartiles provide a more useful reference than the mean alone because the upper tail contains very large observations.
Canada is the highest reported value at 81.9%
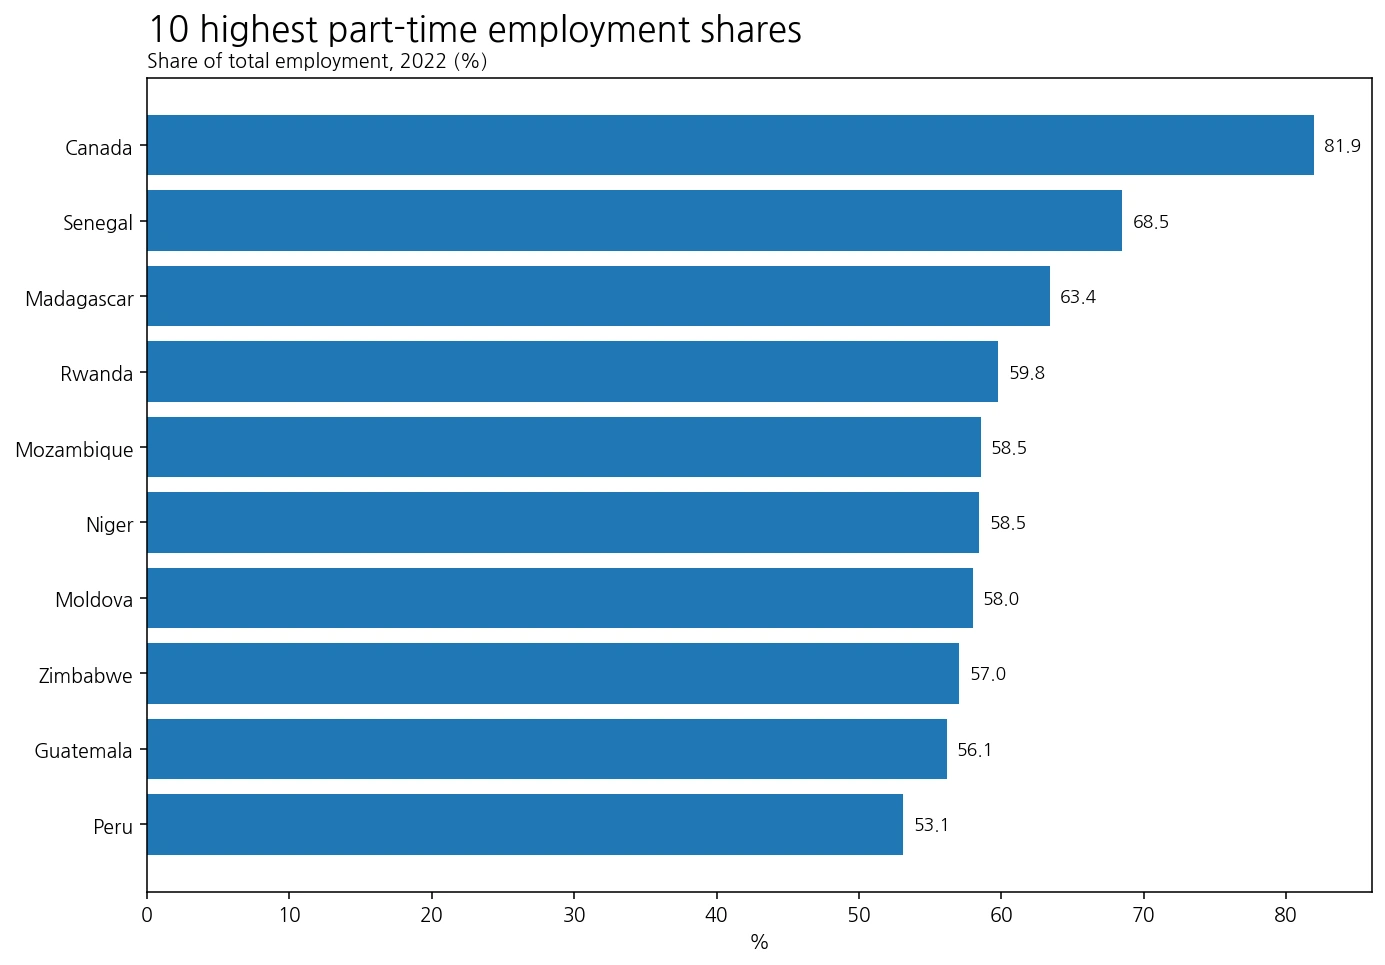
Canada records 81.934%, by far the highest observation in the 2022 comparison. Senegal follows at 68.498% and Madagascar at 63.404%. Rwanda is 59.774%, Mozambique 58.548%, Niger 58.460%, Moldova 57.986%, Zimbabwe 57.023%, Guatemala 56.146% and Peru 53.102%. The top ten therefore span North America, Africa, Europe and Latin America rather than forming one single regional block.
| Economy | Part-time employment share, 2022 |
|---|---|
| Canada | 81.9% |
| Senegal | 68.5% |
| Madagascar | 63.4% |
| Rwanda | 59.8% |
| Mozambique | 58.5% |
| Niger | 58.5% |
| Moldova | 58.0% |
| Zimbabwe | 57.0% |
| Guatemala | 56.1% |
| Peru | 53.1% |
Canada is also an important illustration of why the indicator definition matters. An 81.9% value should not be rewritten as “81.9% of Canadian workers have part-time contracts.” The series is defined by actual weekly hours, not the contractual label attached to a job. Actual hours can be affected by the reference week, temporary absence, leave, multiple jobs and survey conventions. When an observation is unusually far from the rest of the distribution, country-specific metadata and the underlying labor survey are especially important before drawing conclusions.
High shares form visible clusters in Sub-Saharan Africa and Latin America
The map shows many high observations across Sub-Saharan Africa. Senegal is 68.5%; Niger, Rwanda and Mozambique are around 58–60%; Zimbabwe is 57.0%; Togo is 47.4%; Burkina Faso and Mali are just above 46%; Ghana and Côte d’Ivoire are around 43%; and Benin and Chad are close to 40%. Madagascar is above 63%. The pattern is geographically broad, covering western, eastern and southern parts of the region rather than one isolated group of countries.
Latin America also contains a substantial group of high shares. Guatemala is 56.1% and Peru 53.1%. El Salvador is 43.1%, Ecuador 42.1%, Argentina 41.3%, Bolivia 40.7%, Panama 39.2%, Colombia 38.7% and the Dominican Republic 37.3%. Those values identify a regional pattern worth investigating, but the map cannot establish a common cause. Differences in sectoral structure, self-employment, informal work, survey design, seasonality and customary working hours may all affect the measured share.
Europe contains some of the widest neighboring contrasts
Europe is not a uniform low- or high-part-time region in this dataset. Switzerland records 49.945% and the Netherlands 43.341%. Austria is 31.135%, Germany 29.527%, Norway 25.869%, Denmark 25.403% and the United Kingdom 24.988%. At the other end, Poland records only 0.564%, Bulgaria 2.044%, Romania 3.626%, the Slovak Republic 3.631% and Hungary 5.228%. These differences occur within one continent and sometimes between relatively nearby labor markets.
The contrast is a reminder that “part time” is not inherently a negative or positive labor outcome. Shorter hours may reflect worker preference, caregiving arrangements, education, retirement transitions, seasonal activity or job-sharing. They can also reflect involuntary underemployment when people want more hours but cannot obtain them. The total part-time employment share does not distinguish those situations, so rankings should not be converted into a league table of labor-market quality.
The lowest observations are below 5% in several economies
Poland has the lowest reported value at 0.564%, followed by the Kyrgyz Republic at 0.687% and the West Bank and Gaza at 0.914%. Bulgaria is 2.044%, the Russian Federation 2.528%, Romania 3.626%, the Slovak Republic 3.631% and North Macedonia 3.948%. Hungary is 5.228% and Bhutan 5.330%. These low shares simply mean that fewer employed people worked under 35 actual hours in the measured reference framework.
| Economy | Part-time employment share, 2022 |
|---|---|
| Poland | 0.6% |
| Kyrgyz Republic | 0.7% |
| West Bank and Gaza | 0.9% |
| Bulgaria | 2.0% |
| Russian Federation | 2.5% |
| Romania | 3.6% |
| Slovak Republic | 3.6% |
| North Macedonia | 3.9% |
| Hungary | 5.2% |
| Bhutan | 5.3% |
A low percentage does not by itself indicate secure full-time employment. It does not describe wages, contract duration, social insurance coverage, informal employment, excessive hours or whether workers would prefer a different schedule. A labor market with very long customary hours could produce a low part-time share, as could a labor market in which formal part-time arrangements are uncommon. Those possibilities require different indicators and country-level evidence.
The 35-hour threshold improves consistency but does not remove comparability limits
The World Bank metadata defines part-time employment in this series using a common threshold of fewer than 35 actual weekly hours worked. Applying one threshold is more consistent than comparing national legal labels, which can differ substantially. Even so, actual hours are sensitive to survey reference periods, temporary absence and the treatment of workers with multiple jobs. A one- or two-point difference between countries should therefore not be treated as precise evidence that one labor market uses part-time work more heavily in every meaningful sense.
The metadata also notes that labor-force surveys are generally the preferred source for hours-of-work statistics, while other household surveys or establishment surveys may be used in some settings. Establishment surveys can have narrower coverage, sometimes focusing on employees or formal-sector workers rather than the entire employed population. Differences in data source and coverage are one reason to emphasize broad ranges and spatial patterns instead of overinterpreting exact rank positions.
What the indicator measures — and what it leaves unanswered
Directly, the indicator measures the share of total employment working fewer than 35 actual hours per week. It tells us how common relatively short weekly hours are among people counted as employed. It does not tell us why those hours are short, whether the worker wants more hours, whether the job is permanent, whether benefits are provided, or whether the person also holds another job. It also does not show differences between women and men or between age groups.
For a fuller view of labor-market conditions, the part-time share can be paired with the employment-to-population ratio, labor-force participation, unemployment, average weekly hours, time-related underemployment, earnings and informality measures. A high part-time share combined with high employment and strong worker choice may describe a very different system from a high share combined with widespread underemployment. The map is best used to identify where those follow-up questions matter most.
Five rules for reading the 2022 map
- The denominator is total employment, not the working-age population or labor force.
- Part time is defined here as fewer than 35 actual weekly hours, which may differ from contractual status.
- The 109 missing economies remain missing; an unfilled map area is not a zero.
- Large regional contrasts are more reliable for interpretation than tiny differences in rank.
- High and low shares should be checked against employment, unemployment, underemployment and hours data before making a broader judgment.
These rules make the map a comparison tool rather than a scorecard. Canada’s extreme value calls for a close reading of the measurement framework. The cluster of high values across parts of Africa and Latin America points to regions where working-time structure deserves further study. Very low observations in parts of Central and Eastern Europe raise a different set of questions about full-time norms and actual hours. None of those questions can be answered from this percentage alone.
Source and calculation method
The values come from the World Bank metadata for Part time employment, total (% of total employment), indicator SL.TLF.PART.ZS. The World Bank identifies the ILO Wages and Working Time Statistics database as the underlying source and describes part-time employment using the common threshold of fewer than 35 actual weekly hours. Regional aggregates were excluded, leaving 108 non-missing country/economy observations for 2022. The mean, median, quartiles and rankings in this article were calculated directly from those observations.
This is a single-year cross-section, not a trend analysis. It cannot show whether an economy’s part-time share is rising or falling, whether 2022 was unusual, or whether a methodological break affected the series. Those questions require multi-year data and national documentation. The purpose here is narrower: to compare the verified 2022 observations on a common map while keeping missing data and definition limits visible.
Frequently Asked Questions
Does this indicator count only workers with formal part-time contracts?
No. The World Bank series uses a common definition based on fewer than 35 actual weekly hours worked, so contractual labels and the measured indicator are not necessarily identical.
Does a high part-time employment share mean a weak labor market?
Not by itself. Short hours can be voluntary or involuntary and can reflect labor-market structure, worker preferences, sector mix and survey methods. Other employment and underemployment indicators are needed.
Do unfilled countries on the map have 0% part-time employment?
No. They have no 2022 observation in this comparison. Missing values were preserved rather than replaced with zero.
Related Articles
Green Map creates custom-edited map images using open geographic data sources such as geoBoundaries, Natural Earth, OpenStreetMap, and government open data. These maps are edited visual materials, not raw data files, and are provided for education, documents, presentations, and graphic reference.