Grants excluding technical cooperation differed enormously across countries and economies in 2023. Using a same-year subset of World Bank series BX.GRT.EXTA.CD.WD, Ukraine records about $16.64 billion, followed by the Syrian Arab Republic at $8.91 billion, Ethiopia at $4.46 billion, and Yemen at $4.05 billion. The indicator covers grant-type transfers for which repayment is not required, while excluding technical-cooperation grants.
The latest-non-missing source contains 180 country and economy observations, but only 136 are dated 2023. The other 44 observations are from 1995 through 2021. Mixing those older current-dollar values with 2023 amounts would create a misleading cross-country ranking, so every map, ranking, mean, median and distribution below uses only the 136 observations from 2023.
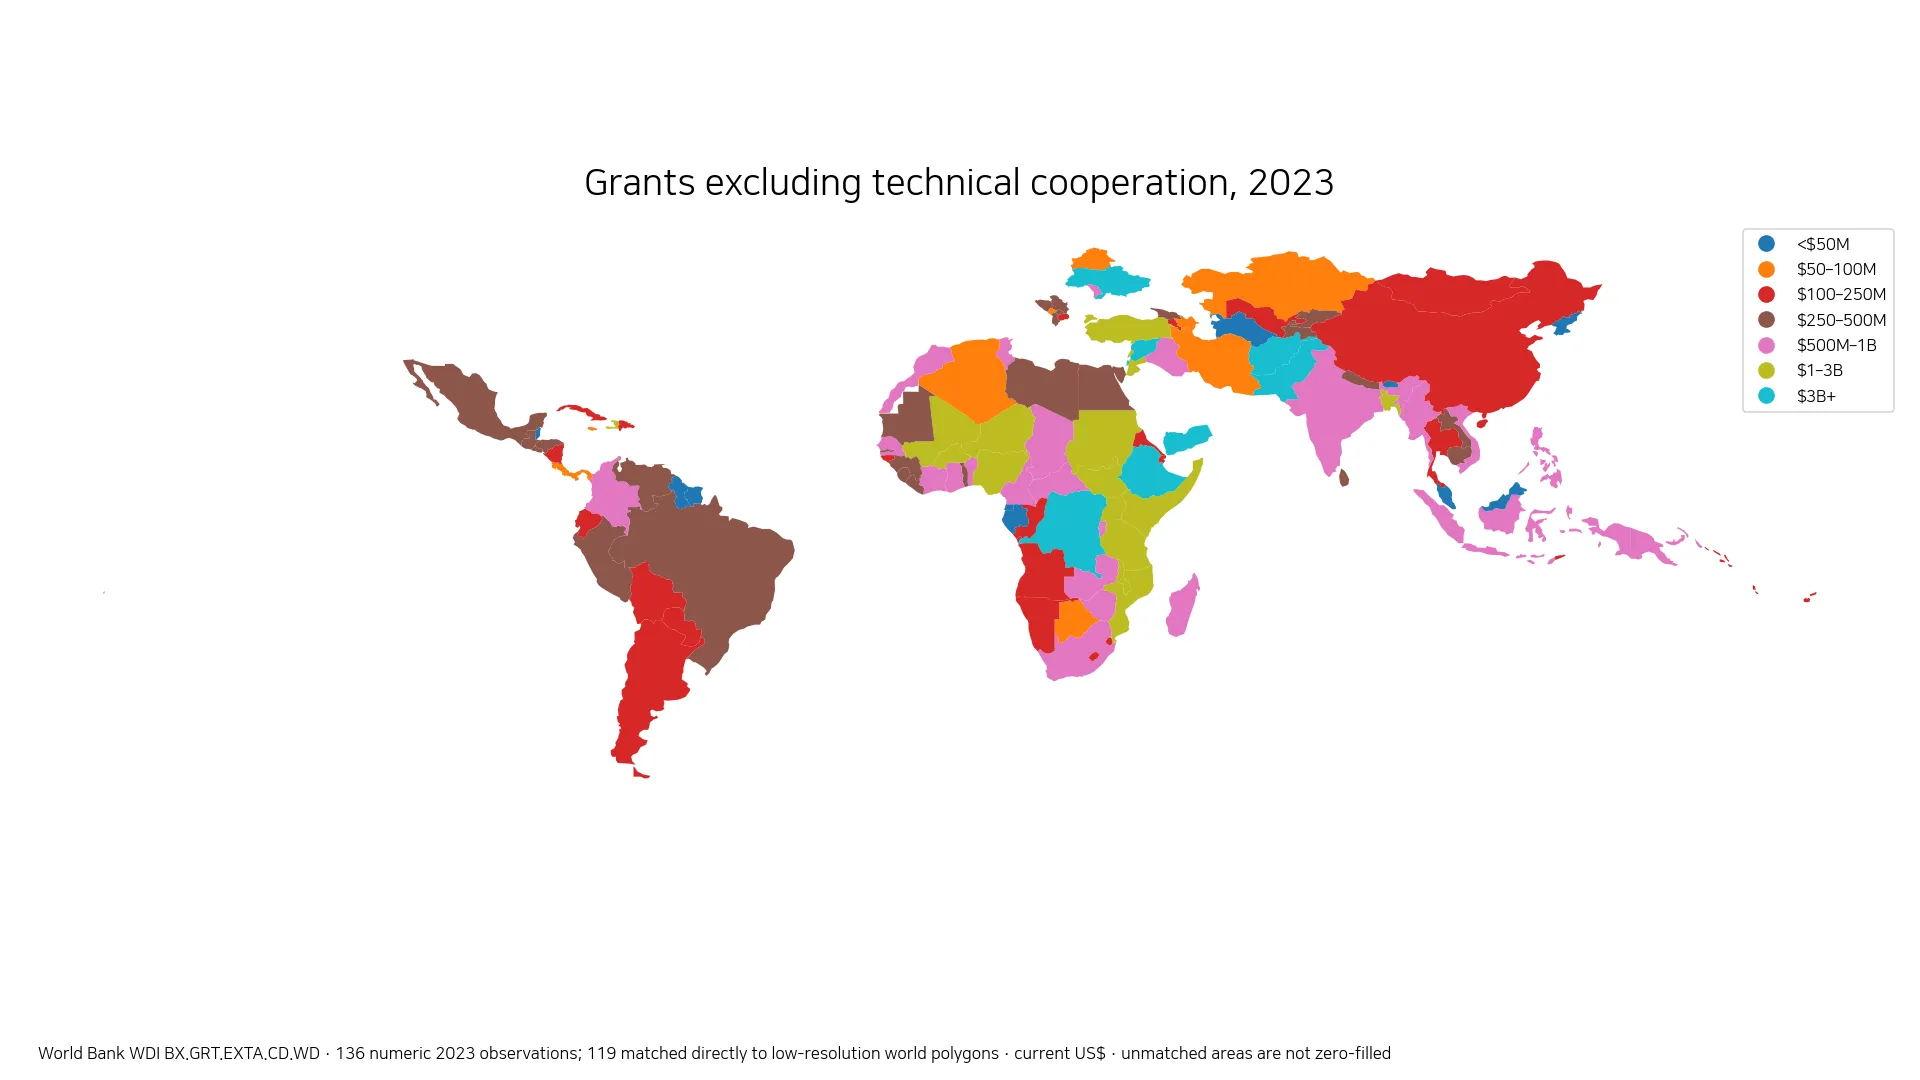
Table of Contents
What this grant indicator includes
The World Bank defines grants in this series as transfers in cash, goods or services for which repayment is not required. For ODA reporting, the definition can include forgiveness of non-military debt, support to non-governmental organizations, certain interest subsidies and some costs incurred in implementing aid. It can also include qualifying grant-like flows. Technical-cooperation grants, however, are tracked separately and are excluded from this indicator.
The distinction matters because this series is not a complete measure of every form of foreign assistance received by a country. Technical cooperation is outside the total, and other forms of assistance may be recorded under different statistical categories. The unit is current US dollars, so the values are nominal amounts for 2023 rather than inflation-adjusted dollars, per-capita amounts or percentages of GDP.
The median is about $298 million, while 25 observations exceed $1 billion
Across the 136 same-year observations, the simple mean is about $785.1 million and the median is about $297.9 million. The mean is much higher than the median because a small number of multi-billion-dollar observations stretch the upper tail. Twenty-five countries and economies record at least $1 billion, eight exceed $3 billion, and 17 are below $50 million.
| 2023 amount | Countries/economies |
|---|---|
| Below $50M | 17 |
| $50M–<$100M | 13 |
| $100M–<$250M | 31 |
| $250M–<$500M | 26 |
| $500M–<$1B | 24 |
| $1B–<$3B | 17 |
| $3B+ | 8 |
The 136 observations sum to roughly $106.8 billion. That figure should not be treated as a complete worldwide total. It is the sum of the economies with a numeric 2023 observation in this series, while economies without a 2023 value are intentionally left out of the synchronized comparison.
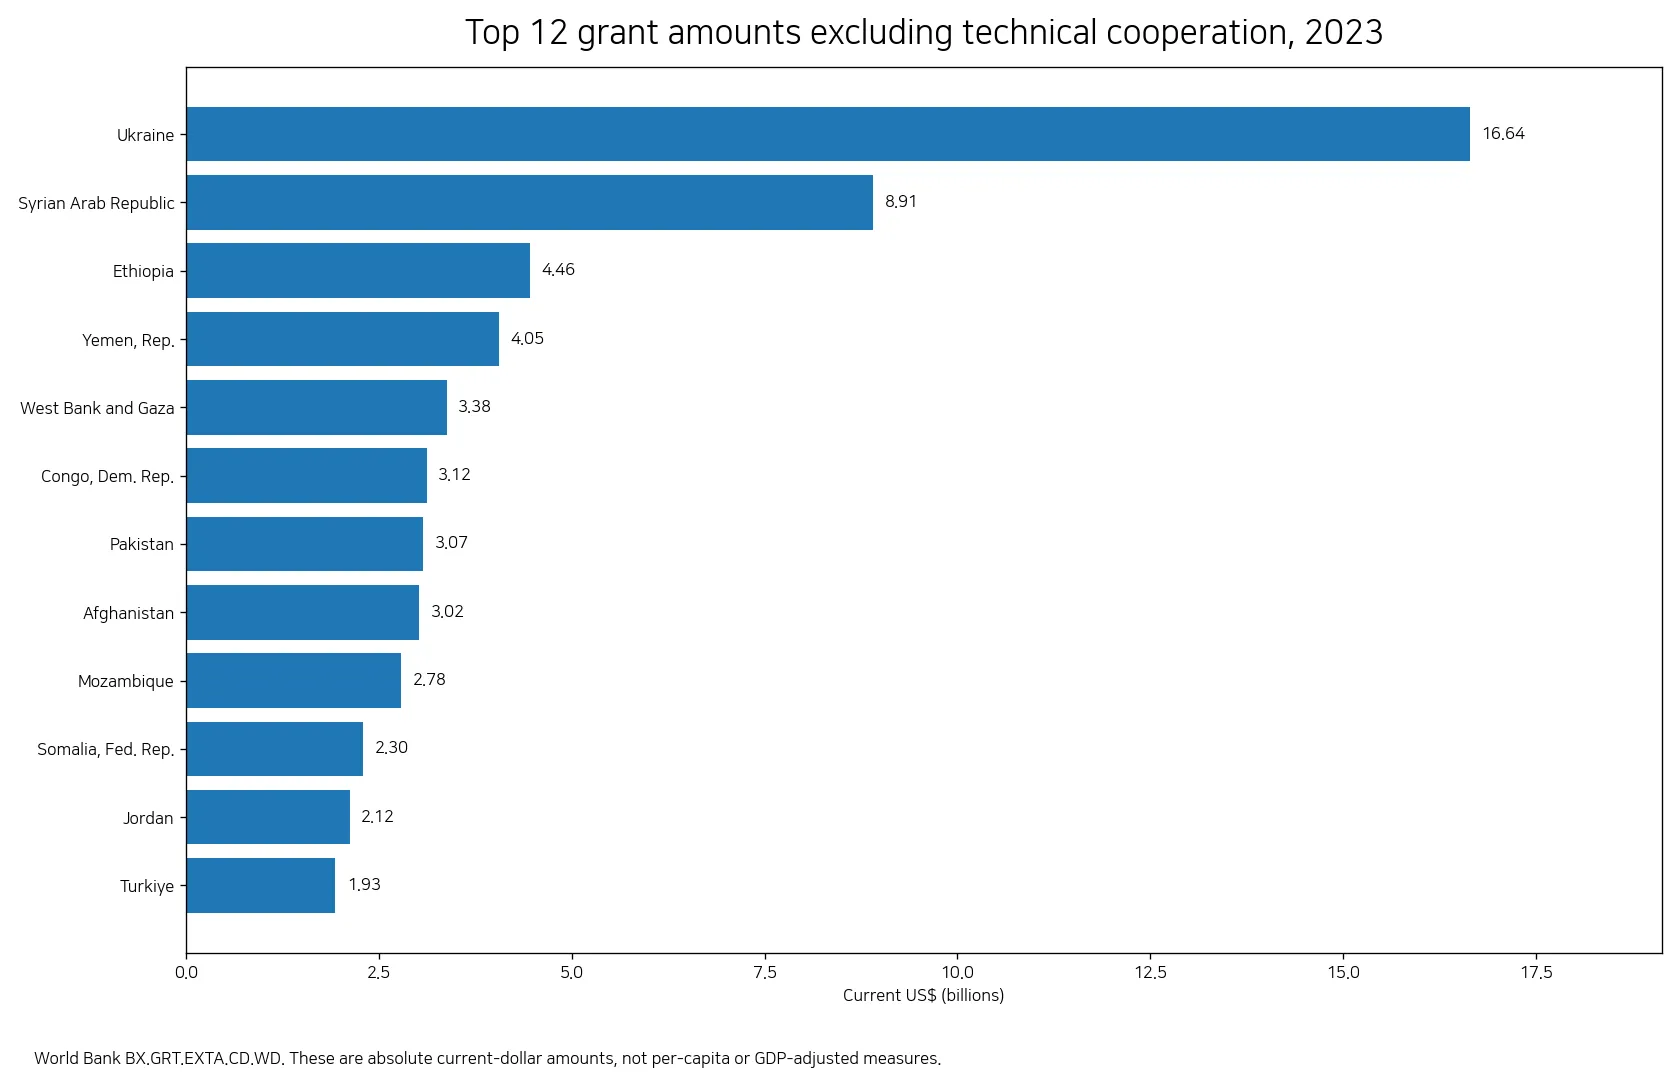
Ukraine is far above the rest of the 2023 distribution
Ukraine records about $16.64 billion, almost $7.7 billion more than the Syrian Arab Republic at $8.91 billion. Ethiopia follows at $4.46 billion, Yemen at $4.05 billion, West Bank and Gaza at $3.38 billion, Democratic Republic of the Congo at $3.12 billion, Pakistan at $3.07 billion, and Afghanistan at $3.02 billion.
| Country/economy | 2023 amount |
|---|---|
| Ukraine | $16.64B |
| Syrian Arab Republic | $8.91B |
| Ethiopia | $4.46B |
| Yemen, Rep. | $4.05B |
| West Bank and Gaza | $3.38B |
| Congo, Dem. Rep. | $3.12B |
| Pakistan | $3.07B |
| Afghanistan | $3.02B |
| Mozambique | $2.78B |
| Somalia, Fed. Rep. | $2.30B |
Mozambique follows at about $2.78 billion, Somalia at $2.30 billion, Jordan at $2.12 billion, and Turkiye at $1.93 billion. Nigeria, Uganda, South Sudan, Kenya, Bangladesh, Lebanon, Tanzania and Malawi also exceed $1 billion. On the map, the highest bands appear in parts of Eastern Europe, the Middle East, Sub-Saharan Africa and South Asia rather than forming one continuous geographic block.
Absolute grant totals are not measures of aid intensity
A dark map category does not automatically mean that an economy is more dependent on grants. The indicator is an absolute current-dollar amount. A populous country can receive a large total while recording a modest amount per person, and a small state can receive a smaller total even when the per-capita amount is substantial. Comparing relative intensity would require a denominator such as population, GDP, government revenue or total external financing.
For perspective, India records about $645 million in 2023, Brazil about $332 million, Mexico about $314 million, China about $103 million, Indonesia about $958 million, and South Africa about $829 million. Those figures cannot by themselves establish which country had greater financing needs, stronger donor engagement or more effective programs. Country size, income level, the mix of assistance, and the timing of individual projects all differ.
The dataset does not explain why an amount is high
Several high-value observations are associated with places that have received substantial international attention in recent years, including Ukraine, Syria, Yemen, West Bank and Gaza, and Afghanistan. The series itself, however, reports amounts rather than causes. It does not break the total into humanitarian relief, development programs, debt-related actions, or individual donor contributions.
That limitation is important when interpreting the ranking. A high figure can reflect multiple types of eligible grant flows recorded during the year, and the composition can differ sharply from one economy to another. Establishing why a value rose or fell requires more detailed OECD DAC data and official program records by donor, purpose and channel rather than inference from the headline amount alone.
Why technical-cooperation grants are separated
Technical-cooperation grants serve a different statistical purpose. The World Bank’s related technical-cooperation series describes grants intended to transfer technical and managerial skills or technology, either to build general national capacity or to strengthen the ability to carry out specific investment projects. The indicator analyzed here removes that component so that the remaining grant flows can be examined separately.
As a result, a country with a modest value in this series could still receive significant technical-cooperation support, while a country with a large value here is not necessarily receiving a correspondingly large amount of technical assistance. Any attempt to compare the two components should use the same year and geographic coverage and should keep their different purposes clear.
The map directly represents 119 of the 136 observations
All 136 numeric 2023 observations are retained for the statistics and rankings. A join to a simplified Natural Earth world boundary layer matches 119 of them directly to polygons. Small island states and territories such as Comoros, Cabo Verde, Dominica, Micronesia, Grenada, Kiribati, Maldives, Marshall Islands, Palau, Tonga and Tuvalu may not have distinct polygons at this world-scale resolution.
Those unmatched small economies are not discarded from the statistical analysis and are never converted to zero. Conversely, countries without a 2023 observation are not filled with an older latest-available value simply to color the map. The map is therefore best used for broad spatial patterns, while the tables and chart preserve values for places that are difficult to see at global scale.
How to read current-dollar comparisons
Current US dollars are straightforward for comparing nominal grant totals within the same year, but they are not designed for comparing purchasing power or real change over long periods. A multi-year analysis would need to consider inflation and exchange-rate effects, and a comparison of grant intensity would need an appropriate denominator. The 2023 map answers a narrower question: where were the largest recorded nominal grant amounts, excluding technical cooperation, among economies with data for that year?
The distribution is strongly skewed. The median is below $300 million even though the mean is close to $785 million, and the eight observations above $3 billion account for a large share of the summed amount. Reporting both central measures avoids giving the impression that a billion-dollar figure is typical across the sample.
Data source and comparison method
The numeric source is World Bank World Development Indicators series BX.GRT.EXTA.CD.WD. World Bank metadata identifies OECD Development Assistance Committee country and regional flow data as the underlying source. Every ranking, distribution count, map category, mean and median in this article is calculated from the 136 numeric observations dated 2023. Forty-four older latest-available observations in the source extract are excluded from the same-year comparison.
This approach keeps the time basis consistent but also means that the article does not claim complete global coverage. The series is most useful here as a cross-country view of recorded grant amounts in one year. It should be combined with per-capita, GDP-relative, donor-level and purpose-level data when the question shifts from absolute volume to dependence, burden, effectiveness or program composition.
Frequently Asked Questions
What are grants excluding technical cooperation?
They are grant-type transfers for which repayment is not required, excluding grants specifically intended for technical or managerial skill and technology transfer. World Bank series BX.GRT.EXTA.CD.WD reports the amounts in current US dollars.
Which country has the largest 2023 amount?
Among the 136 observations dated 2023, Ukraine is highest at about $16.64 billion, followed by the Syrian Arab Republic at about $8.91 billion and Ethiopia at about $4.46 billion.
Does a large total mean greater dependence on foreign aid?
Not necessarily. The indicator is an absolute current-dollar amount and does not adjust for population, GDP or government finances. Relative dependence requires an appropriate denominator and additional data.
Why are only 136 observations used when the latest-available file has 180?
Only 136 of the 180 latest non-missing observations are dated 2023. The other 44 are from earlier years, so they are excluded to keep the cross-country comparison on one time basis.
Related Articles
Green Map creates custom-edited map images using open geographic data sources such as geoBoundaries, Natural Earth, OpenStreetMap, and government open data.
These maps are edited visual materials, not raw data files, and are provided for education, documents, presentations, and graphic reference.