Residential kerosene prices in the 2024 State Energy Data System vary meaningfully across U.S. states. Among the 49 jurisdictions with positive comparable values, Indiana and Tennessee are highest at $30.87 per million Btu, while Montana is lowest at $23.63. The positive-value range is therefore $7.24 per million Btu. These figures should be read as energy-normalized residential kerosene prices, not as a direct retail quote per gallon. The distinction matters because SEDS is designed to compare energy prices across fuels and sectors using a common Btu basis.
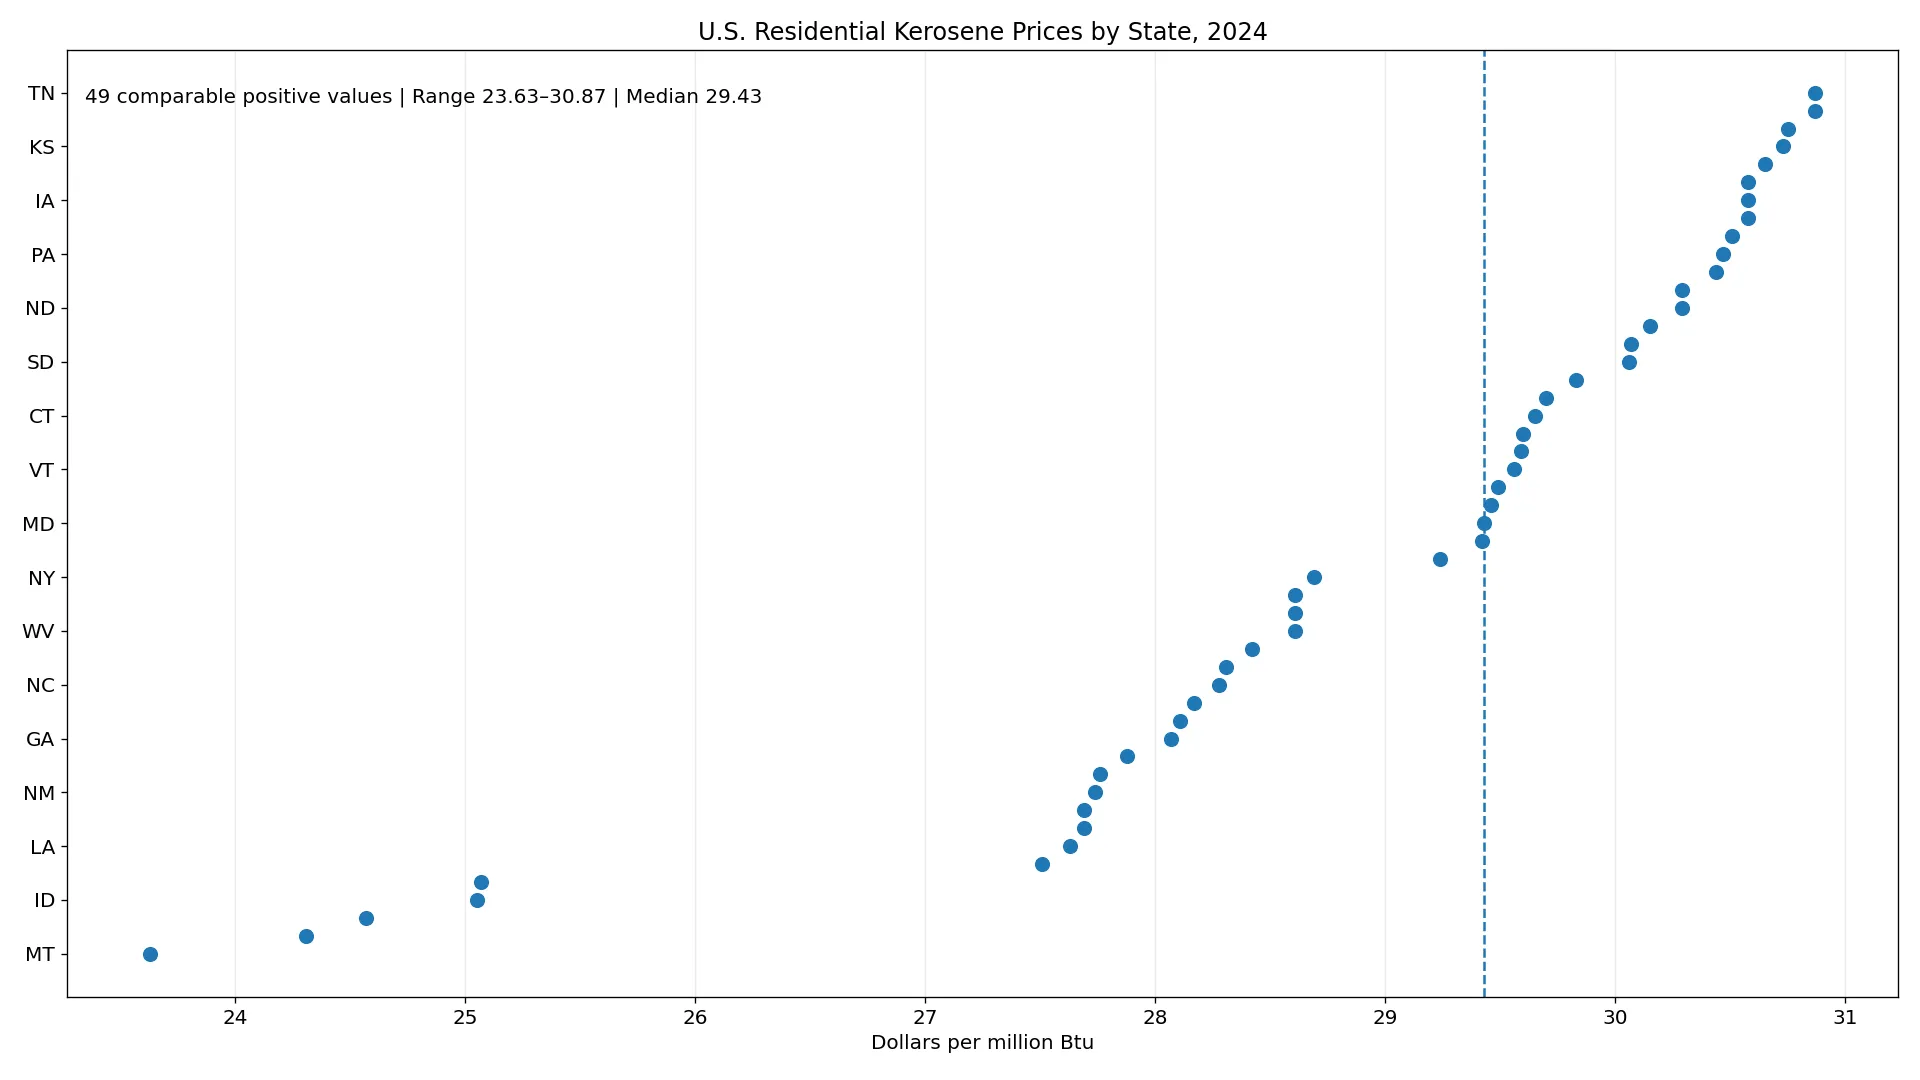
Table of Contents
What the residential kerosene price measures
EIA identifies the residential kerosene price series as KSRCD and reports it in dollars per million Btu. A million Btu is an energy-content unit, so the number is not interchangeable with a dollars-per-gallon retail sign. Converting fuels to a common energy basis allows analysts to compare kerosene with heating oil, natural gas, electricity, biomass, and other fuels without pretending that their physical units are the same. For a household shopper, however, an actual invoice still depends on the physical quantity purchased, delivery arrangements, taxes, and local market conditions.
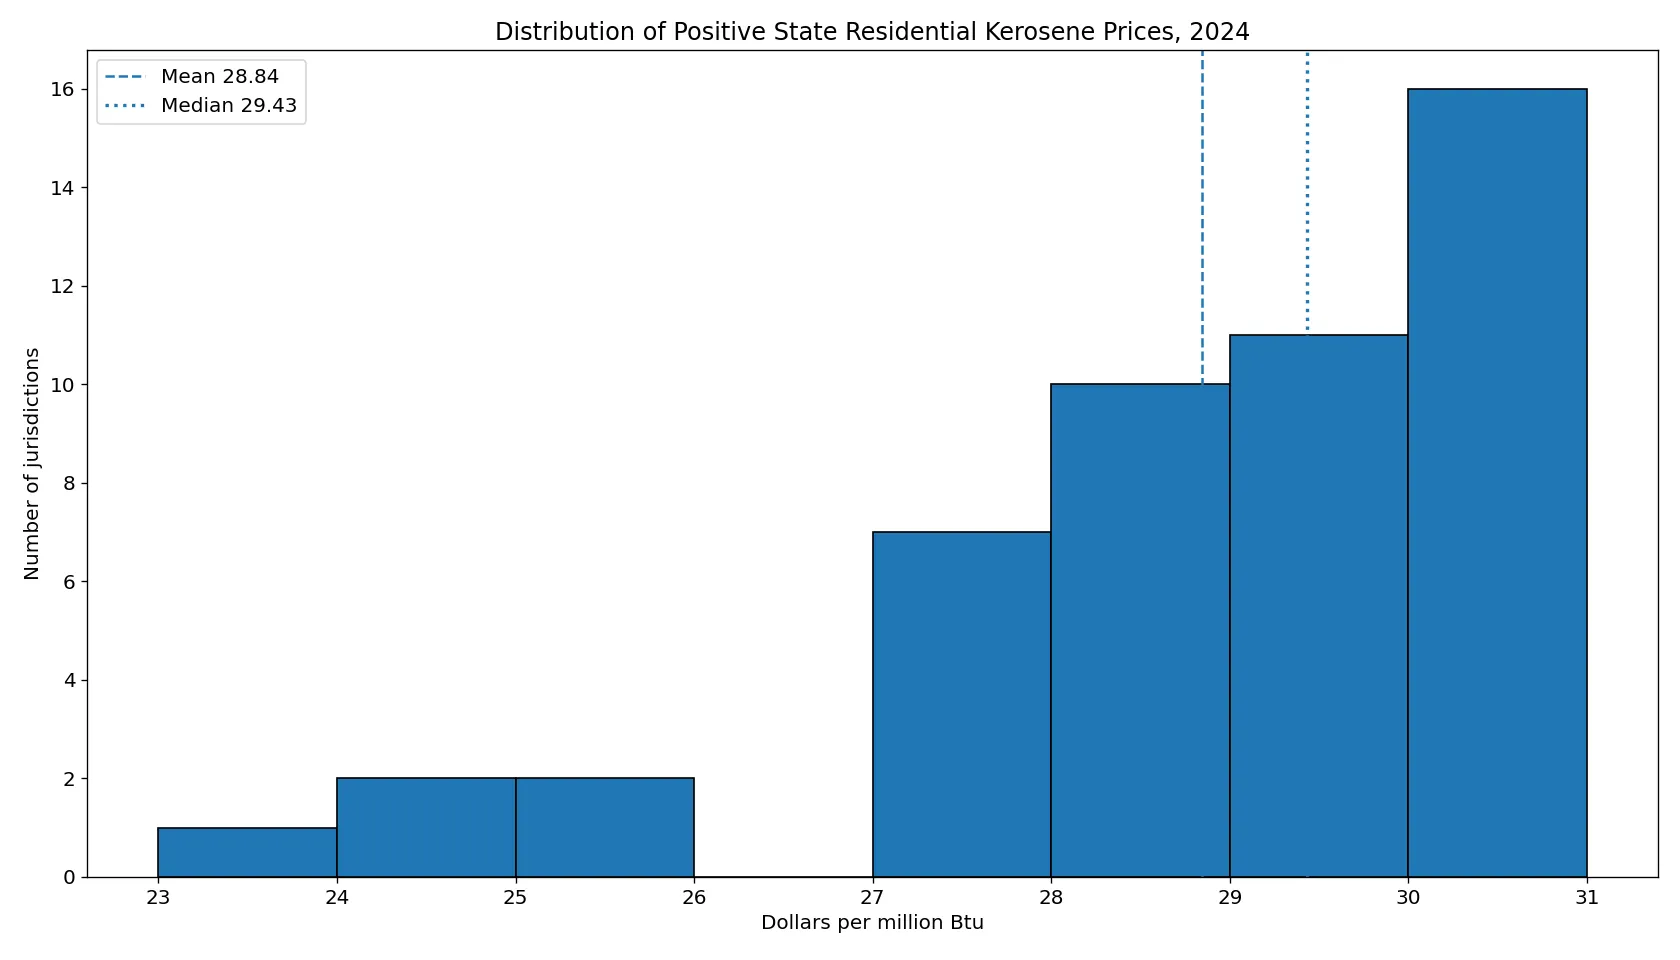
Across the 49 positive observations, the mean is $28.84/MMBtu and the median is $29.43/MMBtu. The middle half of the values runs from about $28.07 to $30.29. That relatively tight middle band explains why many state values look similar even though the full range is wider. Several Mountain West states sit well below the national cluster, while a number of Midwestern and Southern states exceed $30/MMBtu.
States at the high end in 2024
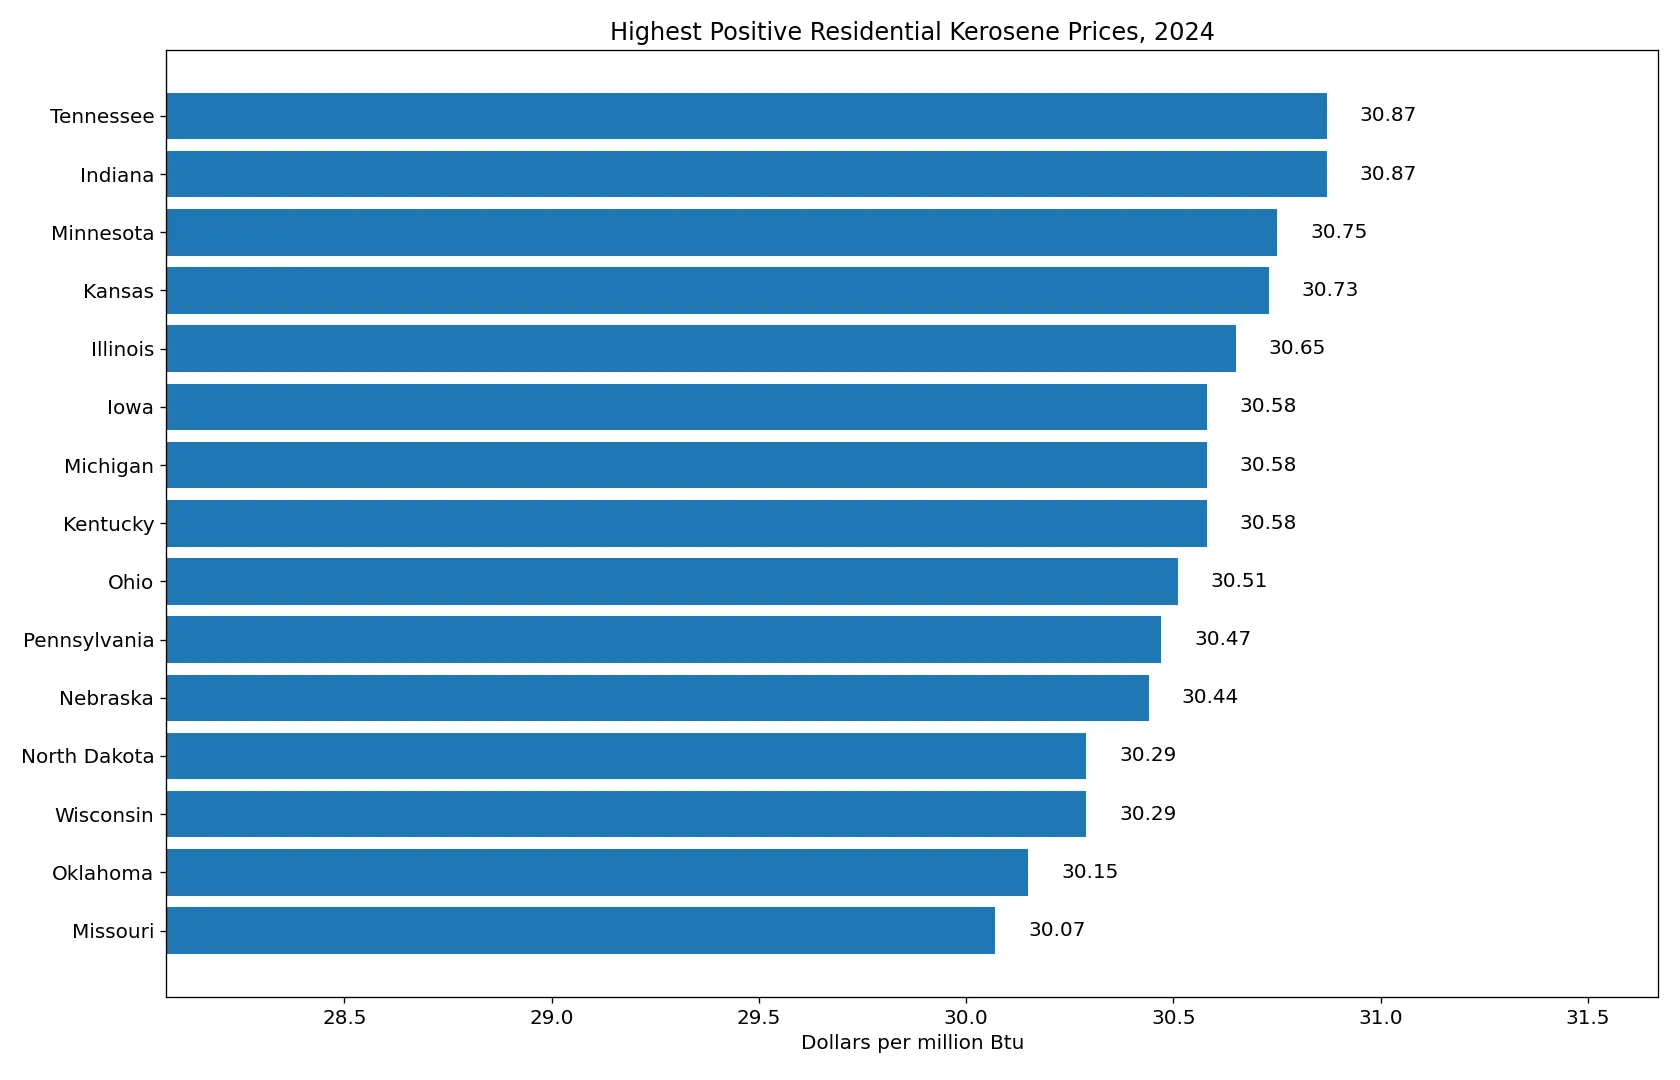
Indiana and Tennessee share the highest positive value at $30.87/MMBtu. Minnesota follows at $30.75, Kansas at $30.73, and Illinois at $30.65. Kentucky, Michigan, and Iowa each register $30.58. The high end is therefore not driven by a single isolated outlier. Instead, a group of states occupies a narrow band above $30 per million Btu.
A high kerosene price does not imply that a state consumes a large amount of kerosene. Price, consumption, and expenditure are separate measures. A state can have a high estimated price and very little residential kerosene use, while another state can use more fuel at a lower price. Household heating patterns also depend on climate, housing stock, fuel availability, and the prevalence of alternatives such as natural gas, electricity, propane, or distillate fuel oil.
States with the lowest positive prices
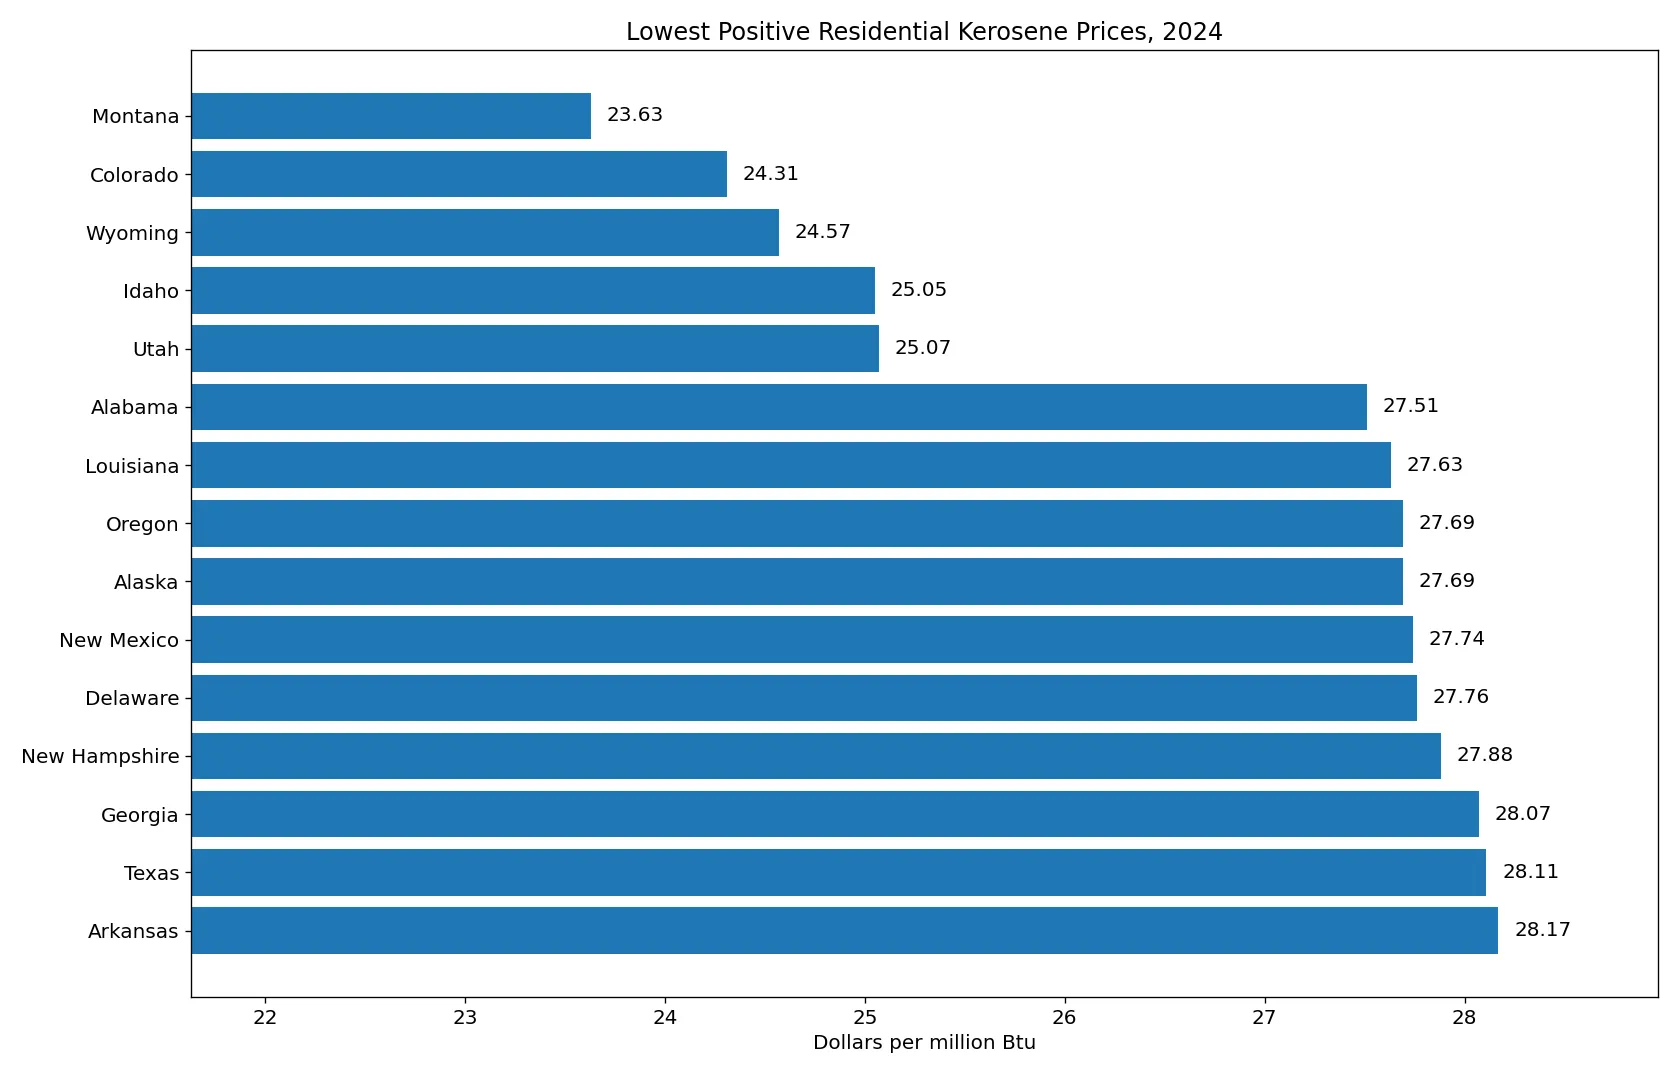
Montana has the lowest positive 2024 residential kerosene price at $23.63/MMBtu. Colorado is next at $24.31, followed by Wyoming at $24.57, Idaho at $25.05, and Utah at $25.07. Alabama, Louisiana, Alaska, and Oregon also sit below most of the positive-value distribution. The concentration of several low values in the Mountain West is one of the clearest geographic patterns in this state comparison.
The highest positive value is roughly 30.6% above the lowest positive value. That percentage describes the spread in the SEDS price estimates; it does not mean that one household pays 30.6% more for annual heating than another. Annual spending depends on consumption volumes, building efficiency, weather, heating season length, and whether kerosene is the primary or a supplemental fuel.
Why District of Columbia and Hawaii are not treated as $0 prices
The state series used for this comparison shows 0.00 for District of Columbia and Hawaii. Those entries should not be presented as free kerosene. EIA’s published kerosene price-and-expenditure table shows Hawaii with a dash for the residential-and-commercial price, while the District of Columbia is presented through the combined residential-and-commercial price column and related expenditure fields. Because the public table does not support a literal $0/MMBtu household-price interpretation, both entries are separated from the positive-price ranking rather than placed at the bottom as zero-price states.
That choice also prevents a misleading average. Treating the two zeros as market prices would push the mean downward and create artificial extreme-low points in a map or chart. For a price comparison, the 49 positive values provide the more meaningful range, median, and distribution. The complete table still retains all 51 jurisdictions, with the two non-comparable entries shown as dashes.
How EIA estimates state kerosene prices after 2021
The methodology is especially important for recent years. EIA suspended survey EIA-782 after data year 2021, removing the previous source of end-user price observations. For 2022 forward, SEDS estimates residential, commercial, and industrial kerosene prices with state-level regression models. EIA says the models use historical SEDS state kerosene prices together with variables such as the annual U.S. residential No. 2 heating oil price, New York statewide retail kerosene prices from NYSERDA, and U.S. crude oil spot prices.
This change is documented on the SEDS data and methodology changes page. It means a 2024 state value is not simply an average of every retail kerosene transaction observed within that state. It is an official SEDS estimate built to preserve a consistent state series after the earlier survey was discontinued. Long-run comparisons that cross 2021 and 2022 should therefore acknowledge the break in source methodology.
Most positive values cluster near the upper 20s
The distribution is concentrated between roughly $28 and $31/MMBtu. The mean of $28.84 and median of $29.43 are close, but a handful of lower Mountain West values pull the mean downward. Looking only at a single U.S. average would hide this structure. The histogram and the full state table make it easier to see that the dominant pattern is a broad cluster in the upper 20s, with a smaller lower-price group.
Kerosene should not be confused with other residential petroleum prices
SEDS tracks kerosene separately from distillate fuel oil, hydrocarbon gas liquids, motor gasoline, and broader petroleum aggregates. A residential distillate-fuel-oil price can therefore differ from the kerosene price in the same state and year. Likewise, a commercial kerosene price is not automatically identical to a residential price just because both refer to the same fuel. When comparing related EIA tables, the fuel name, sector, unit, and year all need to match.
The dollars-per-million-Btu unit also answers a different question from a retail dollars-per-gallon series. An energy-normalized price is useful for cross-fuel analysis, but it does not by itself tell a household how much a delivery will cost. Taxes, delivery fees, purchase quantities, supplier contracts, and local availability can affect actual bills even when the SEDS energy price is unchanged.
All 51 states and jurisdictions
The table below lists the 2024 residential kerosene price series for all 50 states and the District of Columbia. Positive values are ordered from highest to lowest. District of Columbia and Hawaii are shown with dashes because they are not treated as literal zero-dollar household prices in this comparison.
| State or jurisdiction | Code | Year | Residential kerosene price ($/MMBtu) |
|---|---|---|---|
| Indiana | IN | 2024 | 30.87 |
| Tennessee | TN | 2024 | 30.87 |
| Minnesota | MN | 2024 | 30.75 |
| Kansas | KS | 2024 | 30.73 |
| Illinois | IL | 2024 | 30.65 |
| Iowa | IA | 2024 | 30.58 |
| Kentucky | KY | 2024 | 30.58 |
| Michigan | MI | 2024 | 30.58 |
| Ohio | OH | 2024 | 30.51 |
| Pennsylvania | PA | 2024 | 30.47 |
| Nebraska | NE | 2024 | 30.44 |
| North Dakota | ND | 2024 | 30.29 |
| Wisconsin | WI | 2024 | 30.29 |
| Oklahoma | OK | 2024 | 30.15 |
| Missouri | MO | 2024 | 30.07 |
| South Dakota | SD | 2024 | 30.06 |
| Rhode Island | RI | 2024 | 29.83 |
| California | CA | 2024 | 29.70 |
| Connecticut | CT | 2024 | 29.65 |
| New Jersey | NJ | 2024 | 29.60 |
| Nevada | NV | 2024 | 29.59 |
| Vermont | VT | 2024 | 29.56 |
| Washington | WA | 2024 | 29.49 |
| Massachusetts | MA | 2024 | 29.46 |
| Maryland | MD | 2024 | 29.43 |
| Maine | ME | 2024 | 29.42 |
| Arizona | AZ | 2024 | 29.24 |
| New York | NY | 2024 | 28.69 |
| Florida | FL | 2024 | 28.61 |
| South Carolina | SC | 2024 | 28.61 |
| West Virginia | WV | 2024 | 28.61 |
| Virginia | VA | 2024 | 28.42 |
| Mississippi | MS | 2024 | 28.31 |
| North Carolina | NC | 2024 | 28.28 |
| Arkansas | AR | 2024 | 28.17 |
| Texas | TX | 2024 | 28.11 |
| Georgia | GA | 2024 | 28.07 |
| New Hampshire | NH | 2024 | 27.88 |
| Delaware | DE | 2024 | 27.76 |
| New Mexico | NM | 2024 | 27.74 |
| Alaska | AK | 2024 | 27.69 |
| Oregon | OR | 2024 | 27.69 |
| Louisiana | LA | 2024 | 27.63 |
| Alabama | AL | 2024 | 27.51 |
| Utah | UT | 2024 | 25.07 |
| Idaho | ID | 2024 | 25.05 |
| Wyoming | WY | 2024 | 24.57 |
| Colorado | CO | 2024 | 24.31 |
| Montana | MT | 2024 | 23.63 |
| District of Columbia | DC | 2024 | — |
| Hawaii | HI | 2024 | — |
What this comparison is best used for
The strongest use of this dataset is to compare the relative level and geographic spread of 2024 residential kerosene prices on a common energy basis. It shows a positive-price range of $23.63 to $30.87/MMBtu, identifies a median of $29.43, and highlights a low-price cluster in parts of the Mountain West. It also shows why recent state kerosene prices need a methodology note: the post-2021 series relies on regression estimates rather than the discontinued EIA-782 end-user survey.
Primary references are the EIA State Energy Data System, the 2024 kerosene price and expenditure table, the 2024 residential-sector energy price table, and the SEDS methodology-change documentation. EIA notes that SEDS data can be revised in later production cycles, so users citing a specific year should check the current published table.
Frequently Asked Questions
Which states had the highest residential kerosene price in 2024?
Indiana and Tennessee share the highest positive value at $30.87 per million Btu. Minnesota is next at $30.75 and Kansas at $30.73.
Which state had the lowest positive residential kerosene price?
Montana is lowest among positive values at $23.63 per million Btu, followed by Colorado at $24.31 and Wyoming at $24.57.
Do the 0.00 entries for District of Columbia and Hawaii mean kerosene was free?
No. EIA’s public tables do not support interpreting those entries as literal zero-dollar household prices, so they are excluded from the positive-price ranking.
Why are state kerosene prices estimated after 2021?
EIA suspended survey EIA-782 after 2021. For 2022 forward, SEDS uses regression models based on historical state kerosene prices and related heating-oil, New York kerosene, and crude-oil price indicators.
Related Articles
Green Map creates custom-edited map images using open geographic data sources such as geoBoundaries, Natural Earth, OpenStreetMap, and government open data. These maps are edited visual materials, not raw data files, and are provided for education, documents, presentations, and graphic reference.