Residential hydrocarbon gas liquids (HGL) prices varied widely across the United States in 2024. The verified EIA SEDS dataset covers all 50 states plus the District of Columbia, for 51 observations in the same year and unit. The average price is $29.27 per million Btu and the median is $28.74. Hawaii is highest at $49.95, while Iowa is lowest at $16.67, creating a spread of $33.28 per million Btu.
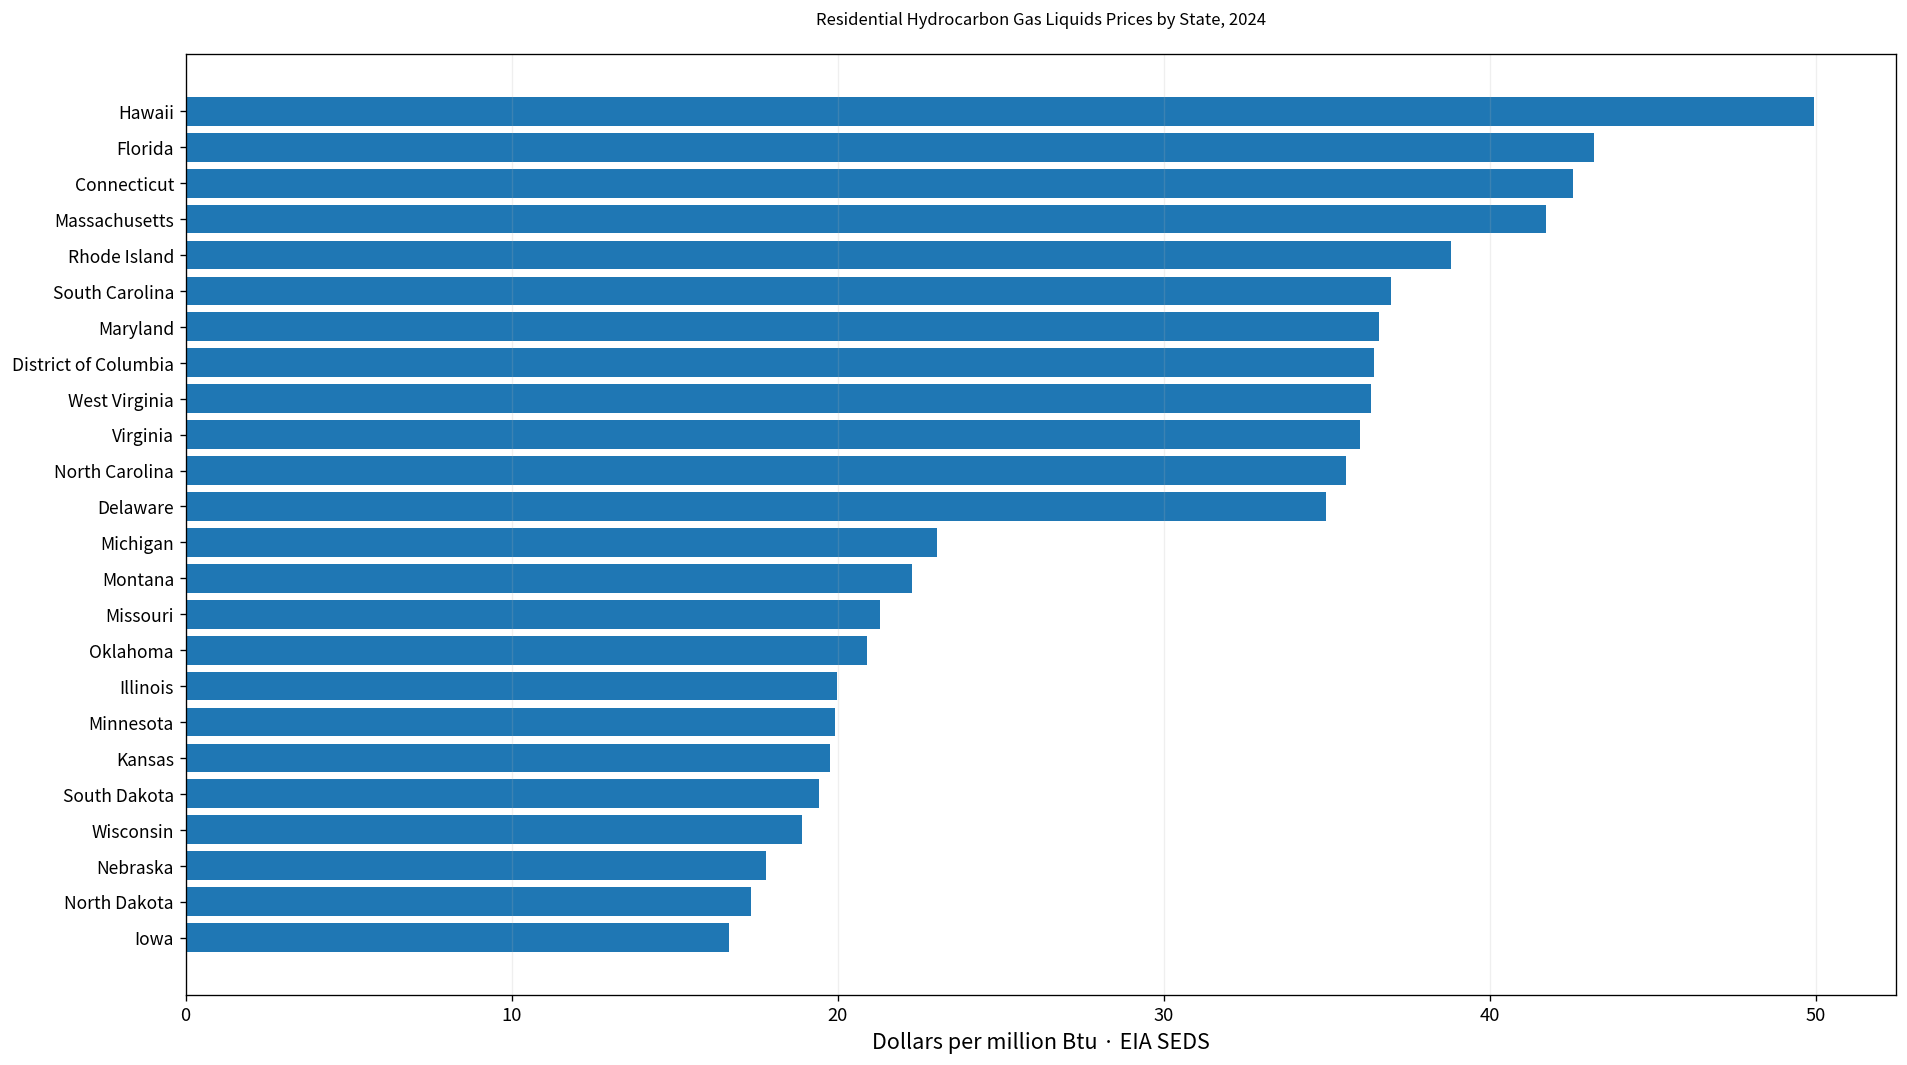
Table of Contents
What the residential HGL price measures
Hydrocarbon gas liquids are a family of liquid hydrocarbons associated with natural-gas processing and petroleum refining. The EIA residential-sector series expresses their price on an energy-content basis. The unit is dollars per million Btu, not dollars per gallon. That distinction matters because an energy-normalized price allows states to be compared on the cost of a common amount of energy rather than on a physical-volume unit.
A million Btu, commonly written MMBtu, is an energy quantity. A higher dollar-per-MMBtu value means a higher price for the same amount of energy. It does not directly tell us a household’s monthly bill. Total household cost also depends on how much fuel is used, equipment efficiency, weather, dwelling characteristics, taxes, contracts, and the mix of other fuels used in the home.
The 2024 median is $28.74 per million Btu
Across the 51 observations, the median is $28.74 per million Btu and the simple average is $29.27. The first quartile is $24.12 and the third quartile is $34.58, which places the middle half of states and D.C. between those two values. 24 observations are above the national simple mean of the state values and 27 are below it.
11 observations are at or above $35 per million Btu, while 10 are at or below $22. Most values sit in the mid-20s through mid-30s, but both tails are clearly separated from the center. The average and median are relatively close, although the upper tail reaches almost $50 per million Btu.
Hawaii is highest at $49.95 per million Btu
Hawaii has the highest 2024 residential HGL price at $49.95 per million Btu. Florida follows at $43.20, then Connecticut at $42.56 and Massachusetts at $41.72. Rhode Island is also above $38, while South Carolina, Maryland, the District of Columbia, West Virginia, Virginia, and North Carolina are in the mid-to-upper $30s. These observations show a large state spread, but the price series alone does not establish why a particular state is high.
| Rank | State/area | 2024 price |
|---|---|---|
| 1 | Hawaii | $49.95/MMBtu |
| 2 | Florida | $43.20/MMBtu |
| 3 | Connecticut | $42.56/MMBtu |
| 4 | Massachusetts | $41.72/MMBtu |
| 5 | Rhode Island | $38.79/MMBtu |
| 6 | South Carolina | $36.97/MMBtu |
| 7 | Maryland | $36.61/MMBtu |
| 8 | District of Columbia | $36.43/MMBtu |
| 9 | West Virginia | $36.34/MMBtu |
| 10 | Virginia | $36.01/MMBtu |
| 11 | North Carolina | $35.57/MMBtu |
| 12 | Delaware | $34.96/MMBtu |
| 13 | New Jersey | $34.80/MMBtu |
| 14 | New York | $34.35/MMBtu |
| 15 | Maine | $34.26/MMBtu |
The ratio between the highest and lowest values is about 3.00 to 1. That demonstrates substantial variation in the energy-normalized price across states. It should not be read as a threefold difference in the average household energy bill, because bills also depend on consumption volume and the role HGLs play in each state’s residential energy mix.
Iowa is lowest at $16.67 per million Btu
Iowa records the lowest price at $16.67 per million Btu, followed by North Dakota at $17.33 and Nebraska at $17.80. Wisconsin, South Dakota, Kansas, Minnesota, and Illinois are all below $20. Oklahoma and Missouri are also near the low end. Several of these lower-priced states are in the central United States, creating a visible geographic pattern in the ranking.
| Low-order position | State/area | 2024 price |
|---|---|---|
| 1 | Iowa | $16.67/MMBtu |
| 2 | North Dakota | $17.33/MMBtu |
| 3 | Nebraska | $17.80/MMBtu |
| 4 | Wisconsin | $18.91/MMBtu |
| 5 | South Dakota | $19.41/MMBtu |
| 6 | Kansas | $19.76/MMBtu |
| 7 | Minnesota | $19.91/MMBtu |
| 8 | Illinois | $19.96/MMBtu |
| 9 | Oklahoma | $20.89/MMBtu |
| 10 | Missouri | $21.30/MMBtu |
| 11 | Montana | $22.28/MMBtu |
| 12 | Michigan | $23.05/MMBtu |
| 13 | Indiana | $24.07/MMBtu |
| 14 | Colorado | $24.16/MMBtu |
| 15 | Wyoming | $24.69/MMBtu |
A geographic pattern should not be turned into a causal explanation without additional evidence. Production proximity, distribution systems, taxes, market structure, seasonal demand, and contractual arrangements could all matter, but those variables are not contained in this dataset. The verified file supports the price comparison itself, not a definitive explanation of each state’s price.
Residential prices should not be substituted for other sectors
EIA reports energy prices and consumption for several end-use sectors. Residential, commercial, industrial, transportation, and electric-power markets can face different purchasing arrangements and distribution channels. The figures in this article are specifically the 2024 residential-sector HGL price observations. They should not be reused as industrial or commercial prices.
Price is also different from consumption. A state with a high price does not necessarily consume more HGLs, and a low price does not prove that households depend heavily on the fuel. Consumption, expenditures, and prices answer different questions. A broader state energy analysis would need the relevant EIA consumption series as well.
Complete ranking for all 51 states and D.C. observations
The table below ranks all 50 states and the District of Columbia from highest to lowest. Because every row refers to 2024 and uses the same unit, there is no mixed-year issue in this package. The dataset is complete for the 51 listed jurisdictions, so no missing value is treated as zero.
| Rank | State/area | Code | Price |
|---|---|---|---|
| 1 | Hawaii | HI | $49.95/MMBtu |
| 2 | Florida | FL | $43.20/MMBtu |
| 3 | Connecticut | CT | $42.56/MMBtu |
| 4 | Massachusetts | MA | $41.72/MMBtu |
| 5 | Rhode Island | RI | $38.79/MMBtu |
| 6 | South Carolina | SC | $36.97/MMBtu |
| 7 | Maryland | MD | $36.61/MMBtu |
| 8 | District of Columbia | DC | $36.43/MMBtu |
| 9 | West Virginia | WV | $36.34/MMBtu |
| 10 | Virginia | VA | $36.01/MMBtu |
| 11 | North Carolina | NC | $35.57/MMBtu |
| 12 | Delaware | DE | $34.96/MMBtu |
| 13 | New Jersey | NJ | $34.80/MMBtu |
| 14 | New York | NY | $34.35/MMBtu |
| 15 | Maine | ME | $34.26/MMBtu |
| 16 | Vermont | VT | $33.00/MMBtu |
| 17 | New Hampshire | NH | $33.00/MMBtu |
| 18 | Alaska | AK | $32.98/MMBtu |
| 19 | Georgia | GA | $32.44/MMBtu |
| 20 | Nevada | NV | $31.51/MMBtu |
| 21 | Arizona | AZ | $31.25/MMBtu |
| 22 | California | CA | $30.89/MMBtu |
| 23 | Louisiana | LA | $30.49/MMBtu |
| 24 | Mississippi | MS | $29.42/MMBtu |
| 25 | Pennsylvania | PA | $28.79/MMBtu |
| 26 | Oregon | OR | $28.74/MMBtu |
| 27 | Texas | TX | $28.63/MMBtu |
| 28 | Ohio | OH | $27.54/MMBtu |
| 29 | Alabama | AL | $27.31/MMBtu |
| 30 | New Mexico | NM | $27.30/MMBtu |
| 31 | Kentucky | KY | $27.15/MMBtu |
| 32 | Idaho | ID | $26.48/MMBtu |
| 33 | Washington | WA | $26.30/MMBtu |
| 34 | Arkansas | AR | $25.93/MMBtu |
| 35 | Tennessee | TN | $25.75/MMBtu |
| 36 | Utah | UT | $25.36/MMBtu |
| 37 | Wyoming | WY | $24.69/MMBtu |
| 38 | Colorado | CO | $24.16/MMBtu |
| 39 | Indiana | IN | $24.07/MMBtu |
| 40 | Michigan | MI | $23.05/MMBtu |
| 41 | Montana | MT | $22.28/MMBtu |
| 42 | Missouri | MO | $21.30/MMBtu |
| 43 | Oklahoma | OK | $20.89/MMBtu |
| 44 | Illinois | IL | $19.96/MMBtu |
| 45 | Minnesota | MN | $19.91/MMBtu |
| 46 | Kansas | KS | $19.76/MMBtu |
| 47 | South Dakota | SD | $19.41/MMBtu |
| 48 | Wisconsin | WI | $18.91/MMBtu |
| 49 | Nebraska | NE | $17.80/MMBtu |
| 50 | North Dakota | ND | $17.33/MMBtu |
| 51 | Iowa | IA | $16.67/MMBtu |
How to interpret the state differences
First, dollars per million Btu is an energy-content price, not a physical-volume retail price. Second, the annual value summarizes the year and does not reproduce monthly or winter peaks. Third, the dataset identifies where prices were high or low but does not isolate the causes of those differences.
Fourth, a high price does not automatically imply a high total household energy cost. Households can use different amounts of HGLs or substitute other fuels. Fifth, a one-year ranking should not be treated as a long-term pattern without checking multiple years. The 2024 values are best understood as a cross-sectional snapshot of state price differences.
Source and calculation
The source is the U.S. Energy Information Administration State Energy Data System (SEDS), using the series identified in the package as residential hydrocarbon gas liquids price. The unit is dollars per million Btu and the reference year is 2024. The mean, median, quartiles, range, ratio, and rankings are calculated directly from the 51 verified observations. No value is imputed and no missing observation is converted to zero.
Frequently Asked Questions
Which state had the highest residential HGL price in 2024?
Hawaii had the highest value at $49.95 per million Btu, followed by Florida and Connecticut.
Which state had the lowest residential HGL price in 2024?
Iowa was lowest at $16.67 per million Btu, followed by North Dakota and Nebraska.
Is dollars per million Btu the same as a price per gallon?
No. Dollars per million Btu is an energy-content price, while a price per gallon is based on physical volume.
Related Articles
Green Map creates custom-edited map images using open geographic data sources such as geoBoundaries, Natural Earth, OpenStreetMap, and government open data. These maps are edited visual materials, not raw data files, and are provided for education, documents, presentations, and graphic reference.