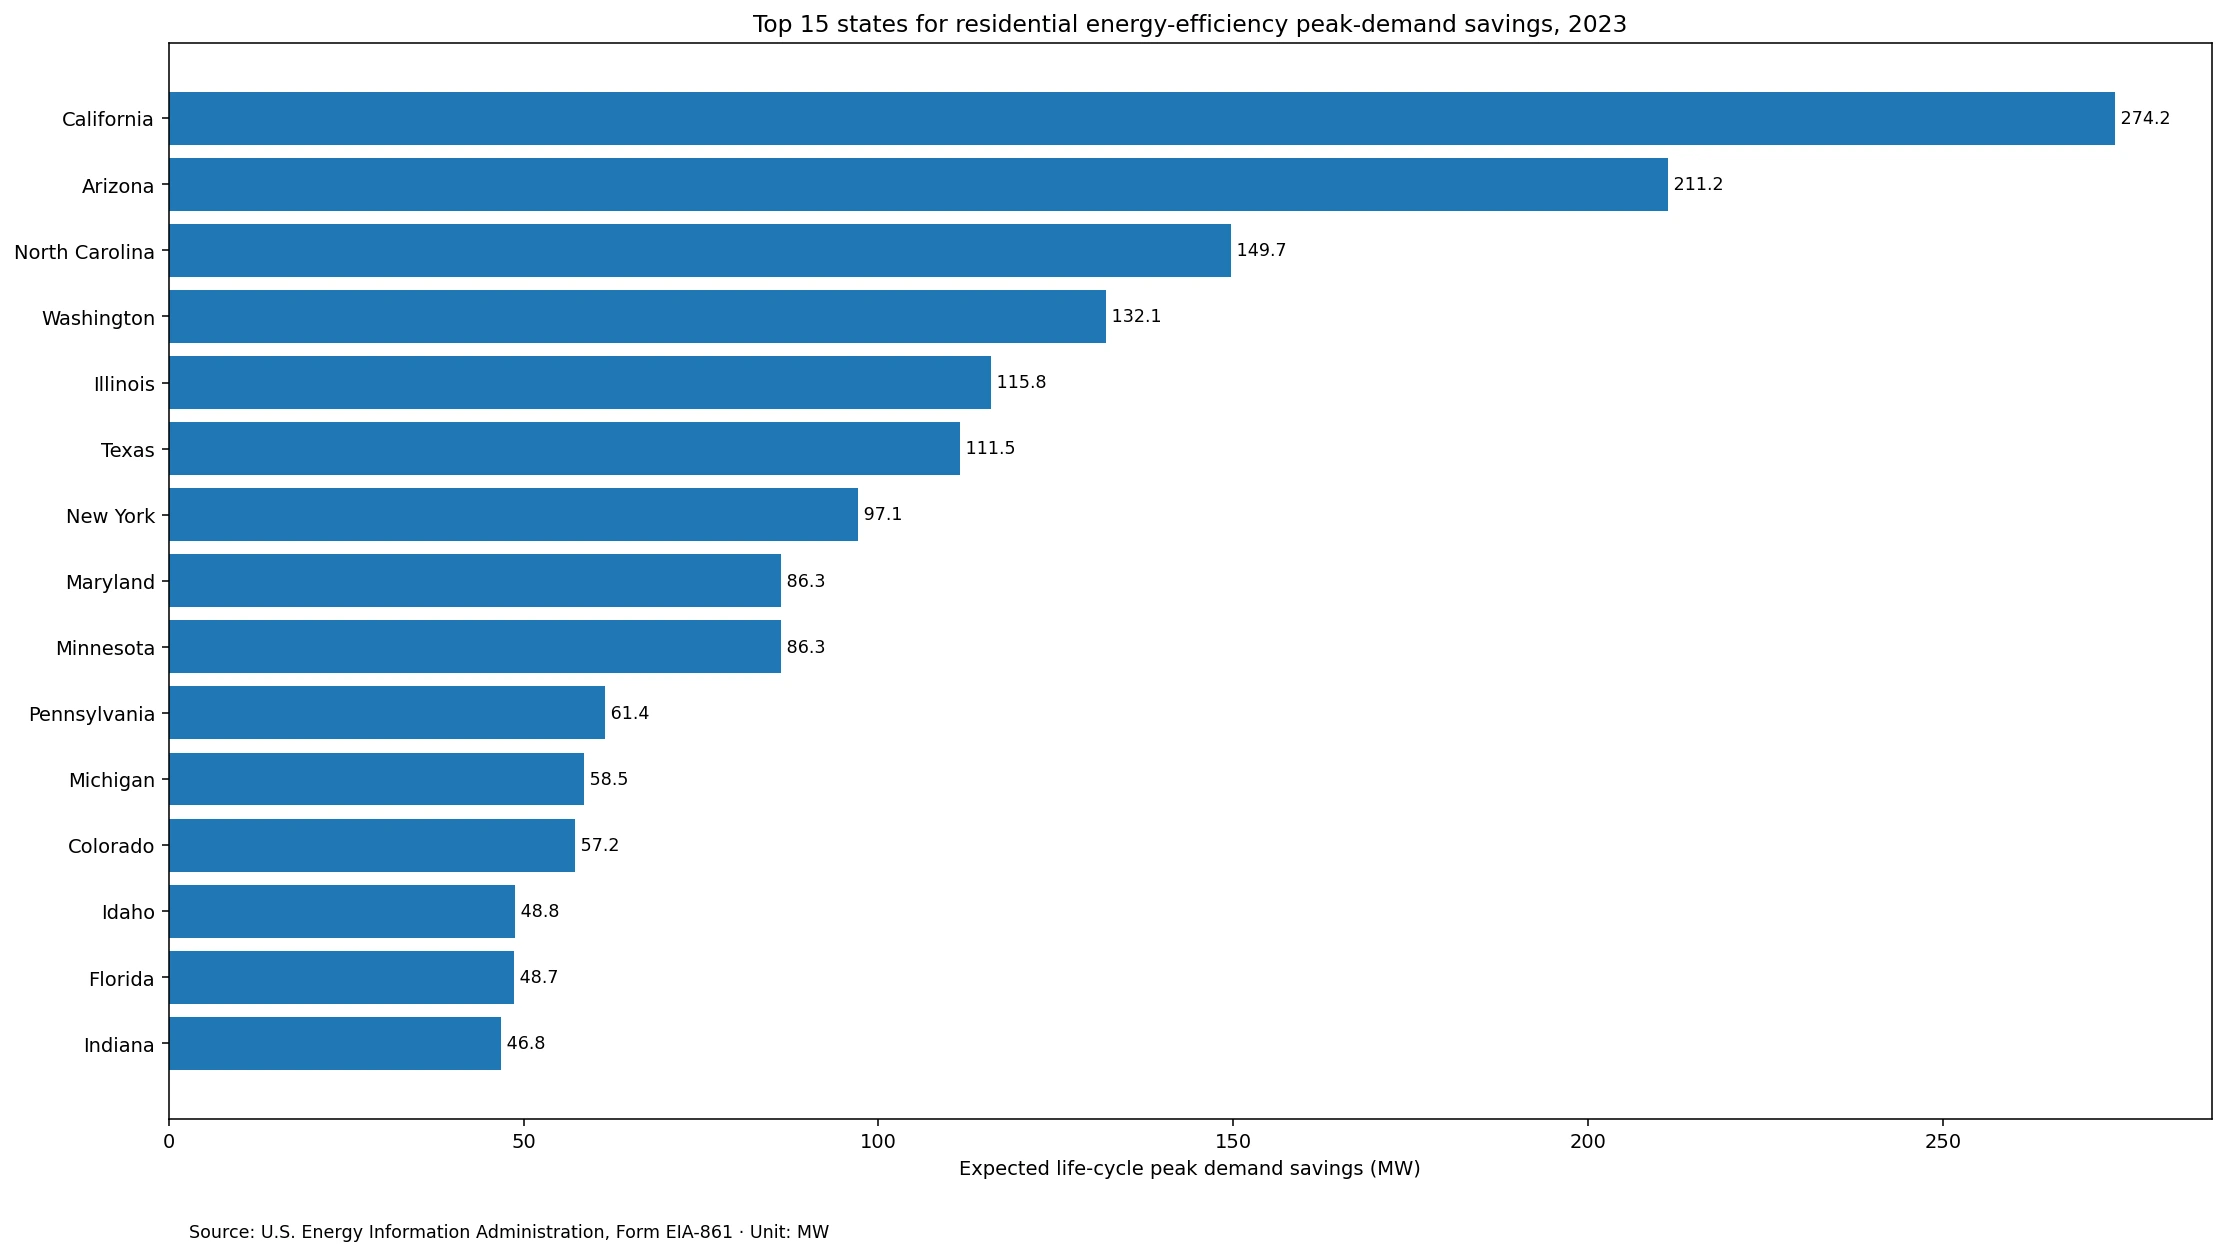
Residential energy-efficiency programs can reduce both electricity use over time and the amount of power demanded during the highest-load periods. In the U.S. Energy Information Administration (EIA) 2023 State Electricity Profiles slice for Residential + Expected Life Cycle of Programs + Peak Demand Savings, California has the largest reported value at 274.2 MW. Arizona follows at 211.2 MW and North Carolina at 149.7 MW. The 50 states and the District of Columbia sum to 2068.5 MW.
The unit is the first key to interpreting the series. Megawatts measure power demand at a point in time; megawatthours measure energy over a period. This is therefore not a ranking of how many MWh households avoided using during 2023. It is a peak-demand measure associated with residential energy-efficiency programs. The time-period facet is Expected Life Cycle of Programs, so the values represent expected peak-demand savings over the program life associated with the 2023 reporting slice.
Table of Contents
Peak-demand reduction answers a different grid question than annual energy savings
Electric systems must be prepared for the hours when demand is highest, not only for average annual consumption. Air-conditioning and heating loads can push system demand sharply upward during extreme-weather periods. A peak-demand-savings metric shows how much power demand an efficiency program is expected to remove from those high-load periods. That can matter for generation adequacy, distribution capacity, and the amount of infrastructure needed to serve a short-lived peak.
Annual energy savings and peak-demand savings can move together, but they are not the same outcome. A measure that saves electricity throughout the year can produce a different peak effect from a measure targeted specifically at cooling or heating loads. The EIA series used here isolates the MW peak-demand dimension. Program costs, participant counts, and MWh energy savings are separate fields.
California and Arizona form the leading pair
California contributes 13.3% of the 51-jurisdiction sum and Arizona contributes 10.2%. North Carolina ranks third at 149.7 MW. Together the top three account for 635.1 MW, or 30.7% of the state-and-District sum.
Washington ranks fourth at 132.1 MW and Illinois fifth at 115.8 MW. The top five account for 42.7% of the sum, the top ten for 64.1%, and the top fifteen for 76.7%. The upper group spans the West, South, Midwest, and Northeast, which makes a single regional explanation inadequate.
The 40.6 MW mean is about twice the 20.0 MW median
The arithmetic mean across 51 jurisdictions is 40.6 MW, while the median is 20.0 MW. The mean is about 2.0 times the median because the largest state values pull the average upward. The first quartile is 4.2 MW and the third quartile is 48.8 MW. That spread shows why the mean alone can make a typical state appear larger than the middle of the actual distribution.
| Peak-demand savings band | Jurisdictions |
|---|---|
| 0 MW | 1 |
| Over 0 to 5 MW | 14 |
| Over 5 to 10 MW | 3 |
| Over 10 to 25 MW | 11 |
| Over 25 to 50 MW | 10 |
| Over 50 to 100 MW | 6 |
| Over 100 MW | 6 |
Alaska is the only jurisdiction with an exact 0 MW observation in this slice. It is a numeric zero rather than a missing record. The zero should not be expanded into the claim that Alaska had no residential energy-efficiency activity. Other EIA fields, including energy savings, reporting-year measures, or program costs, can contain separate observations.
Complete 2023 ranking for all 51 jurisdictions
The table below sorts the 2023 Residential + Expected Life Cycle of Programs + Peak Demand Savings observations from highest to lowest. Shares use the direct 51-row sum of 2068.5 MW as the denominator. No missing value is converted to zero and no observation from another year is substituted.
| Rank | State or jurisdiction | Expected life-cycle peak demand savings (MW) | Share of 51-row sum |
|---|---|---|---|
| 1 | California (CA) | 274.2 | 13.3% |
| 2 | Arizona (AZ) | 211.2 | 10.2% |
| 3 | North Carolina (NC) | 149.7 | 7.2% |
| 4 | Washington (WA) | 132.1 | 6.4% |
| 5 | Illinois (IL) | 115.8 | 5.6% |
| 6 | Texas (TX) | 111.5 | 5.4% |
| 7 | New York (NY) | 97.1 | 4.7% |
| 8 | Maryland (MD) | 86.3 | 4.2% |
| 9 | Minnesota (MN) | 86.3 | 4.2% |
| 10 | Pennsylvania (PA) | 61.4 | 3.0% |
| 11 | Michigan (MI) | 58.5 | 2.8% |
| 12 | Colorado (CO) | 57.2 | 2.8% |
| 13 | Idaho (ID) | 48.8 | 2.4% |
| 14 | Florida (FL) | 48.7 | 2.4% |
| 15 | Indiana (IN) | 46.8 | 2.3% |
| 16 | South Carolina (SC) | 44.5 | 2.2% |
| 17 | New Jersey (NJ) | 43.7 | 2.1% |
| 18 | Nevada (NV) | 37.4 | 1.8% |
| 19 | Massachusetts (MA) | 35.7 | 1.7% |
| 20 | Arkansas (AR) | 30.1 | 1.5% |
| 21 | Missouri (MO) | 27.6 | 1.3% |
| 22 | Oregon (OR) | 25.1 | 1.2% |
| 23 | Utah (UT) | 23.7 | 1.1% |
| 24 | Louisiana (LA) | 21.9 | 1.1% |
| 25 | Virginia (VA) | 20.9 | 1.0% |
| 26 | Wisconsin (WI) | 20.0 | 1.0% |
| 27 | Georgia (GA) | 19.0 | 0.9% |
| 28 | New Mexico (NM) | 17.1 | 0.8% |
| 29 | Alabama (AL) | 14.2 | 0.7% |
| 30 | Oklahoma (OK) | 14.2 | 0.7% |
| 31 | Delaware (DE) | 13.0 | 0.6% |
| 32 | Iowa (IA) | 11.4 | 0.6% |
| 33 | Mississippi (MS) | 10.3 | 0.5% |
| 34 | Connecticut (CT) | 8.5 | 0.4% |
| 35 | Rhode Island (RI) | 5.7 | 0.3% |
| 36 | Maine (ME) | 5.5 | 0.3% |
| 37 | Hawaii (HI) | 4.8 | 0.2% |
| 38 | South Dakota (SD) | 4.5 | 0.2% |
| 39 | Kentucky (KY) | 3.8 | 0.2% |
| 40 | Nebraska (NE) | 3.8 | 0.2% |
| 41 | Ohio (OH) | 3.6 | 0.2% |
| 42 | Tennessee (TN) | 3.0 | 0.1% |
| 43 | New Hampshire (NH) | 2.4 | 0.1% |
| 44 | District of Columbia (DC) | 1.5 | 0.1% |
| 45 | Vermont (VT) | 1.5 | 0.1% |
| 46 | Wyoming (WY) | 1.5 | 0.1% |
| 47 | Montana (MT) | 1.1 | 0.1% |
| 48 | West Virginia (WV) | 1.1 | 0.1% |
| 49 | Kansas (KS) | 0.4 | 0.0% |
| 50 | North Dakota (ND) | 0.4 | 0.0% |
| 51 | Alaska (AK) | 0.0 | 0.0% |
The 51-row sum is within 0.5 MW of EIA’s national residential total
EIA Electric Power Annual Table 10.2 reports 2,069 MW for 2023 Residential Life Cycle Savings – Peak Demand Savings. The direct state-and-District sum is 2068.5 MW, a difference of only 0.5 MW. The national table is displayed as a whole number while the state observations retain one decimal place, so the difference is consistent with rounding.
The same national table reports 3,214 MW for commercial programs, 372 MW for industrial programs, and 0 MW for transportation, producing 5,655 MW across sectors. Those national sector totals provide context, but they should not be assigned to individual states. This article keeps the ranking strictly within the Residential series.
A state can rank differently in MW peak savings and MWh energy savings
Residential efficiency has at least two distinct dimensions in the EIA framework. Energy savings in MWh measure electricity avoided over time. Peak-demand savings in MW measure the reduction in power required during high-demand periods. The same state does not need to occupy the same position in both rankings because the timing of savings matters for peak demand.
That distinction also means this topic is not a duplicate of a state ranking for residential life-cycle energy savings. The sector and reporting year are the same, but the metric identity and unit are different. One series answers how much electricity is expected to be saved over time; the other answers how much peak power demand is expected to be reduced.
Absolute MW savings are not a policy-performance rating
A large absolute peak-demand value can reflect the number of residential customers, participation, the mix of efficiency measures, cooling and heating loads, program scale, and reporting coverage. It does not establish the largest savings per household or the best cost-effectiveness. A normalized performance analysis would require additional denominators such as customer counts, system peak load, electricity sales, participation, and program costs.
- What the dataset can answer: the absolute size, ranking, distribution, and concentration of 2023 expected life-cycle residential peak-demand savings by state.
- What it cannot answer alone: savings per household, savings as a share of system peak load, cost-effectiveness, policy quality, or actual reliability improvement.
- Useful follow-up data: residential customer counts, electricity sales, program costs, MWh energy savings, system peak load, and participation.
Source and calculation method
The state observations come from the U.S. Energy Information Administration State Electricity Profiles energy-efficiency API. The selected slice is annual 2023 data with sector=RES, timePeriod=Expected Life Cycle of Programs, and field=potential-peak-savings. The source unit is megawatts. The national cross-check uses Electric Power Annual Table 10.2.
All 51 state and District codes are unique, every row is dated 2023, and there are no missing numeric observations. There is 1 exact zero. The sum (2068.5 MW), mean (40.6 MW), median (20.0 MW), quartiles, rankings, and cumulative shares are calculated directly from those 51 observations. The representative chart displays the top 15 states, while the full table and statistics use all 51 values.
Main takeaway
California has the largest 2023 reported expected life-cycle residential peak-demand savings at 274.2 MW, followed by Arizona at 211.2 MW and North Carolina at 149.7 MW. The top ten account for 64.1% of the state-and-District sum, and the 40.6 MW mean is about twice the 20.0 MW median. The ranking provides a clear picture of where reported residential peak-demand reductions are largest, but it should remain a MW grid-demand comparison rather than being turned into a ranking of overall efficiency performance.
Frequently Asked Questions
Which state had the largest 2023 residential energy-efficiency peak-demand savings?
California ranked first at 274.2 MW, followed by Arizona at 211.2 MW and North Carolina at 149.7 MW.
Are peak-demand savings in MW the same as energy savings in MWh?
No. MW measures the size of a reduction in power demand during a high-load period, while MWh measures electricity saved over time.
Does Expected Life Cycle of Programs mean savings only during calendar year 2023?
No. The reference year is 2023, but the series represents expected peak-demand savings over the program life cycle.
Does the 51-jurisdiction sum match EIA’s national residential figure?
Almost exactly. The state-and-District sum is 2068.5 MW and EIA's national table reports 2,069 MW, a difference of 0.5 MW.
Related Articles
- Which States Reported the Largest Residential Energy-Efficiency Program Life-Cycle Savings? (2023)
- Which States Reported the Highest Industrial Energy-Efficiency Program Other Costs? (2023)
- Which U.S. States Had the Highest Residential CO₂ Emissions? (2022)
Green Map creates custom-edited map images using open geographic data sources such as geoBoundaries, Natural Earth, OpenStreetMap, and government open data.
These maps are edited visual materials, not raw data files, and are provided for education, documents, presentations, and graphic reference.