Among the 91 countries and separately reported areas with a 2023 observation, the share of adults age 25 and older who had at least some primary education was usually high, but the distribution was far from uniform. UNESCO Institute for Statistics indicator EA.S1T8.AG25T99 has a median of 98.0% and an unweighted mean of 93.0%. Thirty-two observations are reported at 100%, while Burkina Faso is 18.8% and Senegal 38.8%. That combination of many values near the top and a much smaller group of low values makes the mean noticeably lower than the median.
The wording “at least some primary” is essential. This is not the primary-school graduation rate for children in 2023, and it is not the same as an adult indicator requiring completion of primary education. It captures a lower threshold: adults who had some primary education, including those who later reached higher levels. A separate UIS series measures adults who completed at least primary education. Mixing the two would turn two related but distinct questions into one.
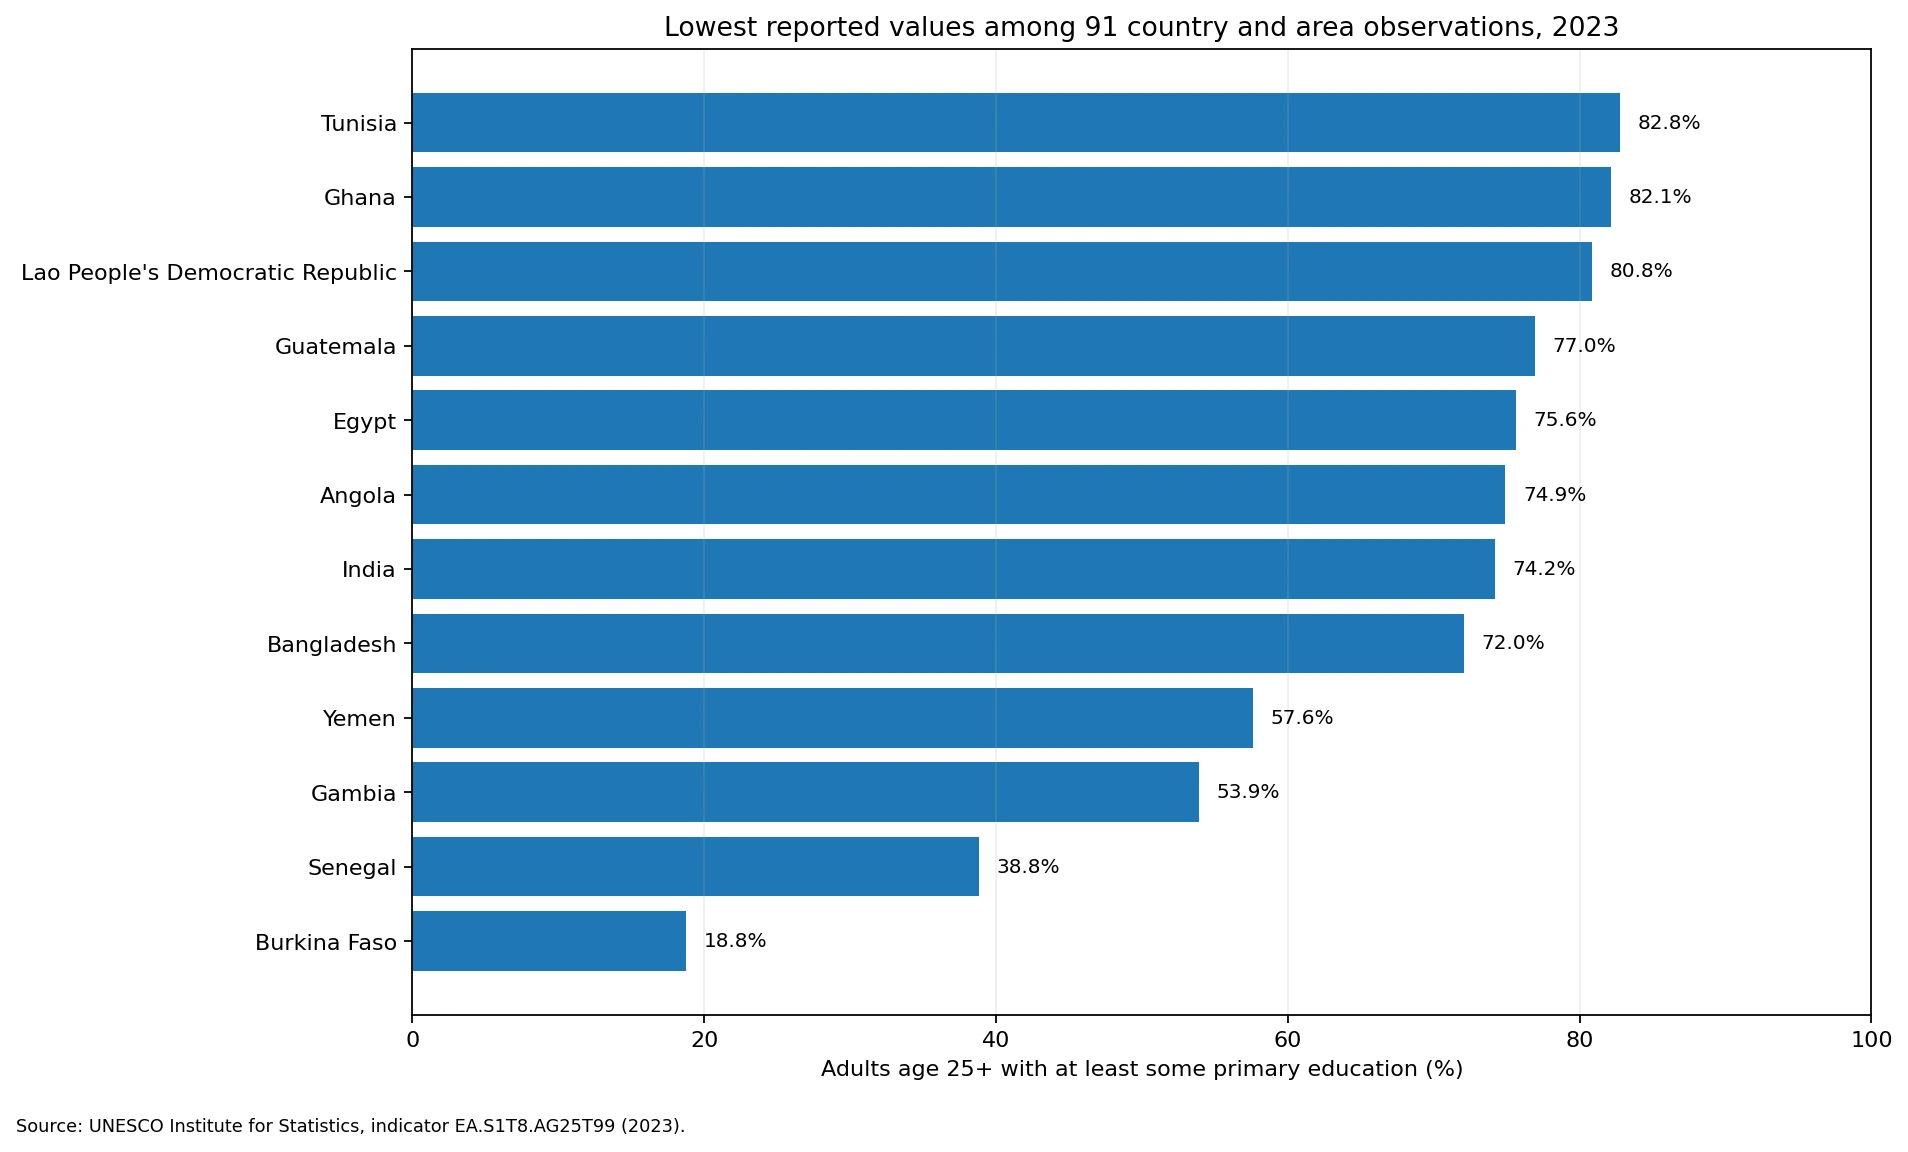
Table of Contents
The median is 98.0%, much higher than the 93.0% mean
The first quartile of the 91 observations is about 93.0%, the median is 98.0%, and the third quartile is 100%. In other words, the middle half of the reported values is packed into roughly the 93% to 100% range. The mean is about five percentage points below the median because a small set of much lower observations stretches the distribution downward. For this dataset, the median and the lower tail describe the pattern better than the mean by itself.
Exactly 32 observations, or 35.2% of the set, are reported at 100%. Forty-one are at least 99%, 64 are at least 95%, 72 are at least 90%, and 82 are at least 80%. That means about 79.1% of the 91 observations are 90% or higher and about 90.1% are at least 80%. A high concentration near the ceiling is not surprising because “some primary education” is a relatively low threshold in the education ladder.
| 2023 share | Countries/areas | Share of 91 |
|---|---|---|
| 100% | 32 | 35.2% |
| 99% to <100% | 9 | 9.9% |
| 95% to <99% | 23 | 25.3% |
| 90% to <95% | 8 | 8.8% |
| 80% to <90% | 10 | 11.0% |
| 50% to <80% | 7 | 7.7% |
| Below 50% | 2 | 2.2% |
The lower end of the distribution creates most of the spread
Burkina Faso has the lowest value in the 2023 set at 18.8%, followed by Senegal at 38.8%. They are the only two observations below 50%. Gambia is 53.9% and Yemen 57.6%. Bangladesh, India, Angola, Egypt and Guatemala are all between about 72% and 77%. Altogether, nine of the 91 observations are below 80%.
Those values summarize the accumulated education experience of the entire population age 25 and older, not the performance of children currently in primary school. A country can make rapid gains in school access for younger generations while its adult indicator changes only gradually, because older cohorts remain in the denominator. The same caution works in the other direction: a high adult value does not establish that learning quality, secondary completion or current school outcomes are equally high.
| Low-end rank | Country | 2023 share |
|---|---|---|
| 1 | Burkina Faso | 18.8% |
| 2 | Senegal | 38.8% |
| 3 | Gambia | 53.9% |
| 4 | Yemen | 57.6% |
| 5 | Bangladesh | 72.0% |
| 6 | India | 74.2% |
| 7 | Angola | 74.9% |
| 8 | Egypt | 75.6% |
| 9 | Guatemala | 77.0% |
| 10 | Lao PDR | 80.8% |
| 11 | Ghana | 82.1% |
| 12 | Tunisia | 82.8% |
A reported 100% is a ceiling on this indicator, not a ranking of education quality
Many observations are reported at exactly 100%, including Australia, Belgium, Canada, Denmark, Finland, France, Germany, Greece, Iceland, Ireland, Israel, Italy, the Netherlands, Norway, Portugal, Spain and Sweden. Those values show that the threshold measured by this indicator is nearly universal in the reported adult population. They do not mean that every education outcome is perfect or that countries at 100% can be meaningfully ordered above those at 99.9%.
Small differences near the ceiling can reflect survey precision, rounding, sampling, response patterns and how national qualifications are mapped to international education levels. A 100.0% observation is therefore best read as a reported ceiling for this particular measure. Questions about literacy, numeracy, learning proficiency, secondary attainment, tertiary attainment or educational inequality require other indicators with higher or different thresholds.
“Some primary” and “completed primary or higher” answer different questions
Two UIS indicator codes make the distinction clear. EA.S1T8.AG25T99 is the series used here and represents adults age 25+ with at least some primary education. EA.1T8.AG25T99 uses a higher threshold: adults who completed at least primary education. The extra “S” in the first code is not a cosmetic label. It marks a broader group because adults with some primary schooling can be included even if they did not finish the primary level.
For the same country and year, the “some primary” percentage can therefore be equal to or higher than the primary-completion threshold. An adult who entered primary school but left before completion can satisfy the first measure but not the second. The lower-threshold indicator is useful for asking how broadly any primary-school exposure reached the adult population; the completion-based indicator is better for asking how widely a minimum completed credential was achieved.
Near the top of the distribution, tiny percentage-point gaps carry limited information
Countries around the median are tightly clustered. Indonesia is 98.0%, the Republic of Korea 97.7%, the United Arab Emirates 97.7%, Brunei Darussalam 97.7% and Kyrgyzstan 99.0%. The United States is 99.7%, while many other observations are reported at 100%. At these levels, a one- or two-point difference should not be treated as a comprehensive score of national education performance. The measure is primarily telling us that exposure to at least some primary education is close to universal for most of these adult populations.
The lower end is more informative for identifying large gaps in this particular threshold. The distance between 18.8% and 38.8% is more than 20 percentage points, and several observations sit between 50% and 80%. That is where the country distribution changes most visibly. Even there, however, the indicator is descriptive rather than causal: it does not tell us whether a low value is driven by historical school access, conflict, geography, household resources, cohort differences or another mechanism.
The age-25-plus denominator carries decades of education history
The age range is one reason this measure should not be confused with a current school-system rate. A 25-year-old and an adult in their seventies can both be in the denominator. The national percentage therefore combines education histories from multiple generations. If younger cohorts recently gained much broader access to primary school, their improvement enters the adult stock gradually rather than replacing the experiences of older cohorts immediately.
This also means that short-run year-to-year changes need careful interpretation. Adult educational attainment and exposure tend to move with demographic replacement and long-term education expansion. For questions about what happened to students this year, indicators such as enrolment, completion, out-of-school rates or learning assessments are more direct. The 2023 value here is better understood as a snapshot of how much basic schooling experience had accumulated in the adult population by that year.
Coverage and classification differences matter in cross-country comparisons
The 91 observations do not represent every country in the world. Rankings in this analysis therefore describe position within the countries and areas that have a 2023 value in this extract. Missing countries are not assigned zero, because “no reported value” and “0% of adults” are entirely different statements. Coverage is a property of the dataset and must remain separate from the value itself.
UIS uses the International Standard Classification of Education to improve comparability, but it also cautions that national degrees and qualifications are not always mapped to ISCED levels in exactly the same way. Census and household-survey methods can differ as well. Educational-attainment measures describe levels reached or completed; they do not directly measure learning quality. For country comparisons, the definition, age group, reference year and reporting coverage should therefore travel with the percentage.
Data source and calculation
The country values come from UNESCO Institute for Statistics indicator EA.S1T8.AG25T99 for 2023. The unit is the percentage of the population age 25 and older, both sexes, with at least some primary education. The mean, median, quartiles, threshold counts and bottom ranking above were calculated from the 91 reported observations with equal weight for each country or area. The 93.0% mean is therefore not a population-weighted world average.
UIS educational-attainment statistics are generally derived from population censuses and household or labour-force surveys and organized using ISCED categories. They are useful for describing the education stock accumulated by adults, but they do not substitute for current completion rates or direct measures of learning. Keeping those boundaries clear is especially important for a low threshold such as “at least some primary,” where many countries naturally cluster close to 100%.
Frequently Asked Questions
Is this the 2023 primary-school graduation rate?
No. It is the cumulative share of adults age 25+ who had at least some primary education, not the completion rate of children leaving primary school in 2023.
Does “some primary” mean primary education was completed?
No. It is a lower threshold than completed primary education. Adults can be counted after receiving some primary schooling even if they did not complete the level.
Does a reported value of 100% mean the country has the best education system?
No. It means this low attainment threshold is reported as universal or nearly universal. It does not measure learning quality, secondary completion or tertiary attainment.
Is the 93.0% mean a world-population average?
No. It is the unweighted mean of the 91 reported country and area observations, with each observation counted equally regardless of population size.
Related Articles
- How many rural adults had at least some primary education in 2023?
- Where were gender gaps in at-least-some-primary attainment largest in 2023?
- How common was primary-or-higher attainment among adults age 25+ in 2023?
Green Map creates custom-edited map images using open geographic data sources such as geoBoundaries, Natural Earth, OpenStreetMap, and government open data.
These maps are edited visual materials, not raw data files, and are provided for education, documents, presentations, and graphic reference.