U.S. Energy Information Administration State Energy Data System data report 2024 commercial-sector kerosene prices for all 50 states plus the District of Columbia. The unit is dollars per million Btu rather than dollars per gallon. The median across the 51 jurisdictions is $29.43/MMBtu. Indiana and Tennessee share the highest value at $30.87/MMBtu, while Hawaii is recorded at $0.00/MMBtu and is preserved as a reported zero rather than converted to missing.
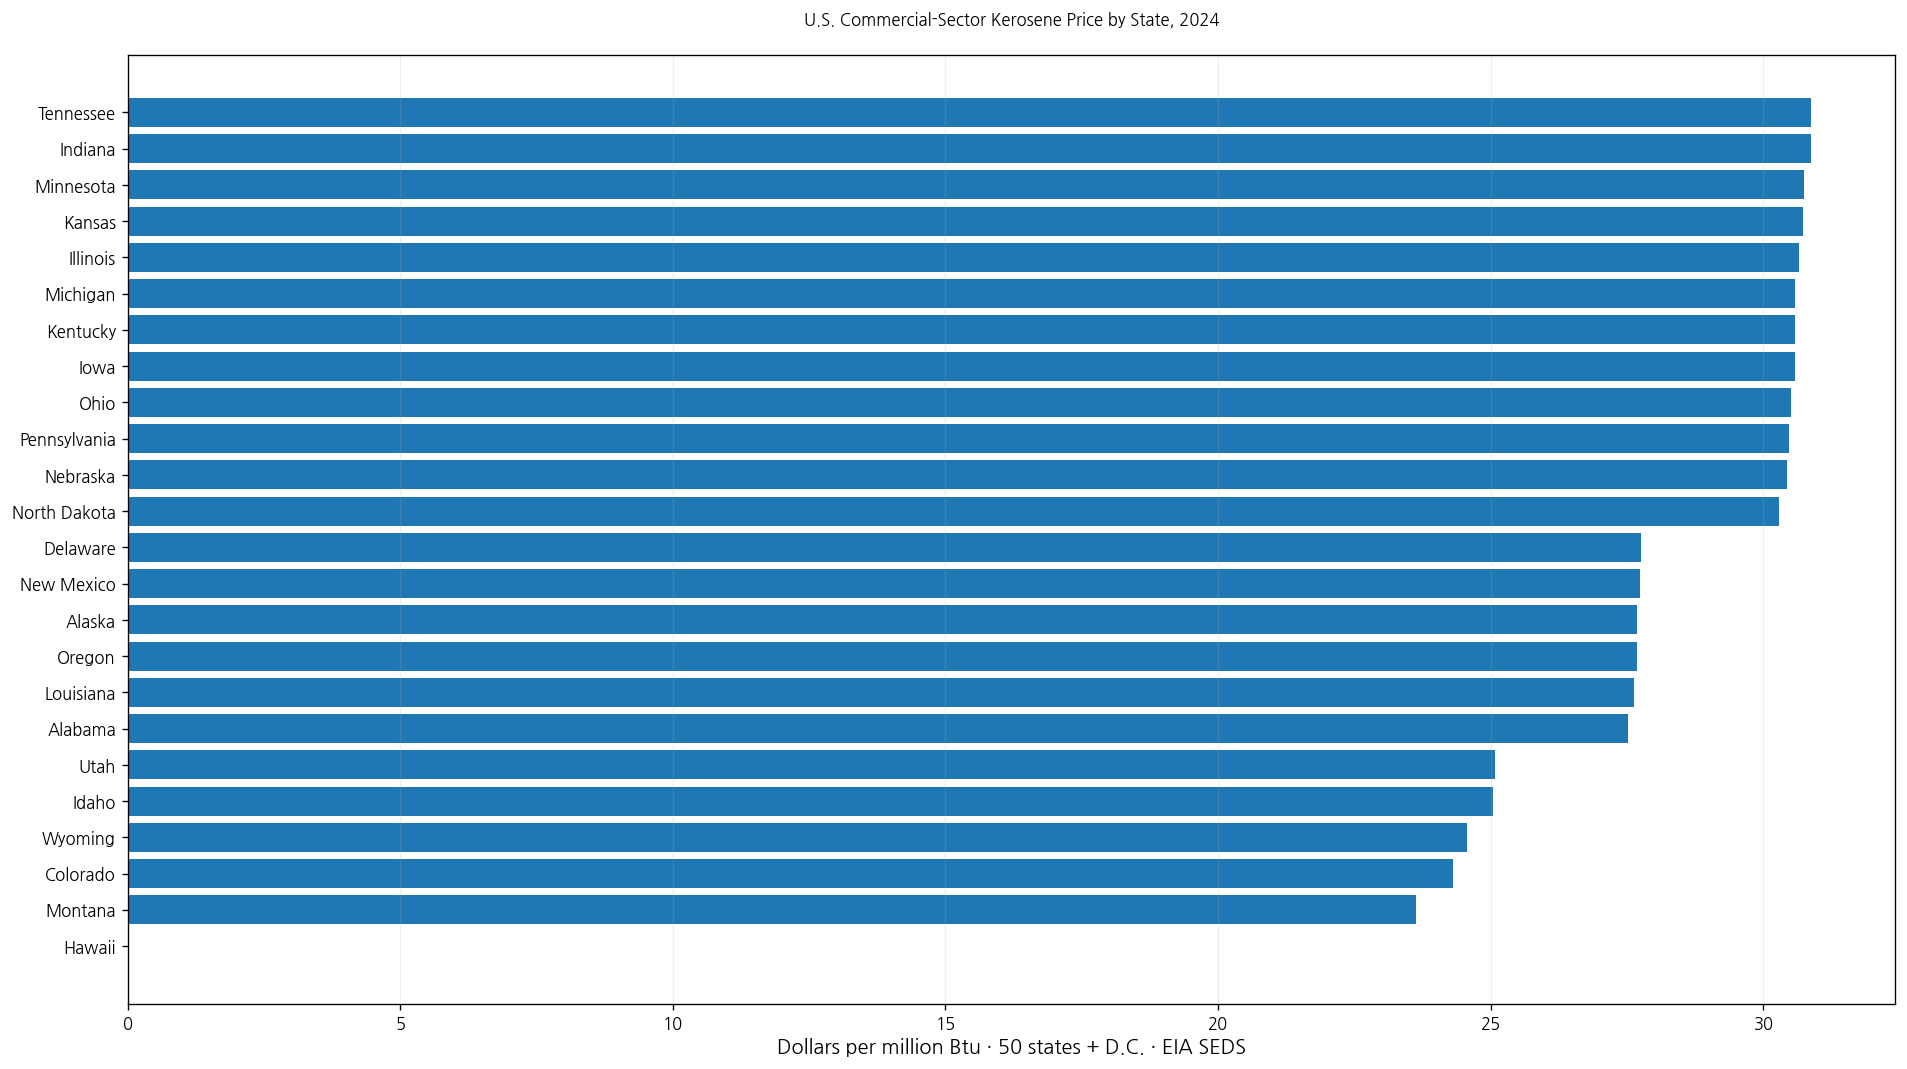
Table of Contents
What the commercial-sector kerosene price measures
This indicator reports the energy-basis price of kerosene used in the commercial sector. Commercial activity is distinct from residential and industrial use, so the series should not be generalized to households or all customers in a state.
The product definition also matters. Kerosene is one petroleum product category, not a synonym for gasoline or every distillate fuel product.
Dollars per million Btu is not dollars per gallon
MMBtu means one million British thermal units. Gallons measure physical volume, while Btu measures energy content. A dollars-per-MMBtu price tells us how much one million Btu of energy costs.
Indiana’s $30.87/MMBtu therefore does not mean kerosene cost $30.87 per gallon. Converting to a volume price would require the appropriate heat-content relationship and consistent product definition.
The 2024 median is $29.43/MMBtu
The median across the 51 jurisdictions is $29.43/MMBtu. The first quartile is $27.98/MMBtu and the third quartile $30.22/MMBtu, placing the middle half roughly between $27.98 and $30.22/MMBtu.
16 jurisdictions are at or above $30/MMBtu and 28 are at or above $29. Among positive observations, 12 are below $28.
The reported zero pulls the arithmetic mean down
The simple mean across all 51 rows is $28.29/MMBtu. Excluding only Hawaii’s reported zero, the mean across the 50 positive observations is $28.85/MMBtu.
The zero is not deleted or reclassified as missing. Presenting both figures and the median makes the influence of that single extreme value transparent.
Indiana and Tennessee are highest at $30.87/MMBtu
Indiana and Tennessee both record $30.87/MMBtu. Minnesota follows at $30.75, Kansas at $30.73, Illinois at $30.65, while Iowa, Kentucky, and Michigan each record $30.58.
| 2024 rank | State/jurisdiction | Commercial-sector kerosene price |
|---|---|---|
| 1 | Indiana | $30.87/MMBtu |
| 2 | Tennessee | $30.87/MMBtu |
| 3 | Minnesota | $30.75/MMBtu |
| 4 | Kansas | $30.73/MMBtu |
| 5 | Illinois | $30.65/MMBtu |
| 6 | Iowa | $30.58/MMBtu |
| 7 | Kentucky | $30.58/MMBtu |
| 8 | Michigan | $30.58/MMBtu |
| 9 | Ohio | $30.51/MMBtu |
| 10 | Pennsylvania | $30.47/MMBtu |
| 11 | Nebraska | $30.44/MMBtu |
| 12 | North Dakota | $30.29/MMBtu |
| 13 | Wisconsin | $30.29/MMBtu |
| 14 | Oklahoma | $30.15/MMBtu |
| 15 | Missouri | $30.07/MMBtu |
High placement indicates a relatively high energy-basis kerosene price in the commercial sector. The data do not identify one cause. Supply conditions, transport, taxes and fees, contracting practices, and local demand may all matter.
Hawaii’s $0.00 is a reported value, not missing data
Hawaii is recorded at $0.00/MMBtu. Because the source file contains an actual numeric zero, the observation is preserved rather than replaced with a blank or imputed value.
At the same time, the series alone does not prove that commercial kerosene was literally free. The reason for the zero cannot be established from this one dataset, so the article limits interpretation to the reported value and its statistical effect.
Montana is the lowest positive observation
Among positive values, Montana is lowest at $23.63/MMBtu, followed by Colorado at $24.31, Wyoming at $24.57, Idaho at $25.05, and Utah at $25.07.
| Low-order position | State/jurisdiction | Commercial-sector kerosene price |
|---|---|---|
| 1 | Hawaii | $0.00/MMBtu |
| 2 | Montana | $23.63/MMBtu |
| 3 | Colorado | $24.31/MMBtu |
| 4 | Wyoming | $24.57/MMBtu |
| 5 | Idaho | $25.05/MMBtu |
| 6 | Utah | $25.07/MMBtu |
| 7 | Alabama | $27.51/MMBtu |
| 8 | Louisiana | $27.63/MMBtu |
| 9 | Alaska | $27.69/MMBtu |
| 10 | Oregon | $27.69/MMBtu |
| 11 | New Mexico | $27.74/MMBtu |
| 12 | Delaware | $27.76/MMBtu |
| 13 | New Hampshire | $27.88/MMBtu |
| 14 | Georgia | $28.07/MMBtu |
| 15 | Texas | $28.11/MMBtu |
The spread between the highest and lowest positive observations is $7.24/MMBtu. Treating Hawaii separately helps describe the positive-price distribution without discarding the reported zero.
Kerosene and distillate fuel oil are not the same series
Kerosene belongs to the broader family of petroleum products, while distillate fuel oil is a different EIA product grouping. The two can have separate price, consumption, and heat-content series.
A result from a distillate-fuel series should therefore not be substituted for a kerosene result even when both are expressed in Btu-based units.
Price and heat content answer different questions
Heat content measures the energy contained in a physical quantity of fuel. Price measures the money paid per unit of energy or volume, depending on the series.
A heat-content series expressed in MMBtu per barrel is a physical measure, whereas this dollars-per-MMBtu series is an economic measure.
Commercial and residential kerosene prices can differ
Residential users and commercial users can face different purchasing patterns, delivery arrangements, quantities, and contracts. The same state and year can therefore produce different sector-specific prices.
Any comparison should align product, sector, year, and unit before drawing conclusions.
A high price does not necessarily mean high total spending
This series reports a unit price. Total commercial kerosene expenditure depends on how much kerosene is actually consumed.
A state with a high price but almost no consumption can spend less in total than a state with a lower price and much larger consumption.
All 51 jurisdictions are aligned to 2024
Every state and the District of Columbia has a 2024 numeric value in the supplied data. There are no missing rows, and one row is a reported zero.
The same-year coverage supports direct cross-state comparison. It does not establish whether prices were rising or falling over time.
One year does not establish a trend
The 2024 snapshot identifies relatively high and low state prices at that point in time. A trend requires the same kerosene commercial-sector series for multiple years.
Year-over-year analysis should keep the product, sector, and dollars-per-MMBtu unit constant.
The simple state mean is not necessarily the official U.S. average
The $28.29/MMBtu arithmetic mean gives each of the 51 jurisdictions equal weight. Commercial kerosene consumption can differ sharply across states, so it should not be assumed to equal an official EIA U.S. aggregate price.
A national average requires appropriate consumption weighting and the dedicated EIA national series.
Complete 2024 state list
The table below lists all 50 states and the District of Columbia alphabetically. Every row is from 2024 and the unit is dollars per million Btu.
| State/jurisdiction | Code | Year | Commercial-sector kerosene price |
|---|---|---|---|
| Alabama | AL | 2024 | $27.51/MMBtu |
| Alaska | AK | 2024 | $27.69/MMBtu |
| Arizona | AZ | 2024 | $29.24/MMBtu |
| Arkansas | AR | 2024 | $28.17/MMBtu |
| California | CA | 2024 | $29.70/MMBtu |
| Colorado | CO | 2024 | $24.31/MMBtu |
| Connecticut | CT | 2024 | $29.65/MMBtu |
| Delaware | DE | 2024 | $27.76/MMBtu |
| District of Columbia | DC | 2024 | $29.43/MMBtu |
| Florida | FL | 2024 | $28.61/MMBtu |
| Georgia | GA | 2024 | $28.07/MMBtu |
| Hawaii | HI | 2024 | $0.00/MMBtu |
| Idaho | ID | 2024 | $25.05/MMBtu |
| Illinois | IL | 2024 | $30.65/MMBtu |
| Indiana | IN | 2024 | $30.87/MMBtu |
| Iowa | IA | 2024 | $30.58/MMBtu |
| Kansas | KS | 2024 | $30.73/MMBtu |
| Kentucky | KY | 2024 | $30.58/MMBtu |
| Louisiana | LA | 2024 | $27.63/MMBtu |
| Maine | ME | 2024 | $29.42/MMBtu |
| Maryland | MD | 2024 | $29.43/MMBtu |
| Massachusetts | MA | 2024 | $29.46/MMBtu |
| Michigan | MI | 2024 | $30.58/MMBtu |
| Minnesota | MN | 2024 | $30.75/MMBtu |
| Mississippi | MS | 2024 | $28.31/MMBtu |
| Missouri | MO | 2024 | $30.07/MMBtu |
| Montana | MT | 2024 | $23.63/MMBtu |
| Nebraska | NE | 2024 | $30.44/MMBtu |
| Nevada | NV | 2024 | $29.59/MMBtu |
| New Hampshire | NH | 2024 | $27.88/MMBtu |
| New Jersey | NJ | 2024 | $29.60/MMBtu |
| New Mexico | NM | 2024 | $27.74/MMBtu |
| New York | NY | 2024 | $28.69/MMBtu |
| North Carolina | NC | 2024 | $28.28/MMBtu |
| North Dakota | ND | 2024 | $30.29/MMBtu |
| Ohio | OH | 2024 | $30.51/MMBtu |
| Oklahoma | OK | 2024 | $30.15/MMBtu |
| Oregon | OR | 2024 | $27.69/MMBtu |
| Pennsylvania | PA | 2024 | $30.47/MMBtu |
| Rhode Island | RI | 2024 | $29.83/MMBtu |
| South Carolina | SC | 2024 | $28.61/MMBtu |
| South Dakota | SD | 2024 | $30.06/MMBtu |
| Tennessee | TN | 2024 | $30.87/MMBtu |
| Texas | TX | 2024 | $28.11/MMBtu |
| Utah | UT | 2024 | $25.07/MMBtu |
| Vermont | VT | 2024 | $29.56/MMBtu |
| Virginia | VA | 2024 | $28.42/MMBtu |
| Washington | WA | 2024 | $29.49/MMBtu |
| West Virginia | WV | 2024 | $28.61/MMBtu |
| Wisconsin | WI | 2024 | $30.29/MMBtu |
| Wyoming | WY | 2024 | $24.57/MMBtu |
How to interpret the comparison
First, the unit is dollars per million Btu rather than dollars per gallon. Second, the series applies specifically to commercial-sector kerosene. Third, Hawaii’s zero is preserved as a reported value rather than treated as missing. Fourth, its cause is not inferred without additional evidence.
Fifth, kerosene should not be conflated with distillate fuel oil. Sixth, price is different from heat content, consumption, and total expenditure. Seventh, same-year coverage supports cross-state comparison, while trends require more years.
Source and calculation
The source is the U.S. Energy Information Administration State Energy Data System (SEDS), indicator BULK_35EEC49005BFA3DB4CCBF38715F3B007. Statistics and rankings use all 51 official 2024 observations. The positive-only mean is shown as a supplemental statistic to make the effect of Hawaii’s reported zero explicit.
Frequently Asked Questions
Is the commercial kerosene price reported per gallon?
No. The unit is dollars per million Btu, an energy-basis price.
Which states have the highest 2024 value?
Indiana and Tennessee share the highest value at $30.87/MMBtu.
Should Hawaii’s $0.00 be treated as missing?
No. It is a reported numeric zero in the supplied data and is preserved as such, although the reason for the zero is not inferred.
Related Articles
Green Map creates custom-edited map images using open geographic data sources such as geoBoundaries, Natural Earth, OpenStreetMap, and government open data. These maps are edited visual materials, not raw data files, and are provided for education, documents, presentations, and graphic reference.