Fugitive nitrous oxide emissions from the energy sector were highly uneven across countries and economies in 2024. In the World Bank indicator EN.GHG.N2O.FE.MT.CE.AR5, China recorded the largest observation at 0.9269 million tonnes of CO₂ equivalent, followed by Brazil at 0.7769 Mt CO₂e. The United States ranked third at 0.3089 Mt CO₂e. These figures do not represent total national greenhouse-gas emissions. They refer to N₂O from a specific fugitive-emissions category within energy, so they should not be read as a general ranking of national climate impact, fossil-fuel use, or overall energy-sector emissions.
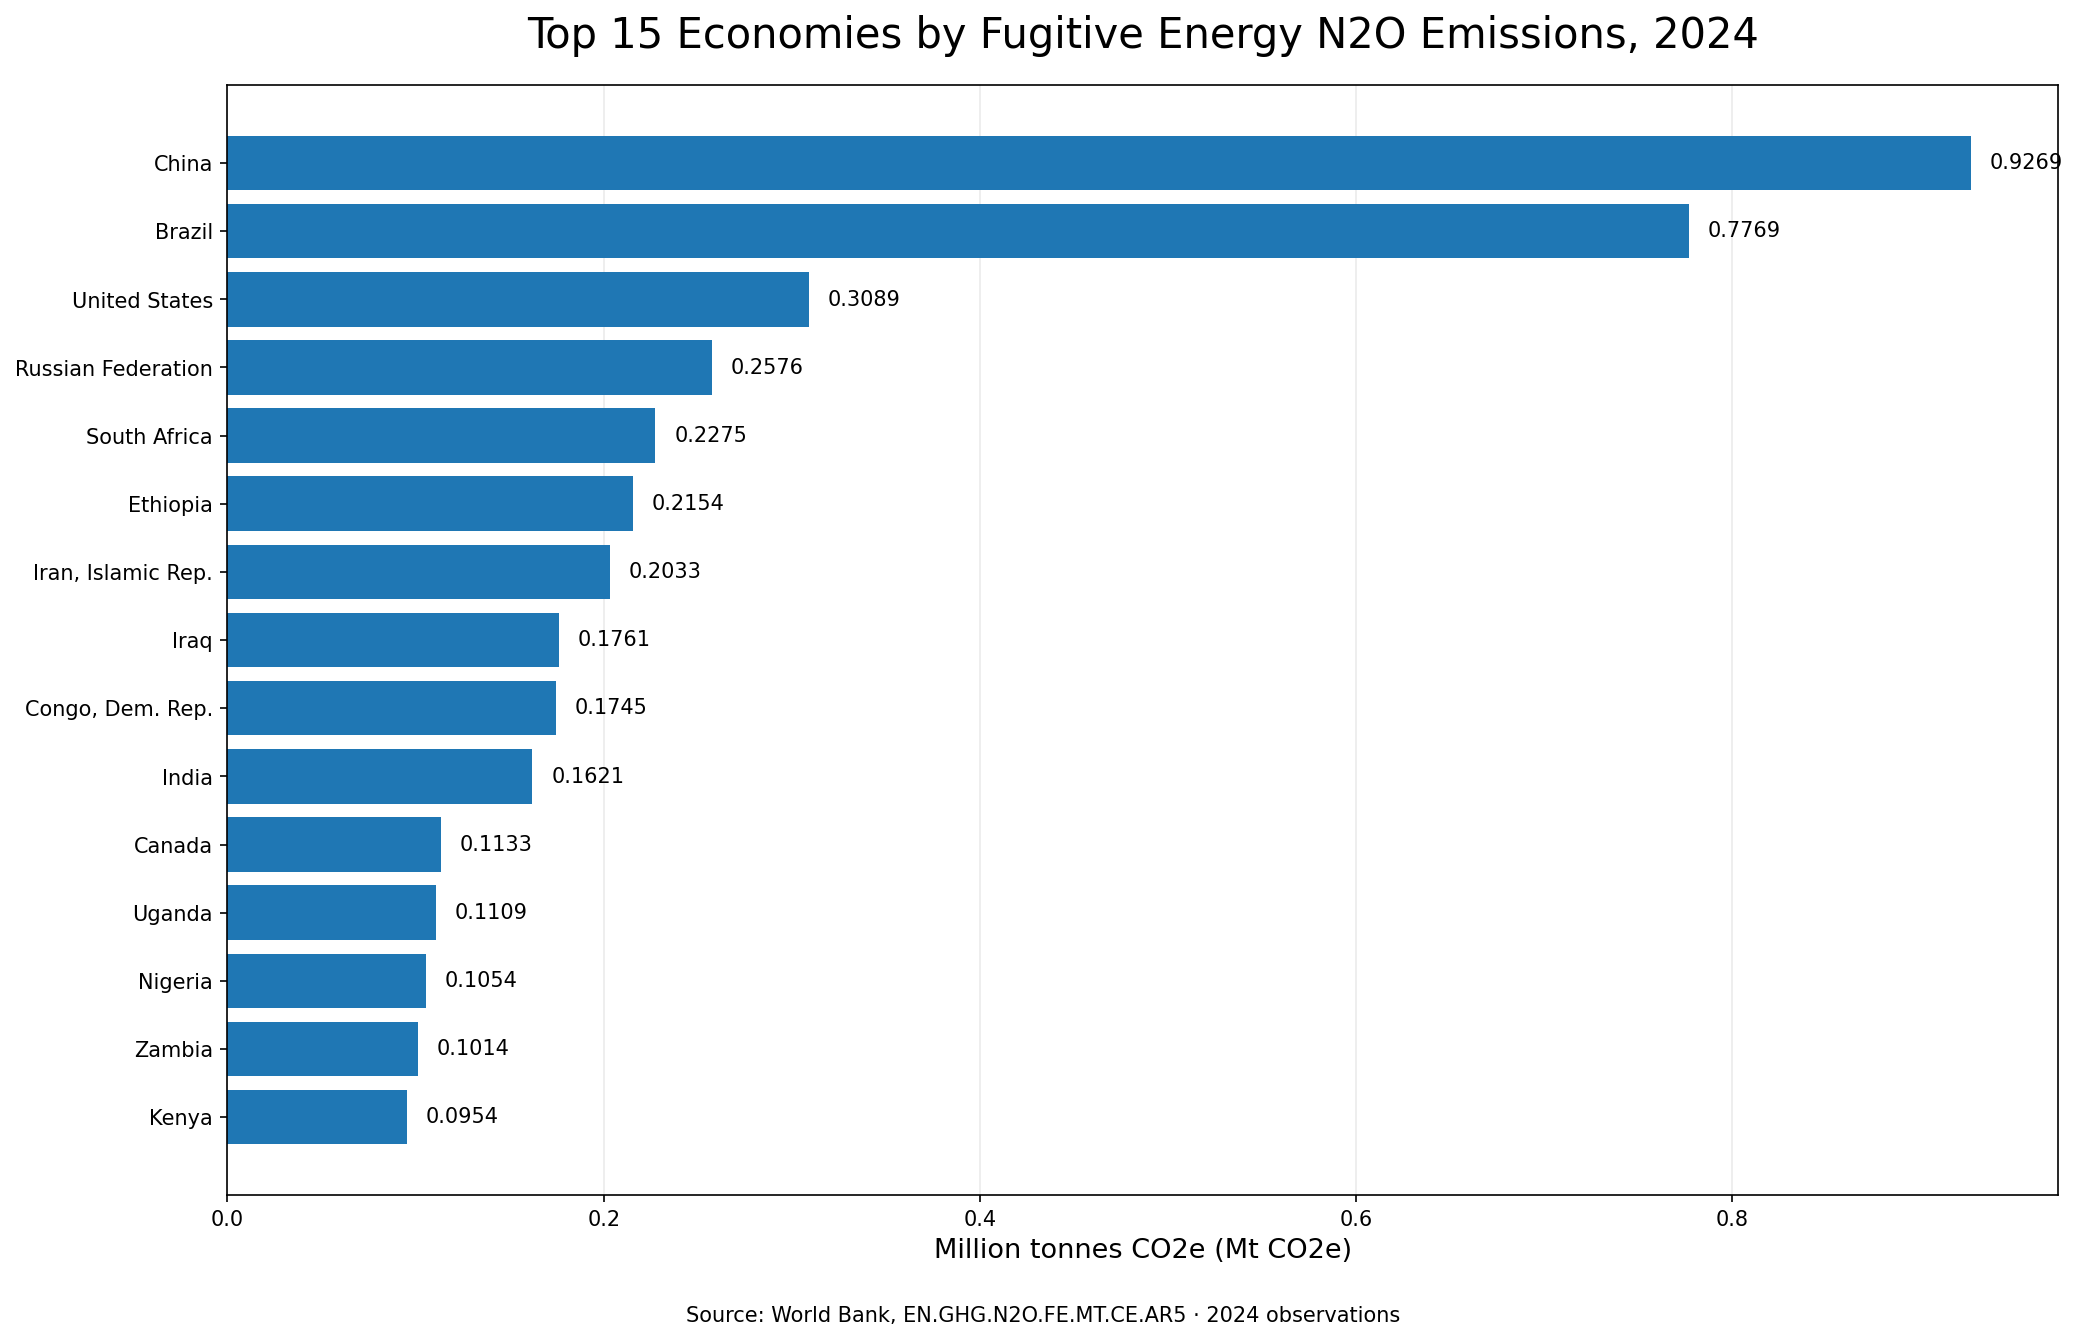
Table of Contents
What the indicator measures
Nitrous oxide is a greenhouse gas, and the World Bank series reports its annual emissions from fugitive emissions associated with the energy sector. The value is standardized in carbon-dioxide-equivalent terms using global-warming-potential factors from the IPCC Fifth Assessment Report. A figure of 0.10 Mt CO₂e therefore means that the estimated warming effect of the reported N₂O emissions has been converted to an equivalent amount of CO₂ under that convention. It is not the physical mass of N₂O itself, and it should not be converted back to tonnes of N₂O without the appropriate factor and methodological context.
The source description identifies fugitive and related energy-industry categories, including solid fuels, oil and natural gas, and certain petroleum-refining or fuel-manufacturing activities. That scope matters because fugitive emissions are distinct from the emissions created when fuels are finally burned in power plants, vehicles, buildings, or industrial equipment. A country can have a large energy system yet a very different value in this particular series depending on the structure and reporting of the activities covered. The indicator is best treated as one narrowly defined component of a wider greenhouse-gas inventory.
The 2024 distribution was strongly concentrated
The 187 numeric observations sum to 5.9347 Mt CO₂e. This is the sum of reported values in the comparison set, not a complete official world total, because 30 master-list economies had no 2024 numeric observation. Even with that limitation, concentration within the reported set is clear. China and Brazil together accounted for 28.7% of the 187-value sum. Adding the United States raised the top-three share to 33.9%. The top 10 observations accounted for 57.8%, and the top 20 accounted for 73.2%.
The simple mean was 0.0317 Mt CO₂e, while the median was only 0.0044 Mt CO₂e. That large gap is a sign of a heavily right-skewed distribution: many economies reported small values, while a limited number of large observations pulled the average upward. The 90th percentile was approximately 0.0721 Mt CO₂e and the 95th percentile about 0.1475 Mt CO₂e. For a dataset shaped this way, the mean alone can give a misleading impression of what a typical country looks like. Median, percentile position, and concentration shares provide a more complete picture.
China and Brazil were well ahead of the rest
China ranked first at 0.9269 Mt CO₂e and Brazil second at 0.7769 Mt CO₂e. The difference between them was 0.1500 Mt CO₂e. The United States, at 0.3089 Mt CO₂e, was less than half the Brazilian value. The next group consisted of the Russian Federation at 0.2576, South Africa at 0.2275, Ethiopia at 0.2154, Iran at 0.2033, Iraq at 0.1761, the Democratic Republic of the Congo at 0.1745, and India at 0.1621 Mt CO₂e. The top 10 therefore spanned several continents and very different energy systems.
That geographic diversity is important because the ranking cannot be reduced to a single regional explanation. Absolute fugitive N₂O emissions may be associated with the scale and composition of fuel extraction, processing, refining, and other covered activities, but this dataset does not provide a causal decomposition. It also does not normalize for population, GDP, total energy production, oil and gas output, or the size of the industrial economy. The ranking identifies where the reported absolute values are large; it does not by itself measure efficiency, regulatory performance, or emissions intensity.
Values fell quickly after the leading group
Canada reported 0.1133 Mt CO₂e, Uganda 0.1109, Nigeria 0.1054, Zambia 0.1014, and Kenya 0.0954. These observations are substantial within the dataset but far below the two leading values. Only three economies exceeded 0.3 Mt CO₂e. Eleven were above 0.1 and at or below 0.3. Thirty-four were above 0.02 and at or below 0.1. The result is a distribution with a small high-emission tail and a much larger body of low observations.
Looking at the lower bands makes the shape even clearer. Thirty-six economies had a reported value of exactly 0.0000. Sixty-one were above zero but no higher than 0.005, and another 42 were above 0.005 but no higher than 0.02. Together, 139 of the 187 numeric observations were at or below 0.02 Mt CO₂e. A rank such as 80th or 120th therefore may represent only a very small absolute difference. The numerical distance between ranks matters at least as much as the order itself.
A reported zero is not the same as missing data
The World Bank master coverage in the supplied source contains 217 country or economy rows after aggregate groups are excluded. Of those, 187 have a numeric 2024 observation and 30 are source-missing. The analysis uses only the 187 numeric observations. Missing rows were not converted to zero, interpolated, or filled from another provider. This distinction is essential because treating unavailable data as zero would artificially push those economies to the bottom of the ranking and distort the distribution.
The 36 numeric zero observations also need careful wording. A value displayed as 0.0000 is an official numeric observation in this dataset, but it should not automatically be interpreted as proof that absolutely no N₂O was emitted from every covered activity. Reporting precision, estimation methods, and rounding can matter when values are extremely small. The safest interpretation is that the World Bank series reports 0.0000 Mt CO₂e for those economies in 2024 under this indicator definition.
Top 15 observations
| Rank | Economy | Mt CO₂e |
|---|---|---|
| 1 | China | 0.9269 |
| 2 | Brazil | 0.7769 |
| 3 | United States | 0.3089 |
| 4 | Russian Federation | 0.2576 |
| 5 | South Africa | 0.2275 |
| 6 | Ethiopia | 0.2154 |
| 7 | Iran, Islamic Rep. | 0.2033 |
| 8 | Iraq | 0.1761 |
| 9 | Congo, Dem. Rep. | 0.1745 |
| 10 | India | 0.1621 |
| 11 | Canada | 0.1133 |
| 12 | Uganda | 0.1109 |
| 13 | Nigeria | 0.1054 |
| 14 | Zambia | 0.1014 |
| 15 | Kenya | 0.0954 |
The table highlights the large gaps near the top. The first two observations are both above 0.7 Mt CO₂e, but the third falls to 0.3089. From fifth through tenth, the values cluster more closely between about 0.16 and 0.23. A one-position change in rank therefore does not have a consistent numerical meaning. When comparing countries, the actual value and the gap to neighboring observations are more informative than rank alone.
How to interpret absolute country values
First, these are absolute emissions rather than per-capita or intensity measures. Large economies or large energy-producing countries may naturally have more activity that can generate fugitive emissions, but the indicator alone cannot say whether their operations are more or less emissions-intensive. Second, this series covers one greenhouse gas and one emissions category. It does not include every source of N₂O, and it does not substitute for total greenhouse-gas inventories. Third, the values are in CO₂-equivalent units, which are useful for climate comparison but are not the same as physical tonnes of nitrous oxide.
Fourth, one year cannot establish a trend. A country that ranks high in 2024 may have been rising, falling, or stable in earlier years. A proper trend analysis requires the same indicator across multiple years. Fifth, small differences should be treated cautiously because national inventories can differ in underlying data availability and estimation procedures even within an internationally harmonized framework. These limitations do not make the series unusable; they define what question it can answer reliably: how the reported 2024 absolute values compare across covered economies under one consistent indicator.
Useful comparisons with other energy and climate indicators
The next analytical step is to add context rather than to over-interpret the absolute ranking. Energy-production measures can indicate whether large values coincide with large extraction or processing activity. Population, GDP, or total energy supply can be used to construct intensity measures when the denominators are compatible. Fugitive methane emissions are another useful companion because methane and N₂O can arise from different processes within broadly related energy systems. Comparing the two can show whether a country stands out in one gas, both gases, or neither.
Those comparisons need consistent definitions. A methane series may use a different emissions category, global-warming-potential convention, or reporting boundary. Likewise, a per-capita calculation answers a different question from an absolute-emissions ranking. For reproducible analysis, it is better to keep the same year, verify the indicator definitions, preserve missing values, and state clearly when a derived denominator is introduced. The 2024 absolute N₂O series can then serve as a baseline rather than an all-purpose performance metric.
Source coverage and calculation method
The source is the World Bank World Development Indicators series EN.GHG.N2O.FE.MT.CE.AR5. The comparison year is 2024. After aggregate regions are excluded, the source master contains 217 economies; 187 have numeric values and 30 are missing. The ranking, reported-value sum, simple mean, median, percentiles, band counts, and concentration shares in this article were calculated directly from the 187 numeric observations. No missing value was replaced with zero and no observation from a different year was substituted.
The total of 5.9347 Mt CO₂e should therefore be read as the arithmetic sum of the 187 reported country and economy values, not as an official complete global total. The concentration percentages use that same 187-value sum as the denominator. This approach keeps every calculation reproducible from the underlying observations and avoids implying precision that the missing rows cannot support. If later years become available with different coverage, comparisons should use either a common set of economies or clearly disclose the change in coverage.
What stands out in the 2024 data
The main statistical feature is the contrast between a very low median and a small number of large observations. China and Brazil alone made up about 28.7% of the reported-value sum, while half of the economies were at or below 0.0044 Mt CO₂e. The top 10 accounted for about 57.8%. That means the distribution is better described by concentration and a long upper tail than by a single “average country” value.
The second key point is scope. This is not a ranking of overall climate performance, and it should not be used as one. It is a focused view of N₂O from fugitive emissions associated with the energy sector. Within that narrow purpose, the data are useful for identifying where reported absolute values are largest and for selecting countries that deserve deeper comparison with methane, energy-production, or intensity indicators. Used with those boundaries, the 2024 series provides a clear and reproducible snapshot.
Frequently Asked Questions
Which economy had the highest fugitive energy N₂O emissions in 2024?
Among the 187 economies with numeric World Bank observations, China was highest at 0.9269 Mt CO₂e, followed by Brazil at 0.7769 Mt CO₂e.
Is a reported value of 0.0000 the same as missing data?
No. A numeric zero is a reported observation, while a missing row has no numeric value. The source master had 187 numeric observations and 30 missing rows for 2024.
Can this ranking be used as a measure of overall climate performance?
No. It covers only nitrous oxide from a specific fugitive-emissions category in energy and is not normalized for population, GDP, or energy activity.
Related Articles
Green Map creates custom-edited map images using open geographic data sources such as geoBoundaries, Natural Earth, OpenStreetMap, and government open data. These maps are edited visual materials, not raw data files, and are provided for education, documents, presentations, and graphic reference.