Fossil-fuel input in the U.S. electric-power sector varies widely from state to state in 2025. The underlying U.S. Energy Information Administration series fixes the same definition for every observation: fueltypeid=FOS, sectorid=98 for Electric Power, and the total-consumption-btu field. The result is a 50-state comparison of fuel energy used for electricity generation and useful thermal output, reported in million MMBtu. Every state has an observed value in this dataset; there are no missing rows and the District of Columbia is not part of this particular slice.
The simple sum of the 50 state observations is 21,561.52 million MMBtu. Texas is the largest at 2,896.21, equal to 13.43% of that 50-state sum. Florida follows at 1,553.29 (7.20%), and Pennsylvania is third at 1,231.38 (5.71%). These percentages describe the distribution inside the 50-state dataset; they should not be treated as a separately published national-total share that includes territories or other geographic adjustments.
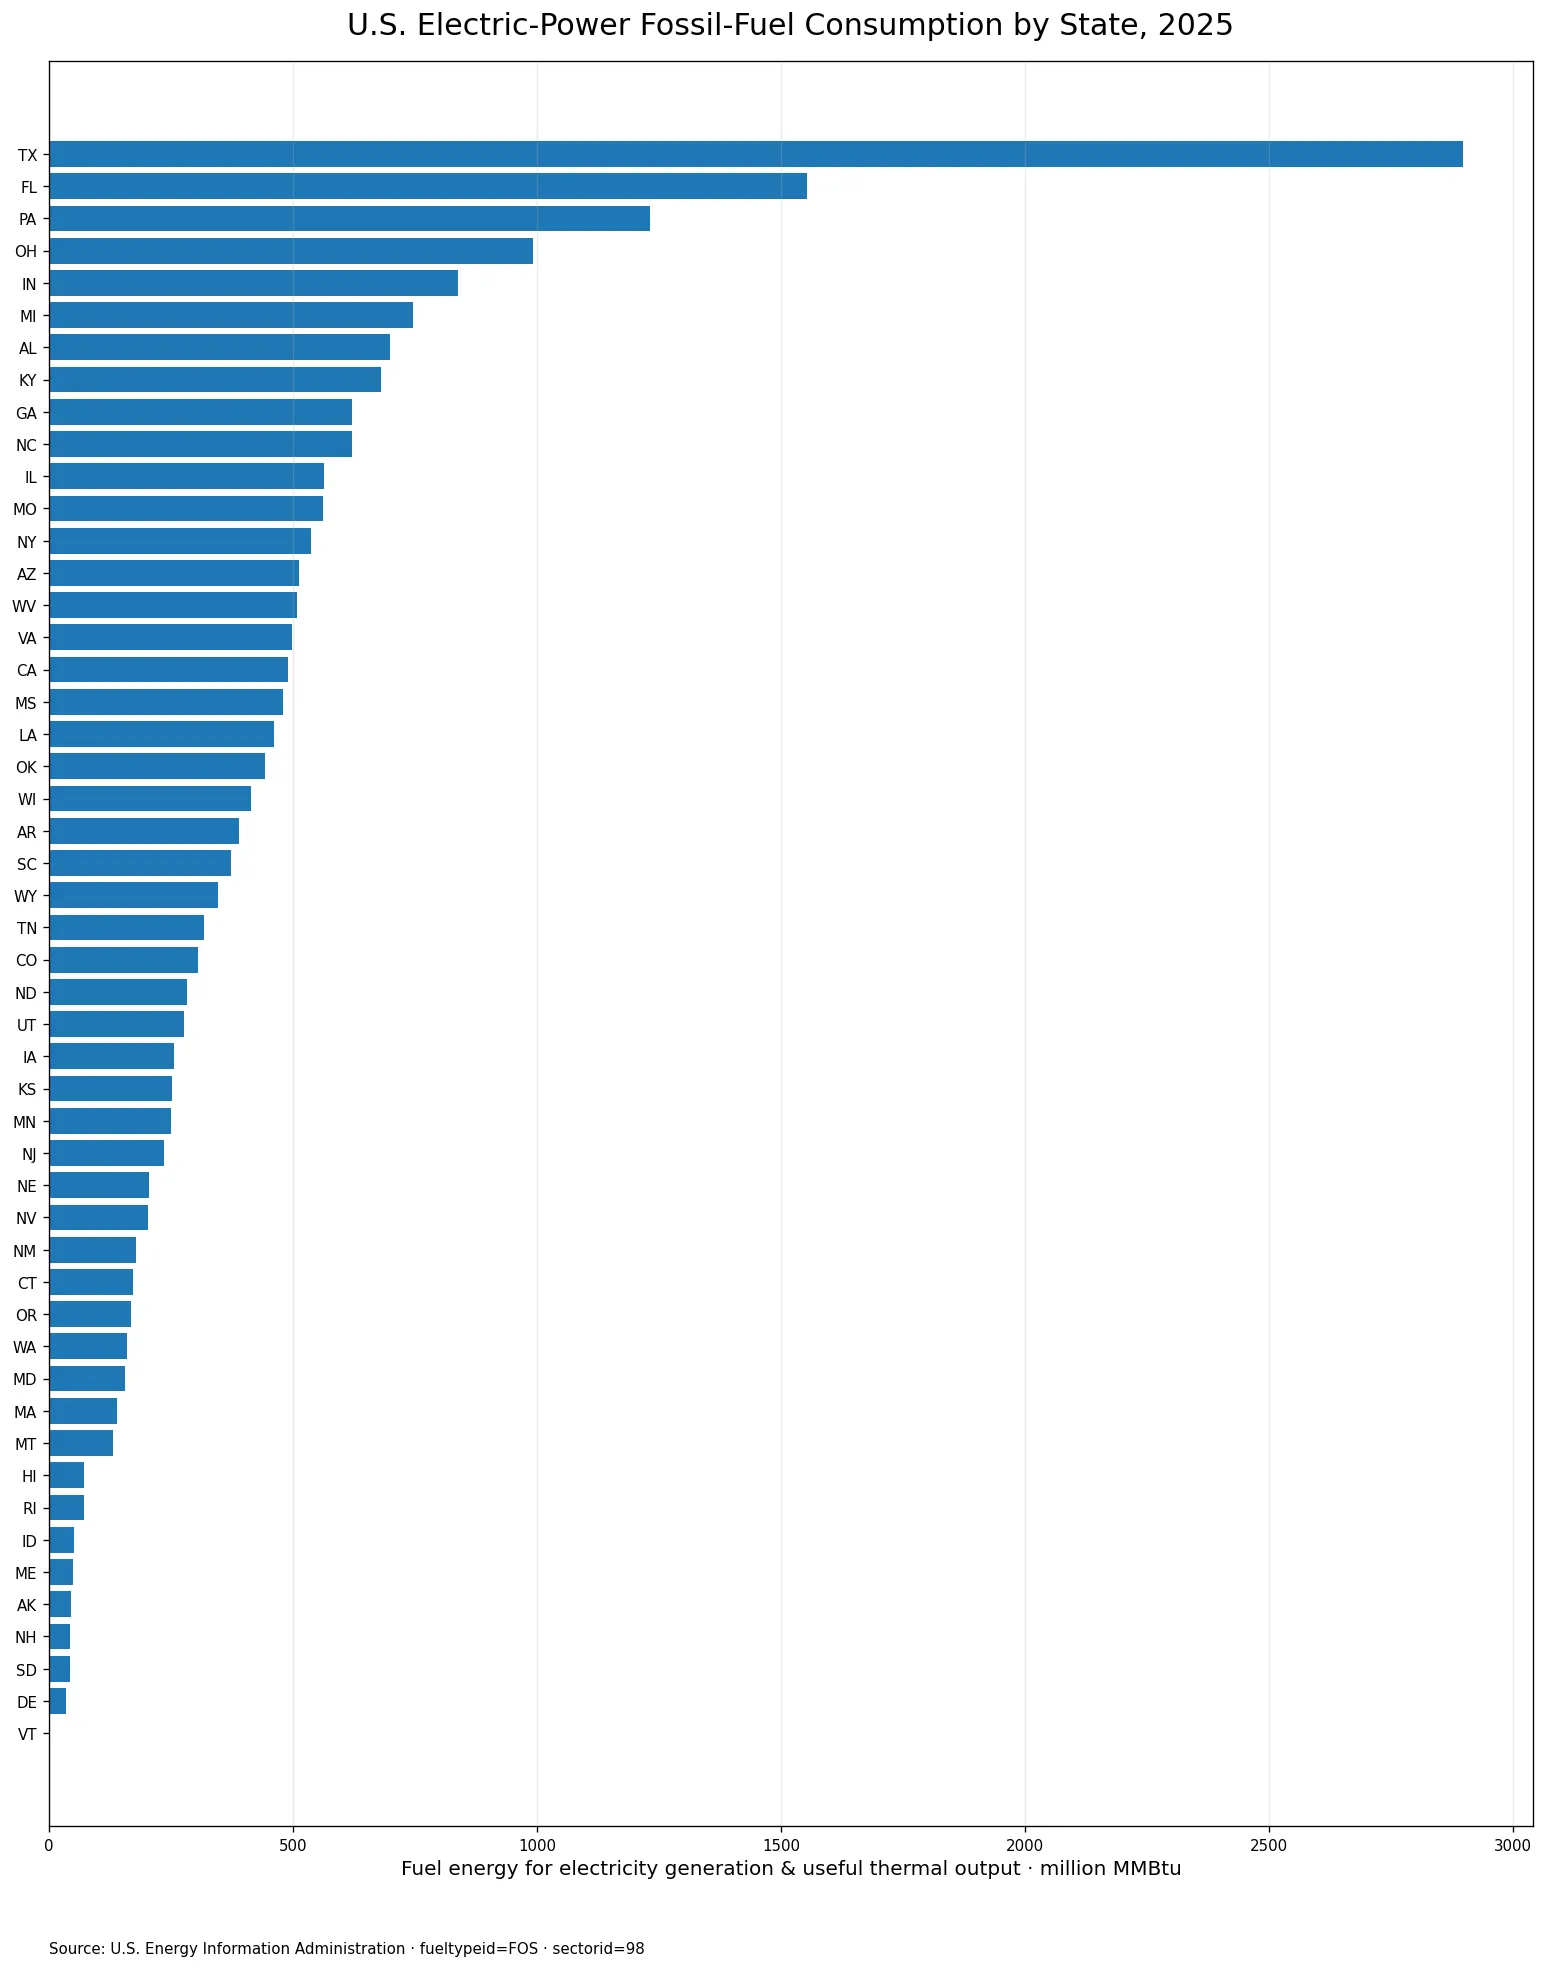
Table of Contents
What this EIA measure actually represents
The metric is an energy-input measure, not an electricity-output measure. EIA labels the series as consumption of fuels for electricity generation and useful thermal output in BTUs. Fixing FOS selects the fossil-fuel aggregate, while sector 98 restricts the comparison to the Electric Power sector. A larger number therefore means a larger amount of fossil-fuel energy was consumed within this operational definition during 2025.
That distinction matters because a low value does not automatically mean low electricity generation, low electricity demand, or a small power system. States differ in their generation mix, the amount of non-fossil generation, plant efficiency, imports and exports of electricity, and the role of combined heat and power. The series is best used for like-for-like comparisons of fossil-fuel energy input under one fixed EIA definition.
Texas alone represents 13.43% of the 50-state sum
Texas records 2,896.21 million MMBtu, about 1.86 times Florida. Texas plus Florida account for 20.64% of the 50-state sum, while adding Pennsylvania raises the top-three share to 26.35%. The largest state is influential, but the distribution is not dominated by one or two states to the point that the rest becomes negligible.
The top five states account for 34.83% and the top ten for 50.45%. In other words, the ten largest observations make up just over half of the dataset sum, leaving nearly half spread across forty other states. That balance is useful context when reading the very large Texas bar in the chart.
| Rank | State | Code | 2025 value (million MMBtu) | Share of 50-state sum |
|---|---|---|---|---|
| 1 | Texas | TX | 2,896.21 | 13.43% |
| 2 | Florida | FL | 1,553.29 | 7.20% |
| 3 | Pennsylvania | PA | 1,231.38 | 5.71% |
| 4 | Ohio | OH | 991.67 | 4.60% |
| 5 | Indiana | IN | 838.15 | 3.89% |
| 6 | Michigan | MI | 746.19 | 3.46% |
| 7 | Alabama | AL | 697.98 | 3.24% |
| 8 | Kentucky | KY | 680.78 | 3.16% |
| 9 | Georgia | GA | 621.51 | 2.88% |
| 10 | North Carolina | NC | 620.44 | 2.88% |
The mean sits well above the median
The arithmetic mean is 431.23 million MMBtu, while the median is 311.78. The mean is about 119.45 higher because several large observations pull it upward. Texas exceeds 2,800 million MMBtu, Florida exceeds 1,500, and Pennsylvania exceeds 1,200. A median near 312 therefore gives a different and often more representative view of the middle of the state distribution.
The first quartile is 162.42 and the third quartile is 530.77 million MMBtu. Half of the states fall roughly between those points. Fifteen states are at or above 500 million MMBtu, five are at or above 750, and three reach 1,000 or more. At the other end, nine states are below 100. The spread is broad and strongly right-skewed rather than clustered around one common level.
Several Southeastern states appear near the top
Florida ranks second at 1,553.29 million MMBtu. Alabama is seventh at 697.98, Georgia is ninth at 621.51, and North Carolina is tenth at 620.44. This puts several Southeastern states in the upper part of the distribution. The pattern is descriptive: it shows where fossil-fuel energy input is large under the EIA definition, not why each state reached that level.
Explaining the regional pattern requires more information. Power-system scale, generation by fuel, fleet efficiency, plant dispatch, combined heat and power, and interstate electricity flows can all matter. A high input value should therefore be treated as an operational quantity rather than a direct score of policy, performance, or dependence.
The Midwest and Appalachian states also contribute large observations
Ohio is fourth at 991.67 million MMBtu, Indiana fifth at 838.15, and Michigan sixth at 746.19. Kentucky records 680.78, Illinois 563.30, Missouri 560.72, and West Virginia 507.93. Pennsylvania, often grouped with the broader Appalachian energy region, is third at 1,231.38. These values show that the upper half of the distribution is geographically diverse.
The metric still cannot tell us which specific fossil fuel explains each state total. FOS is an aggregate category. To separate natural gas, coal, petroleum products, or other fuel categories, the fuel facet would need to be changed while holding the year, sector, field, and geography constant. That is the appropriate next step for a fuel-mix explanation.
Very small values are observed values, not missing data
Vermont is the smallest observation at only 0.12 million MMBtu. Delaware is 34.61, South Dakota 42.88, New Hampshire 44.21, and Alaska 45.44. Because every one of the 50 rows contains a value, none of these small bars should be interpreted as “no data.”
| Low-value order | State | Code | 2025 value (million MMBtu) | Share of 50-state sum |
|---|---|---|---|---|
| 1 | Vermont | VT | 0.12 | 0.001% |
| 2 | Delaware | DE | 34.61 | 0.161% |
| 3 | South Dakota | SD | 42.88 | 0.199% |
| 4 | New Hampshire | NH | 44.21 | 0.205% |
| 5 | Alaska | AK | 45.44 | 0.211% |
This is especially important for Vermont, whose bar is visually close to zero compared with Texas. The value is positive and explicitly reported. The dataset contains neither missing observations nor exact zeros. A chart that uses a common scale therefore compresses the smallest values, but that is a consequence of the range rather than a data-quality problem.
A state share of the sum is not a fossil-fuel share of its electricity mix
Texas at 13.43% does not mean 13.43% of Texas electricity came from fossil fuels. The denominator is not Texas electricity generation or Texas total energy use. It is simply the sum of the 50 state values in this fossil-fuel input series. The share answers a different question: how much of the measured 50-state fossil-fuel input is associated with each state?
For an electricity-mix question, the numerator and denominator would need to be generation quantities, usually in MWh, separated by source and divided by total generation. For an emissions-intensity question, emissions would be related to electricity output. For efficiency, fuel input would need to be compared with useful energy output. Keeping those metrics separate prevents a large absolute system from being mistaken for an inefficient or unusually fossil-dependent one.
Useful thermal output is part of the metric identity
The formal series name includes useful thermal output as well as electricity generation. That wording matters because electric-power operations can include facilities that produce both electricity and useful heat. Reading the field as “electricity generation fuel only” would narrow the definition. Comparisons with other EIA series should therefore match the field as well as the fuel and sector facets.
This is also why superficially similar articles can report different numbers for the same state and year. A series using All Sectors, a non-CHP sector, useful-thermal-output-only consumption, renewable fuels, or all fuels is measuring a different slice. The correct comparison begins with the full combination of field, fueltypeid, sectorid, unit, year, and geography.
What can and cannot be concluded from the state ranking
The ranking supports straightforward statements about magnitude and concentration. Texas is largest, Florida and Pennsylvania follow, the top ten account for 50.45% of the 50-state sum, and the median is 311.78 million MMBtu. Those results come directly from one consistent dataset and require no assumptions about causes.
The ranking does not by itself establish electricity prices, reliability, emissions performance, renewable progress, energy independence, or plant efficiency. Each of those questions needs additional variables. Pairing this series with generation by fuel, capacity, heat rates, plant-level operations, and emissions would make it possible to move from descriptive state comparisons toward explanations.
Data source and calculation notes
The source is the U.S. Energy Information Administration Electricity API. The comparison uses annual 2025 observations with total-consumption-btu, fueltypeid=FOS, sectorid=98, and state geography. Values are direct published observations in million MMBtu; no missing values were imputed and no state totals were reconstructed.
The descriptive statistics in this article—the 21,561.52 sum, 431.23 mean, 311.78 median, quartiles, ranks, and state shares—are calculated from the 50 observed rows. The District of Columbia is not present in this source slice, so it is not added or assigned a zero. This keeps the analysis aligned with the actual geographic coverage of the verified data.
Frequently Asked Questions
Which state had the largest Electric Power fossil-fuel consumption in 2025?
Texas was the largest observation at 2,896.21 million MMBtu, about 13.43% of the simple sum of the 50 state values.
Does this metric show the fossil-fuel share of each state’s electricity mix?
No. It measures fossil-fuel energy input using total-consumption-btu in million MMBtu. A generation-share metric would require generation by fuel divided by total electricity generation.
Is the District of Columbia included?
No. The verified 2025 slice contains 50 rows for the 50 states. D.C. is not present and was not added as a zero or an imputed value.
Related Articles
Green Map creates custom-edited map images using open geographic data sources such as geoBoundaries, Natural Earth, OpenStreetMap, and government open data. These maps are edited visual materials, not raw data files, and are provided for education, documents, presentations, and graphic reference.