State electricity statistics can look very different depending on whether the measure is generation, capacity, fuel input, or final consumption. The 2025 U.S. Energy Information Administration data used here measure the energy content of fossil fuels consumed for electricity generation and useful thermal output. The underlying EIA operational-data query uses the total-consumption-btu field, the aggregate fossil-fuel category FOS, and sector 99 for all sectors. Values are reported in million MMBtu. That makes this a fuel-input comparison, not a ranking of electricity generation or electricity demand.
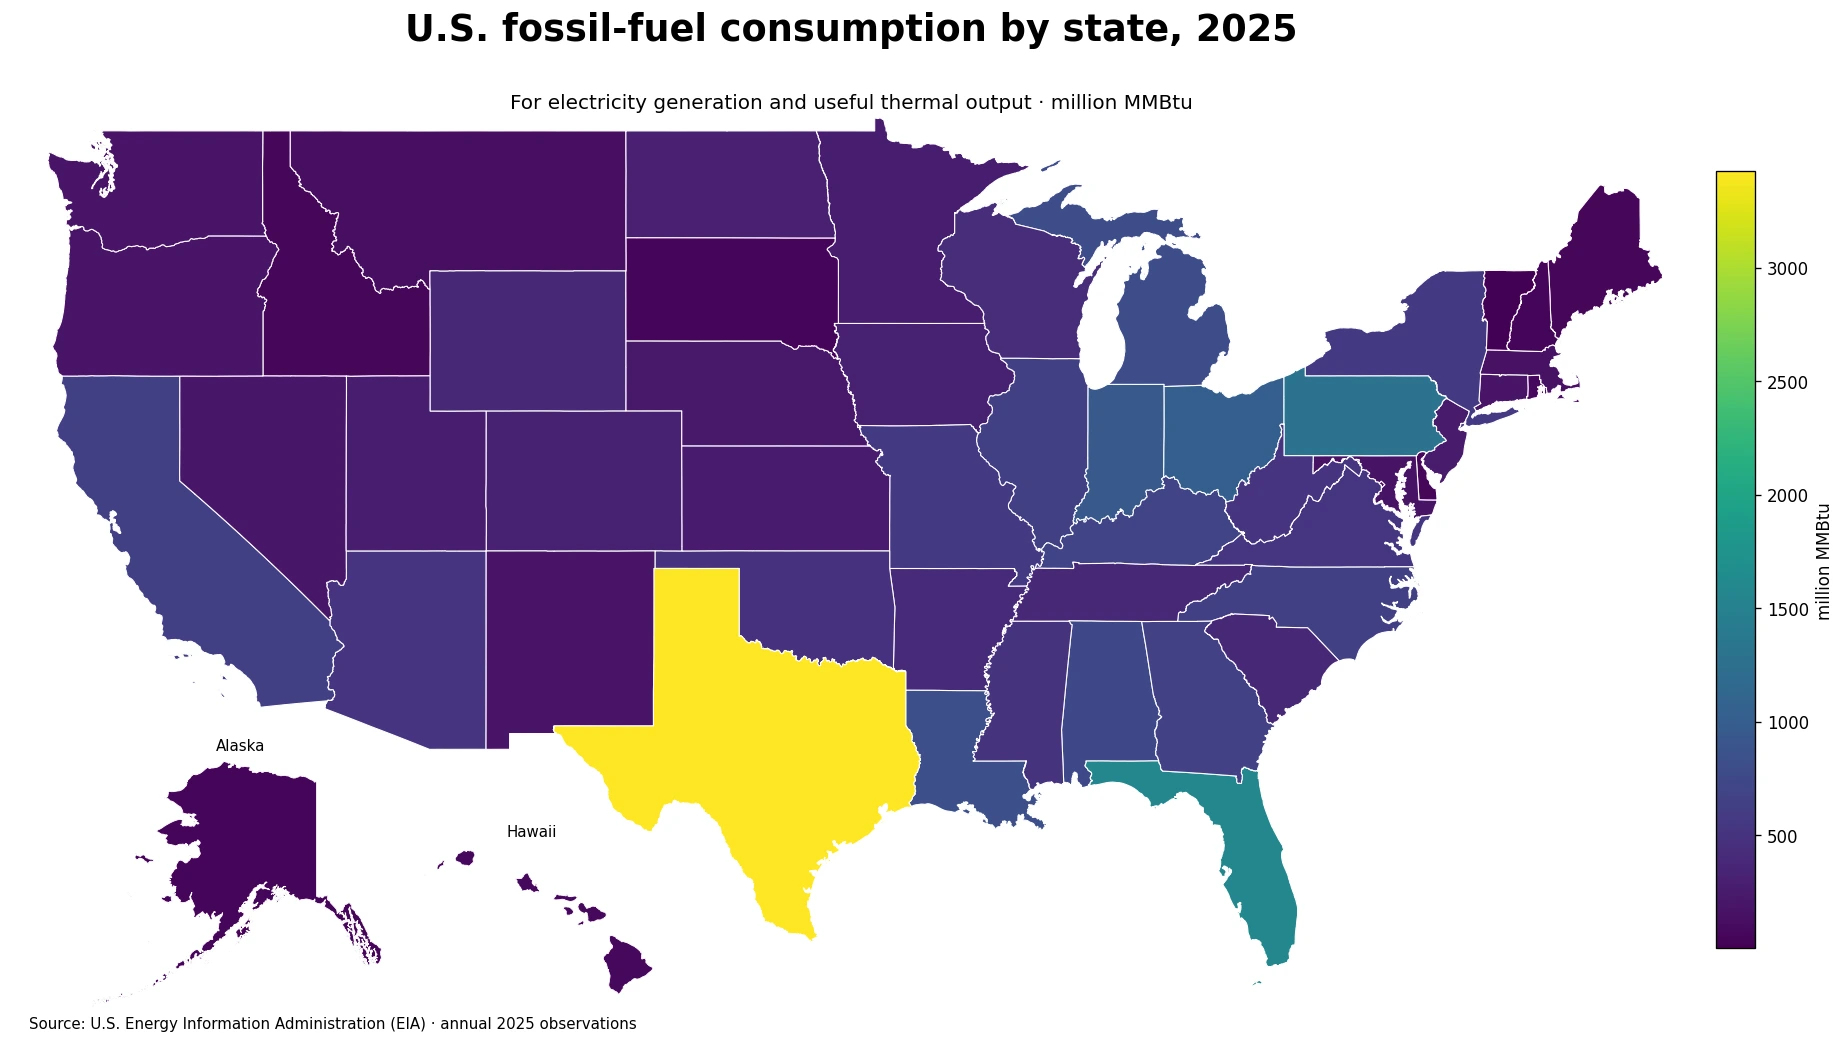
Table of Contents
All 50 states and the District of Columbia have a 2025 observation
The dataset contains 51 jurisdictions: the 50 states plus the District of Columbia. Every row has a 2025 value, so there are no missing observations to impute or convert to zero. All 51 jurisdictions also match the state boundary layer used for the map. Summed across the dataset, fossil-fuel consumption reaches 23,565.75 million MMBtu. The simple mean is 462.07 million MMBtu and the median is 316.76. Because one million MMBtu equals one trillion Btu, the combined total is about 23.57 quadrillion Btu. The original EIA unit is retained in the tables and charts to avoid unnecessary unit changes.
The distribution is strongly uneven. The 25th percentile is 169.26 million MMBtu and the 75th percentile is 597.09, while the mean sits 145.32 million MMBtu above the median. That gap between mean and median reflects the influence of a small group of very large state values. For a typical-state comparison, the median is therefore more informative than the mean alone, while the national spatial pattern is better captured by looking at concentration in the largest states.
Texas accounts for 14.5% of the 51-jurisdiction total
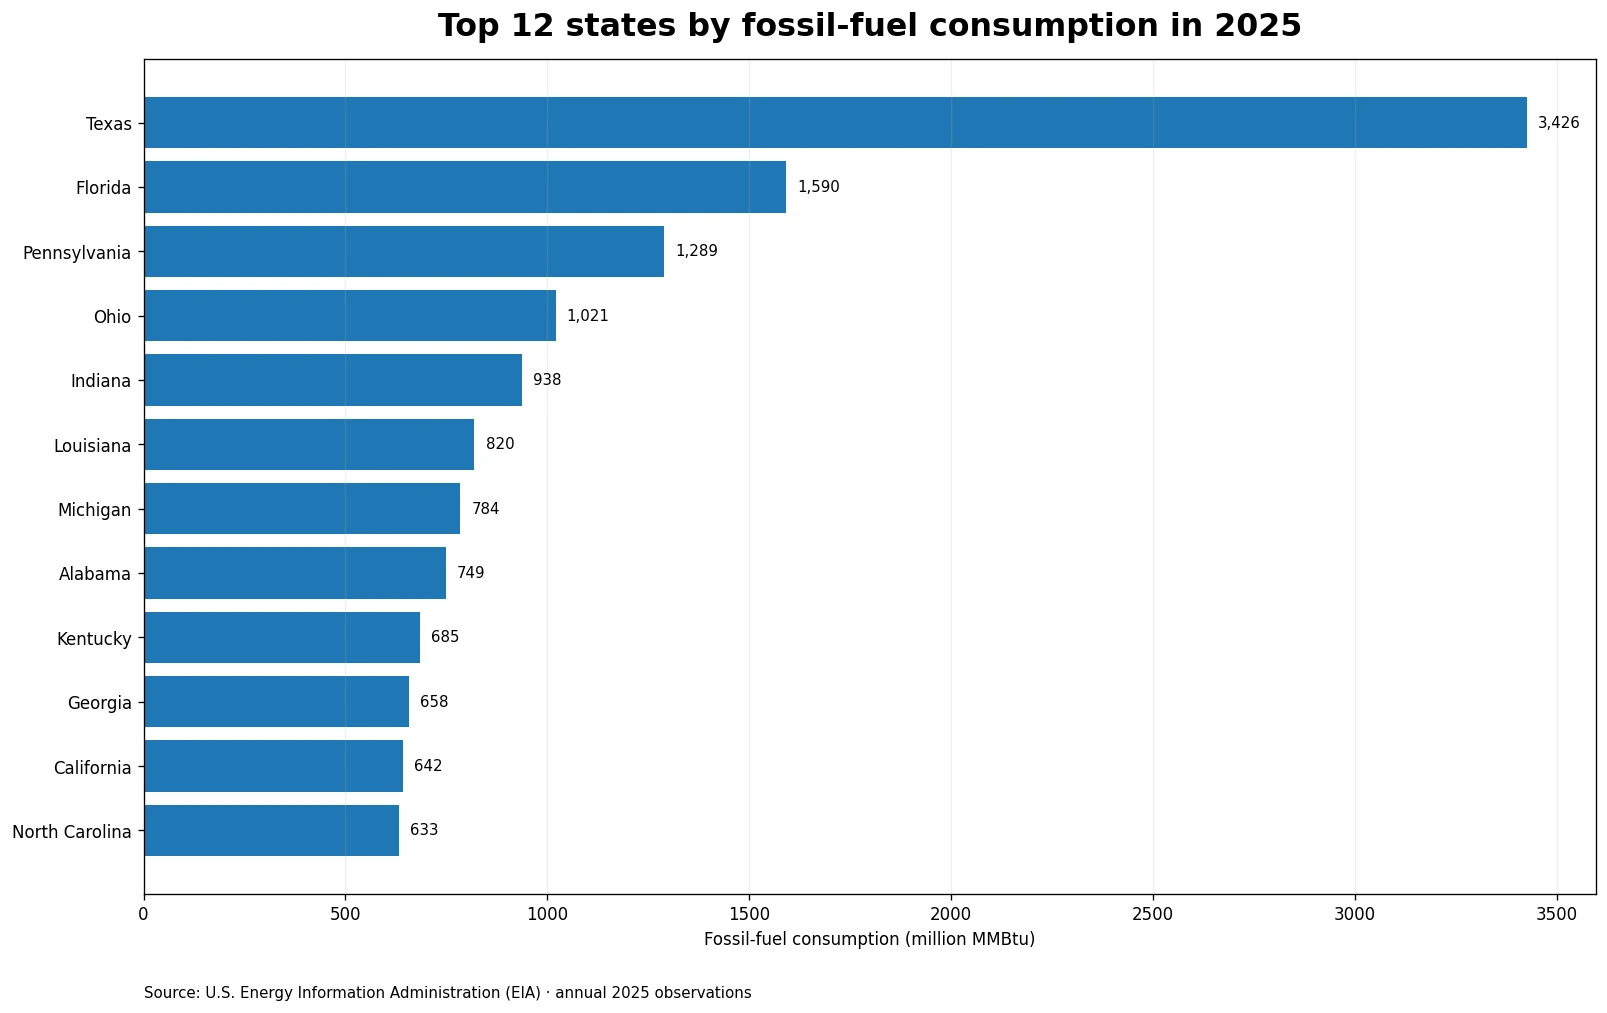
Texas records 3,425.67 million MMBtu, equal to 14.54% of the total in this dataset. Florida ranks second at 1,590.46 million MMBtu and 6.75%. Texas is therefore about 2.15 times Florida on this measure. Pennsylvania follows at 1,289.48, then Ohio at 1,020.59 and Indiana at 938.16 million MMBtu. The five largest states account for 35.07% of the total, and the top ten reach 50.75%, just over half of all recorded fossil-fuel energy input.
| State | Consumption (million MMBtu) | Share of 51-jurisdiction total |
|---|---|---|
| Texas | 3,425.7 | 14.54% |
| Florida | 1,590.5 | 6.75% |
| Pennsylvania | 1,289.5 | 5.47% |
| Ohio | 1,020.6 | 4.33% |
| Indiana | 938.2 | 3.98% |
| Louisiana | 819.5 | 3.48% |
| Michigan | 784.2 | 3.33% |
| Alabama | 749.4 | 3.18% |
| Kentucky | 684.6 | 2.91% |
| Georgia | 658.1 | 2.79% |
The upper group is geographically mixed rather than confined to one part of the country. Louisiana records 819.51 million MMBtu, Michigan 784.19, Alabama 749.43, Kentucky 684.61 and Georgia 658.15. California and North Carolina are just outside the top ten at 642.42 and 632.88 million MMBtu. These values should not be read as state electricity-demand rankings or per-capita fossil-fuel measures. They quantify fuel energy consumed in the production process represented by the EIA series, while population, electricity imports and exports, industry mix, and the composition of the generating fleet are separate questions.
The measure is fuel energy consumed, not electricity produced
The official metric name is “Consumption of Fuels for Electricity Generation and Useful Thermal Output (BTUs).” The distinction between input and output matters. A Btu-based fuel-consumption series measures the energy content of fuels entering electricity-generation and useful-thermal-output processes. It does not assume that every unit of input energy becomes an equal unit of electricity. Conversion efficiency, plant technology, operating conditions, and the presence of useful thermal output can change the relationship between fuel input and electric output. A separate EIA generation series is needed to answer which state produced the most electricity.
The FOS filter is also an aggregate category. It identifies fossil fuels as a group rather than attributing the total to one specific fuel. A high value in this dataset does not by itself show whether natural gas, coal, petroleum, or another fossil-fuel component dominates within the state. A fuel-specific analysis would require more detailed fueltypeid selections. The strength of the aggregate measure is that it gives one consistent view of the overall fossil-fuel energy input used for electricity generation and useful thermal output across all states.
Vermont and the District of Columbia are small positive observations, not missing data
At the low end, Vermont records 0.20 million MMBtu and the District of Columbia 1.33. New Hampshire is at 45.29, South Dakota at 45.76, and Alaska at 50.84 million MMBtu. These are observed values, not placeholders created by filling missing data with zero. Vermont in particular is below one million MMBtu, which can appear almost indistinguishable from zero on a national color scale even though the source value is positive.
The dataset alone cannot identify why one state sits near the bottom. Generation mix, plant operations, electricity transfers across state lines, local demand, industrial structure, weather, and many other factors can be relevant, but they are not decomposed by this single metric. It is therefore safer to say that these jurisdictions used relatively little fossil-fuel energy in the covered electricity and useful-thermal-output activities in 2025, rather than turning the ranking into a broad judgment about energy policy or overall fossil-fuel dependence.
Concentration does not measure efficiency, emissions, or carbon intensity
The state shares provide a clear concentration measure: Texas contributes 14.54%, Florida 6.75%, and Pennsylvania 5.47% of the 51-jurisdiction sum. The top ten together contribute 50.75%. Those percentages describe where fuel energy is consumed, but they do not measure the efficiency of converting fuel into electricity, the carbon intensity of the power system, emissions per person, or the renewable share of generation. Different fossil fuels have different carbon content, and different plants can convert the same fuel energy into different amounts of useful output.
Two states with identical million-MMBtu values could therefore have different generation output, different useful-thermal-output shares, and different emissions. Electricity can also be produced in one state and consumed in another, so production-side fuel input should not be equated with final electricity consumption. The most defensible interpretation of this map is spatial: it shows where fossil-fuel energy inputs for the specified EIA electricity-sector activity were largest and smallest in 2025.
A single year is a snapshot, not a long-term trend
The ranking is a cross-section for 2025. It establishes that Texas has the largest value in this year’s data, with Florida and Pennsylvania next, but it does not show whether the same ordering persisted before 2025 or will persist afterward. Fuel prices, plant retirements and additions, weather, operating schedules, electricity demand, and other conditions can change annual fuel use. A trend analysis would need a multi-year series built with the same EIA field, fuel filter, sector filter, frequency, and unit.
Keeping the definition fixed is especially important when comparing EIA tables. A total-consumption-btu series for all fossil fuels and all sectors is not interchangeable with a natural-gas-only series, a generation series, or a value restricted to one producer type. The 51 values summarized here are directly comparable because they come from one annual 2025 query with the same FOS and sector-99 settings for every state.
Key points for reading the 2025 state data
- The dataset includes all 50 states and the District of Columbia, with no missing 2025 values and no zero-filling.
- Total fossil-fuel input is 23,565.8 million MMBtu, while the median state value is 316.8 million MMBtu.
- Texas records 3,425.7 million MMBtu, or 14.54% of the total; the top ten states account for 50.75%.
- The metric measures fossil-fuel energy consumed for electricity generation and useful thermal output, not electricity generation itself.
- FOS is an aggregate fossil-fuel category, so the data do not identify the contribution of each individual fossil fuel.
- A multi-year series with the same filters is required before drawing conclusions about long-term increases or decreases.
The official source is the U.S. Energy Information Administration Electric Power Operational Data API. The query fixes annual frequency, 2025 as both the start and end year, total-consumption-btu as the data field, fossil fuels (FOS) as the fuel category, and sector 99 for all sectors. Checking those filters and the million-MMBtu unit is essential when comparing these figures with other EIA electricity tables.
Frequently Asked Questions
Which state had the largest fossil-fuel consumption for electricity generation and useful thermal output in 2025?
Texas, at 3,425.67 million MMBtu, representing 14.54% of the total across the 50 states and the District of Columbia.
Does this measure tell us which state generated the most electricity?
No. It measures the energy content of fossil fuels consumed in electricity generation and useful thermal output. Electricity generation is a separate output metric.
Were missing state values treated as zero?
No. All 51 jurisdictions have a reported 2025 value in the source data, and the map uses those observations directly.
Related Articles
Green Map creates custom-edited map images using open geographic data sources such as geoBoundaries, Natural Earth, OpenStreetMap, and government open data. These maps are edited visual materials, not raw data files, and are provided for education, documents, presentations, and graphic reference.