World Bank indicator MS.MIL.XPND.ZS provides a latest non-empty estimate of military expenditure as a share of general government expenditure for 161 countries and economies. 144 observations are from 2024, while 17 are latest available values from 1999–2023. The unweighted mean across all latest observations is 7.79% and the median is 5.25%.
The denominator is government expenditure, not GDP. The indicator therefore describes how much of general government spending is represented by military expenditure. It is a budget-composition ratio rather than a measure of absolute military spending or a direct measure of military capability.
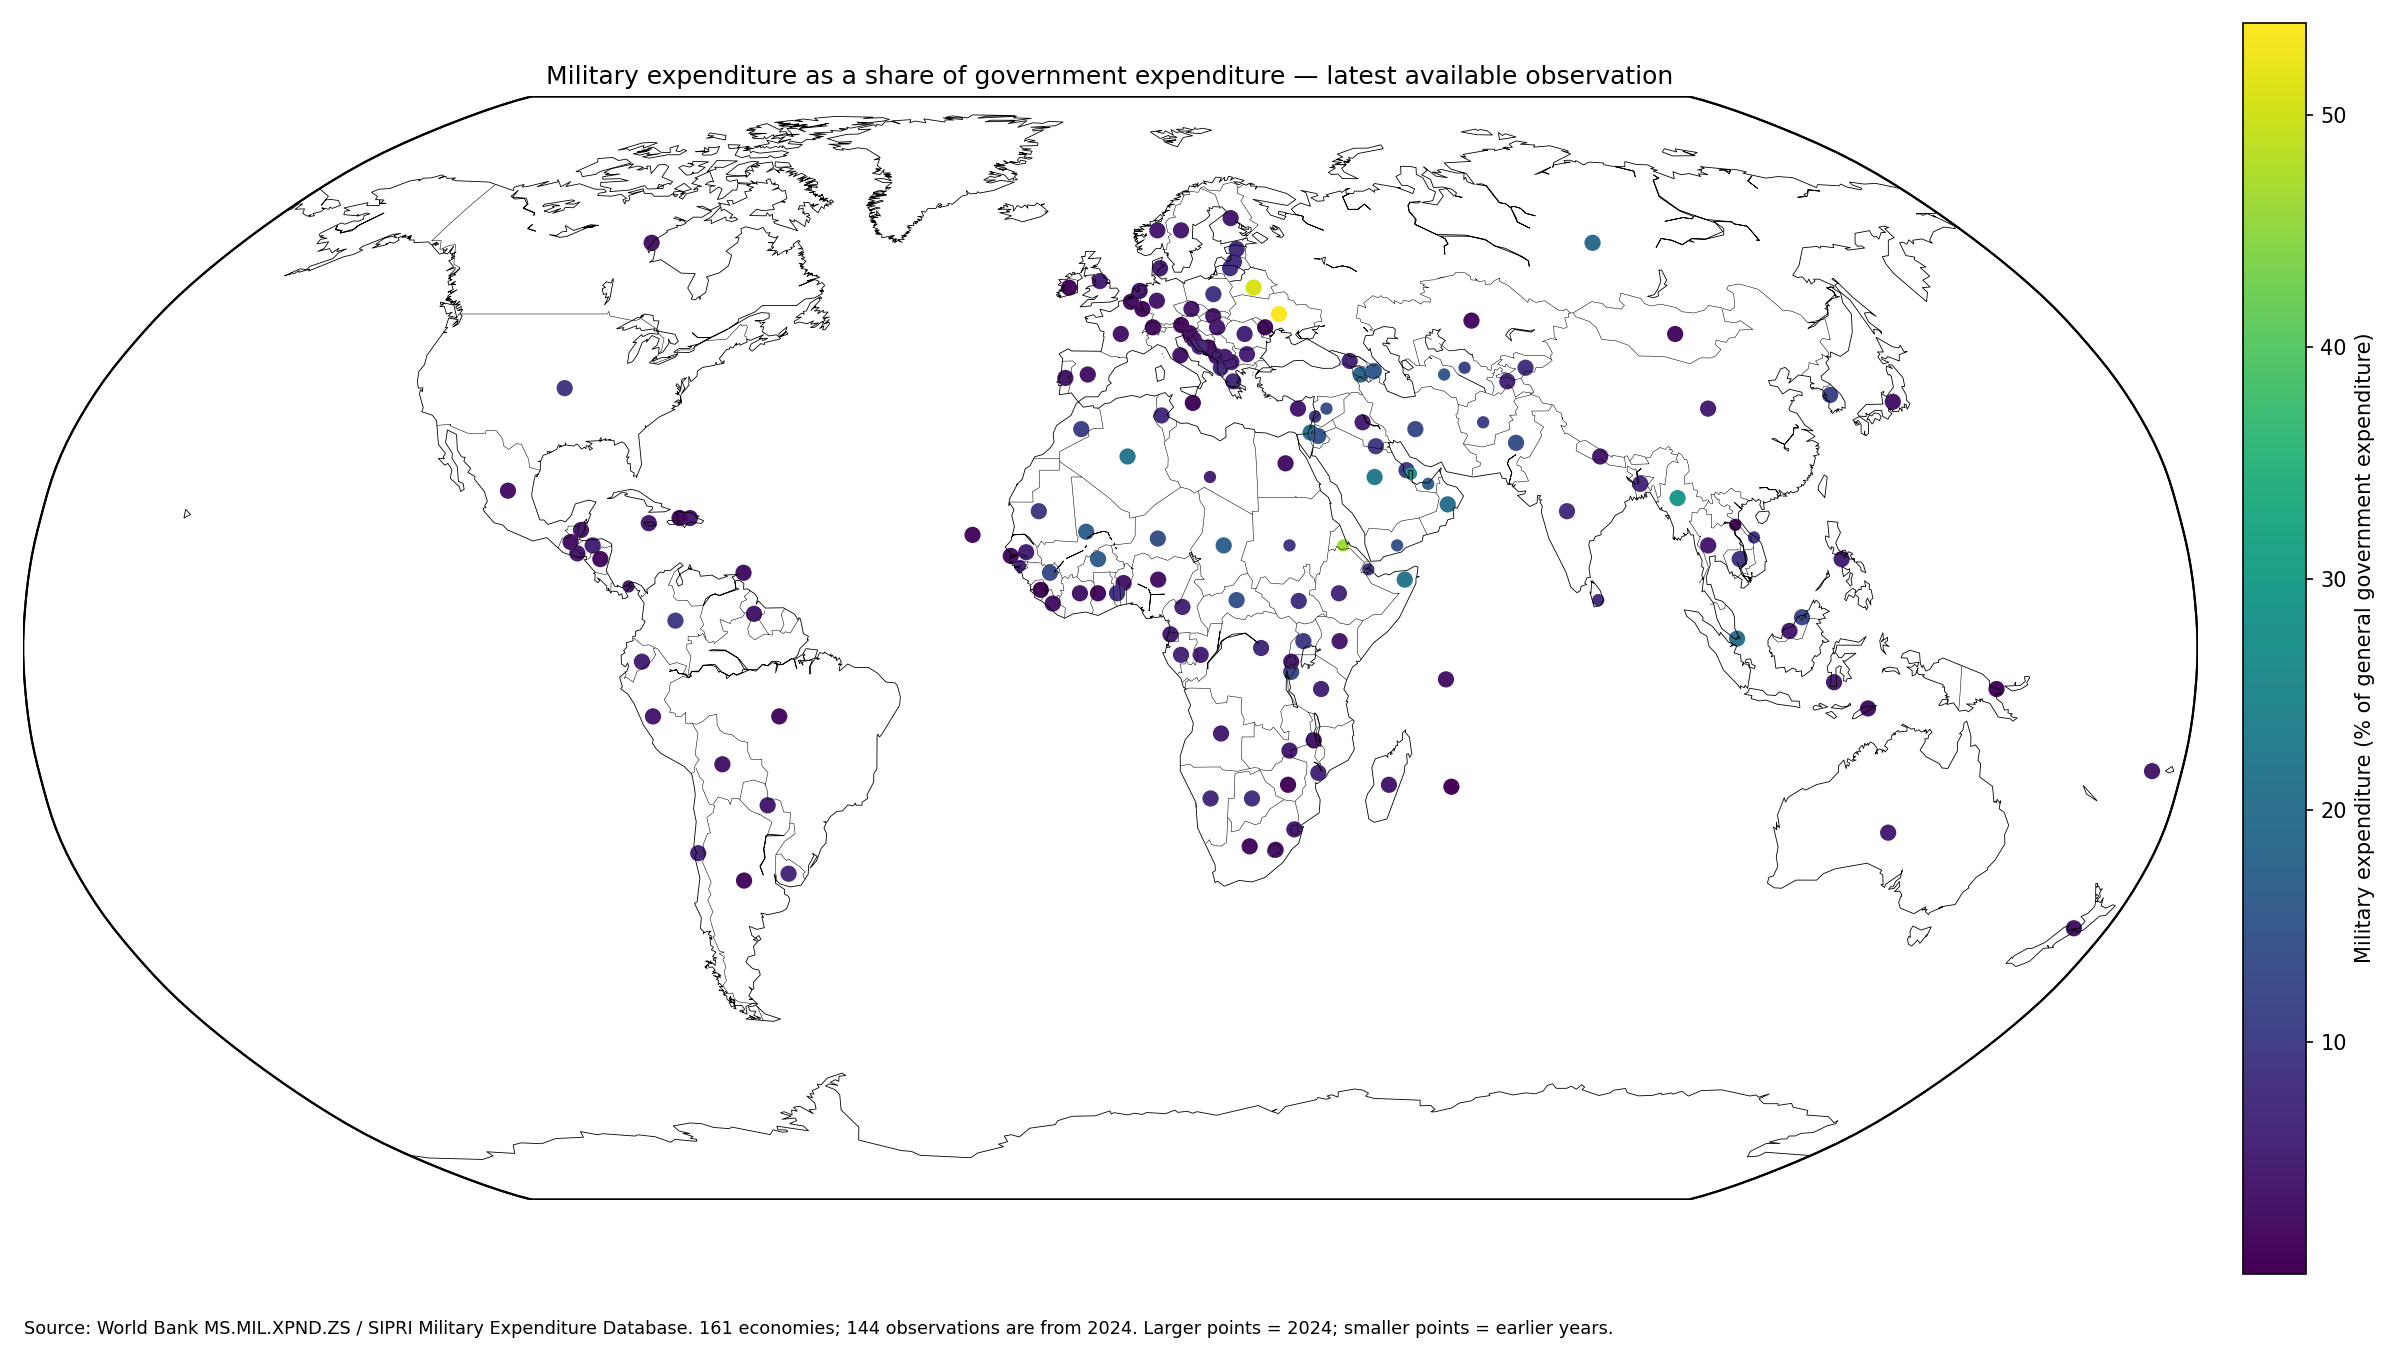
Table of Contents
The indicator measures the military share of government spending
The World Bank metadata glossary defines the series as military expenditure expressed as a percentage of general government expenditure. The numerator follows the SIPRI military-expenditure concept, while the denominator is general government expenditure.
SIPRI methodology states that its government-expenditure share uses IMF general-government expenditure figures, including central, regional and local government where available. The denominator is therefore broader than a single central-government defence budget in many countries.
Military expenditure is broader than arms purchases
The SIPRI definition aims to include current and capital spending on armed forces, peacekeeping forces, defence ministries and other defence agencies, qualifying paramilitary forces, and military space activities.
It can include personnel, operations and maintenance, procurement, military research and development, military construction and military aid borne by donor countries. Civil defence and some spending on past military activities are excluded. The indicator should therefore not be relabeled as the share of government spending used to buy weapons.
The synchronized 2024 subset covers 144 economies
Among the 144 2024 observations, Ukraine records 54.01%, Belarus 50.66%, Myanmar 29.10%, Saudi Arabia 22.31% and Somalia 21.57%.
| 2024 rank | Country or economy | Military expenditure / government expenditure |
|---|---|---|
| 1 | Ukraine | 54.01% |
| 2 | Belarus | 50.66% |
| 3 | Myanmar | 29.10% |
| 4 | Saudi Arabia | 22.31% |
| 5 | Somalia, Fed. Rep. | 21.57% |
| 6 | Algeria | 21.38% |
| 7 | Oman | 20.13% |
| 8 | Singapore | 20.13% |
| 9 | Israel | 19.99% |
| 10 | Russian Federation | 18.90% |
| 11 | Armenia | 18.33% |
| 12 | Chad | 17.22% |
| 13 | Burkina Faso | 17.00% |
| 14 | Mali | 16.65% |
| 15 | Azerbaijan | 15.23% |
The 2024 subset has an unweighted mean of 7.23% and a median of 4.81%. The first quartile is 3.33% and the third quartile 8.07%. 15 economies are below 2%, 61 are from 2% to under 5%, 40 from 5% to under 10%, 20 from 10% to under 20%, and 8 are at least 20%.
The 2024 median is 4.81%
A median of 4.81% means half of the 2024 country observations are below that level and half are above it. The mean of 7.23% is higher because a small group of ratios above 20% stretches the upper tail.
Most countries fall between 2% and 10%, while a smaller group is well above that range. The variation describes differences in government spending composition; the ratio by itself does not establish whether a country’s spending choices are appropriate.
The full latest-value ranking mixes years
Across all 161 latest observations, Ukraine records 54.01%, Belarus 50.66%, Eritrea 46.37%, Myanmar 29.10% and Qatar 26.88%.
Eritrea’s value is from 2003 and Qatar’s from 2022. The United Arab Emirates is from 2014 and Turkmenistan from 1999. The full table is therefore a latest-available comparison rather than a synchronized 2024 ranking.
| Latest-observation rank | Country or economy | Observation year | Military expenditure / government expenditure |
|---|---|---|---|
| 1 | Ukraine | 2024 | 54.01% |
| 2 | Belarus | 2024 | 50.66% |
| 3 | Eritrea | 2003 | 46.37% |
| 4 | Myanmar | 2024 | 29.10% |
| 5 | Qatar | 2022 | 26.88% |
| 6 | Saudi Arabia | 2024 | 22.31% |
| 7 | Somalia, Fed. Rep. | 2024 | 21.57% |
| 8 | Algeria | 2024 | 21.38% |
| 9 | Oman | 2024 | 20.13% |
| 10 | Singapore | 2024 | 20.13% |
| 11 | Israel | 2024 | 19.99% |
| 12 | Russian Federation | 2024 | 18.90% |
| 13 | Armenia | 2024 | 18.33% |
| 14 | Chad | 2024 | 17.22% |
| 15 | United Arab Emirates | 2014 | 17.04% |
Seventeen latest observations are older than 2024
Panama and Turkmenistan are from 1999, Eritrea from 2003, Djibouti from 2008, the Syrian Arab Republic from 2010 and Lao PDR from 2013. The United Arab Emirates and Yemen are from 2014; Uzbekistan and Viet Nam from 2018; Afghanistan and Sudan from 2021.
Qatar and Sri Lanka are from 2022, while Guinea-Bissau, Lebanon and Libya are from 2023. A most-recent-non-empty dataset expands coverage but does not make old observations current.
| Country or economy | Latest observation year | Military expenditure / government expenditure |
|---|---|---|
| Panama | 1999 | 3.80% |
| Turkmenistan | 1999 | 14.96% |
| Eritrea | 2003 | 46.37% |
| Djibouti | 2008 | 9.11% |
| Syrian Arab Republic | 2010 | 13.62% |
| Lao PDR | 2013 | 0.78% |
| United Arab Emirates | 2014 | 17.04% |
| Yemen, Rep. | 2014 | 14.28% |
| Uzbekistan | 2018 | 11.06% |
| Viet Nam | 2018 | 8.82% |
| Afghanistan | 2021 | 10.27% |
| Sudan | 2021 | 9.50% |
| Qatar | 2022 | 26.88% |
| Sri Lanka | 2022 | 7.25% |
| Guinea-Bissau | 2023 | 5.76% |
| Lebanon | 2023 | 8.91% |
| Libya | 2023 | 5.47% |
The overall latest-observation median is 5.25%
The median across 161 latest observations is 5.25%, with a first quartile of 3.59% and a third quartile of 9.11%. 16 observations are below 2%, 62 are from 2% to under 5%, 47 from 5% to under 10%, 26 from 10% to under 20%, and 10 are at least 20%.
The overall simple mean is 7.79%, above the median. Older high-share observations contribute to the difference between the all-country mean and the synchronized 2024 mean.
Many countries at the low end are below 2%
Among 2024 observations, Sierra Leone is at 0.003%, Mauritius 0.48%, Ireland 1.00%, Malta 1.28%, Papua New Guinea 1.29% and Zimbabwe 1.32%.
A low ratio does not mean military expenditure is zero. It means military spending represents a small share of general government expenditure. Countries with very different government budgets can have similar percentages but very different absolute military expenditures.
| Low-end rank | Country or economy | Observation year | Military expenditure / government expenditure |
|---|---|---|---|
| 1 | Sierra Leone | 2024 | 0.003% |
| 2 | Mauritius | 2024 | 0.481% |
| 3 | Lao PDR | 2013 | 0.783% |
| 4 | Ireland | 2024 | 0.998% |
| 5 | Malta | 2024 | 1.279% |
| 6 | Papua New Guinea | 2024 | 1.288% |
| 7 | Zimbabwe | 2024 | 1.323% |
| 8 | Moldova | 2024 | 1.596% |
| 9 | Haiti | 2024 | 1.631% |
| 10 | Bosnia and Herzegovina | 2024 | 1.729% |
| 11 | Ghana | 2024 | 1.763% |
| 12 | Austria | 2024 | 1.852% |
| 13 | Nicaragua | 2024 | 1.898% |
| 14 | Argentina | 2024 | 1.932% |
| 15 | Kazakhstan | 2024 | 1.939% |
Why this ratio differs from military expenditure as a share of GDP
The numerator can be the same military-expenditure concept while the denominator changes. The GDP ratio compares military spending with the size of the whole economy. The government-expenditure ratio compares it with the resources spent by general government.
Because general government expenditure is usually smaller than GDP, the government-spending share is generally numerically higher than the GDP share. The two ratios answer different questions and should not be substituted for one another.
Changes in total government spending can move the ratio
Even if military expenditure is unchanged, the share can fall when other government spending rises. The share can also rise when other public spending declines even if military expenditure itself does not increase.
Interpreting a change therefore requires looking at both the numerator and the denominator. The ratio is a composition measure, not a direct measure of year-to-year military-spending growth.
A high share does not imply the highest absolute military spending
A country with a relatively small government budget can devote a high percentage to the military while spending less money than a larger country with a lower percentage.
Current-dollar or constant-dollar military-expenditure series are better suited to absolute spending comparisons. This indicator is specifically about the share of government expenditure.
Military expenditure is not a direct military-capability score
SIPRI describes military expenditure as an input measure of financial resources absorbed by military activities, not a direct output measure of military capability or military security.
Countries can convert financial resources into personnel, equipment, operations and readiness in different ways because wages, prices, domestic production, procurement systems and exchange rates differ. The percentage should therefore not be used as a direct ranking of military power.
Cross-country precision is limited by definition and source differences
SIPRI applies a common guideline where possible, but country reporting does not always provide enough detail for perfectly uniform classification. For some countries SIPRI must rely more heavily on the coverage available in national sources.
Small differences between similar country ratios should therefore be interpreted cautiously. SIPRI recommends consulting country notes when differences in coverage are important.
Government-expenditure shares are presented on a financial-year basis
The SIPRI Military Expenditure Database states that figures given as a share of government expenditure are presented according to financial year. This differs from some other SIPRI military-expenditure presentations that use calendar years.
Country fiscal years do not all begin on the same date, so an identical year label does not necessarily represent exactly the same months in every country. That timing detail is another reason not to overstate small cross-country differences.
The simple country mean is not a world government-spending-weighted share
The 7.79% mean across 161 latest observations and the 7.23% mean across 144 observations from 2024 give each country equal weight. A government with a very large expenditure budget and a small government each count once.
A world aggregate would require weighting by actual general government expenditure or using an official aggregate. The means and medians here summarize the distribution of country ratios.
Source and calculation notes
The source is World Bank World Development Indicators series MS.MIL.XPND.ZS, based on the SIPRI Military Expenditure Database. Mean, median, quartiles, rankings and distribution bands are calculated from 161 latest non-empty observations, with the 144 2024 observations summarized separately.
All 161 country codes are matched to geographic centroids for the map, producing a 100% match. Larger points mark 2024 observations and smaller points earlier years; missing values are not converted to zero.
Frequently Asked Questions
Is military expenditure as a share of government spending the same as the GDP share?
No. The military-expenditure numerator can be the same, but the denominator is general government expenditure rather than GDP.
Does military expenditure mean arms purchases only?
No. SIPRI's definition also covers personnel, operations and maintenance, procurement, military R&D, construction and other current military activities.
Are all 161 observations from 2024?
No. 144 are from 2024 and 17 are latest available observations from 1999–2023.
Related Articles
Green Map creates custom-edited map images using open geographic data sources such as geoBoundaries, Natural Earth, OpenStreetMap, and government open data. These maps are edited visual materials, not raw data files, and are provided for education, documents, presentations, and graphic reference.