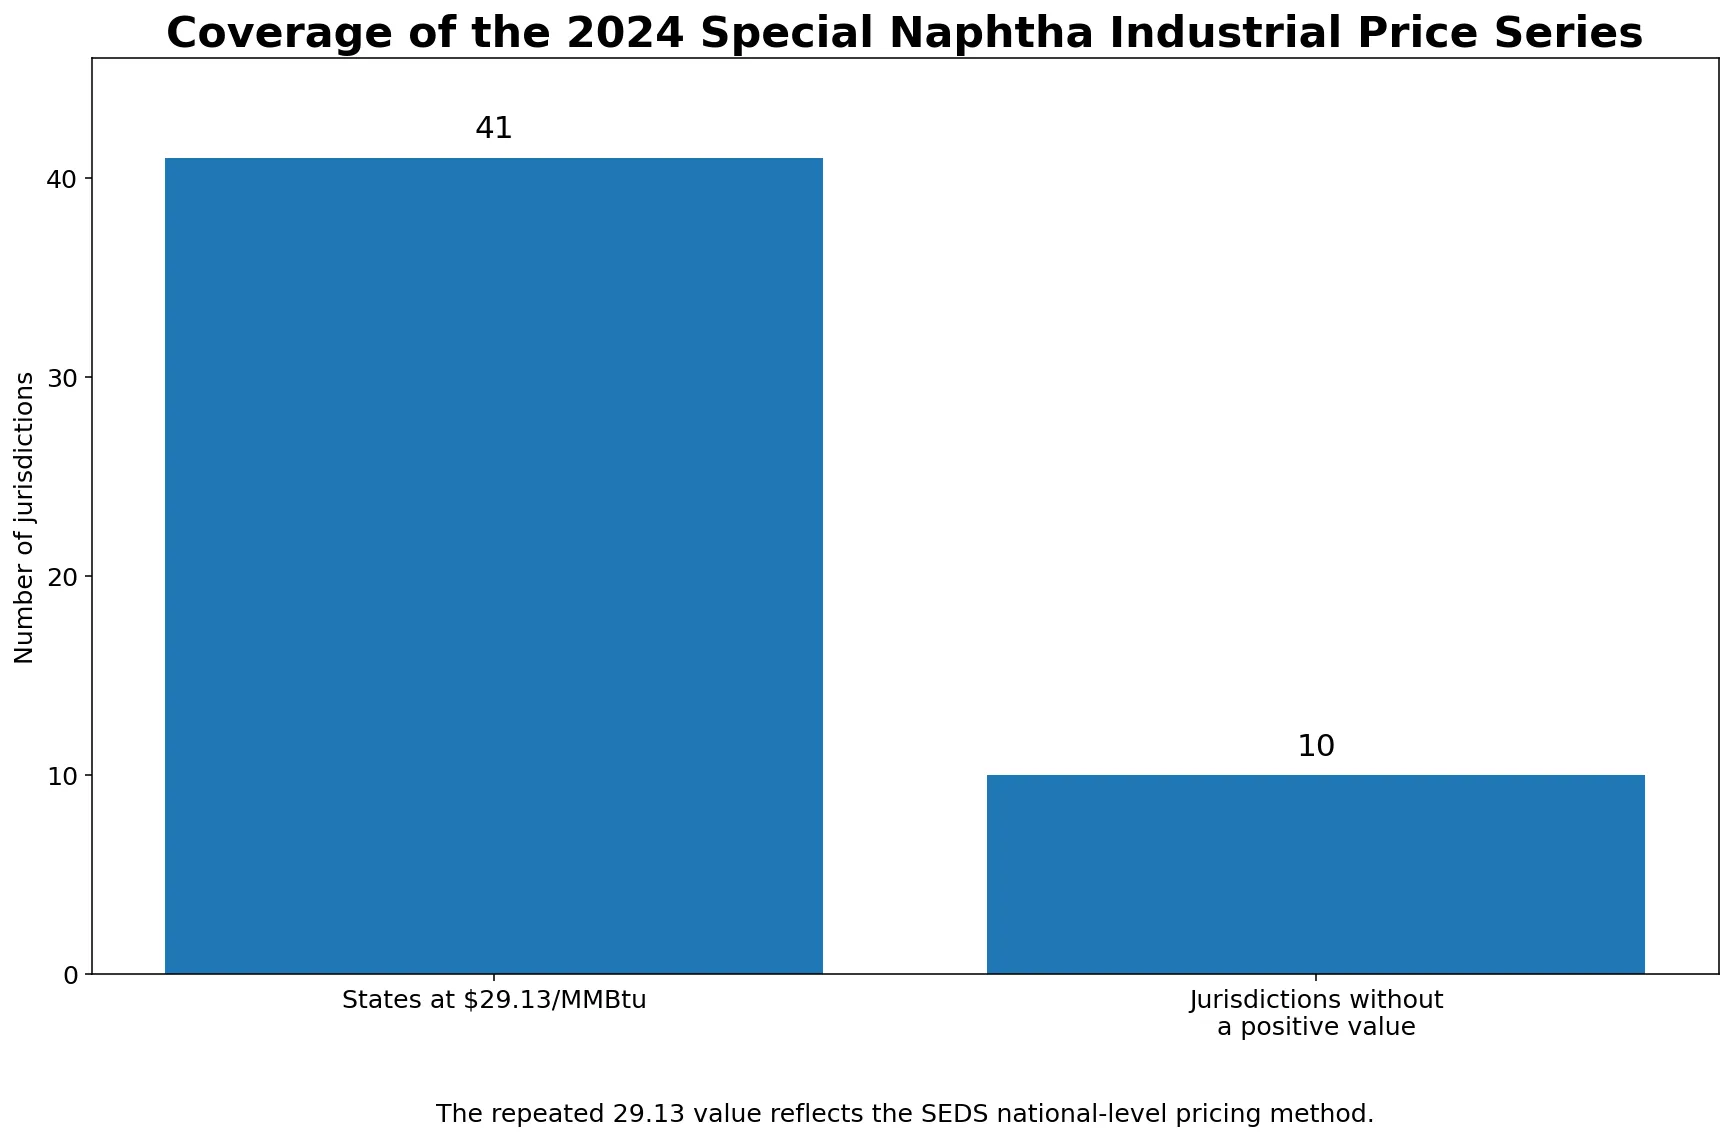
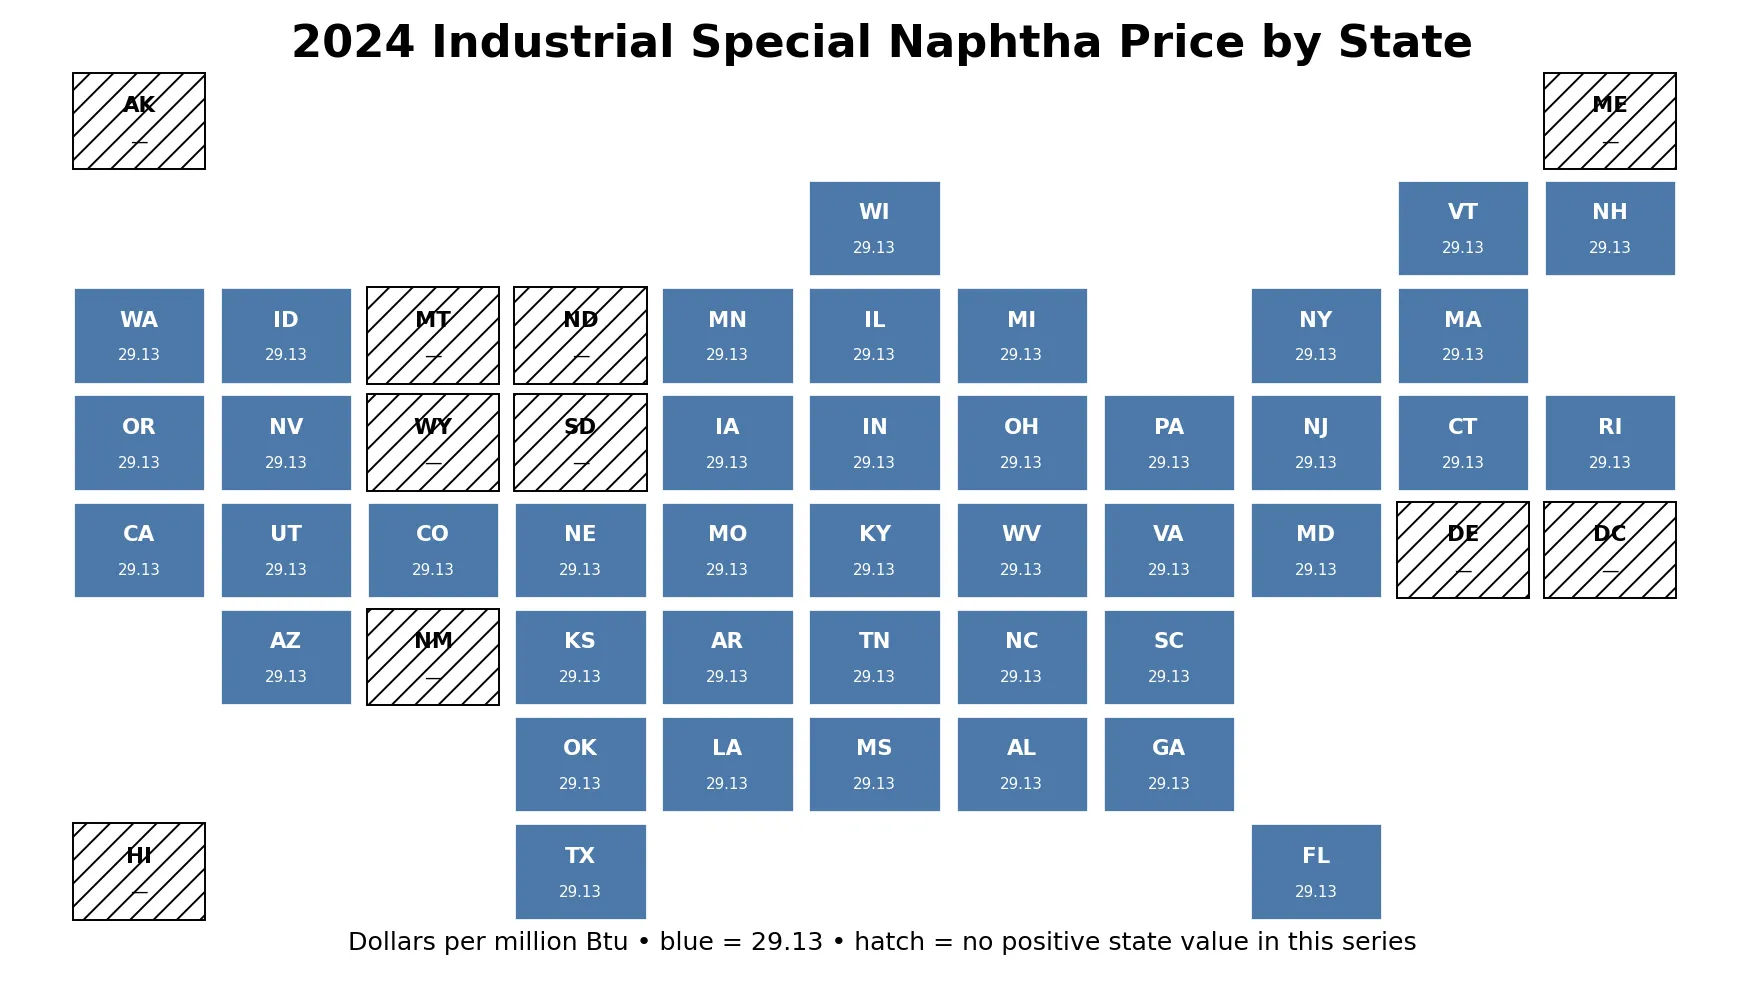
In 2024, the EIA State Energy Data System reports the same positive industrial special-naphtha price—$29.13 per million Btu—for 41 states. Alaska, Delaware, the District of Columbia, Hawaii, Maine, Montana, New Mexico, North Dakota, South Dakota, and Wyoming do not show a positive value in the same state series. The pattern is not a normal high-to-low state price ranking.
The reason is methodological. EIA explains that special naphthas are among a small group of “other petroleum products” for which SEDS develops national-level prices because state-level price information is not available. The repeated $29.13 value should therefore be read as the state presentation of a national pricing method, not as evidence that 41 independent state markets happened to clear at exactly the same price.
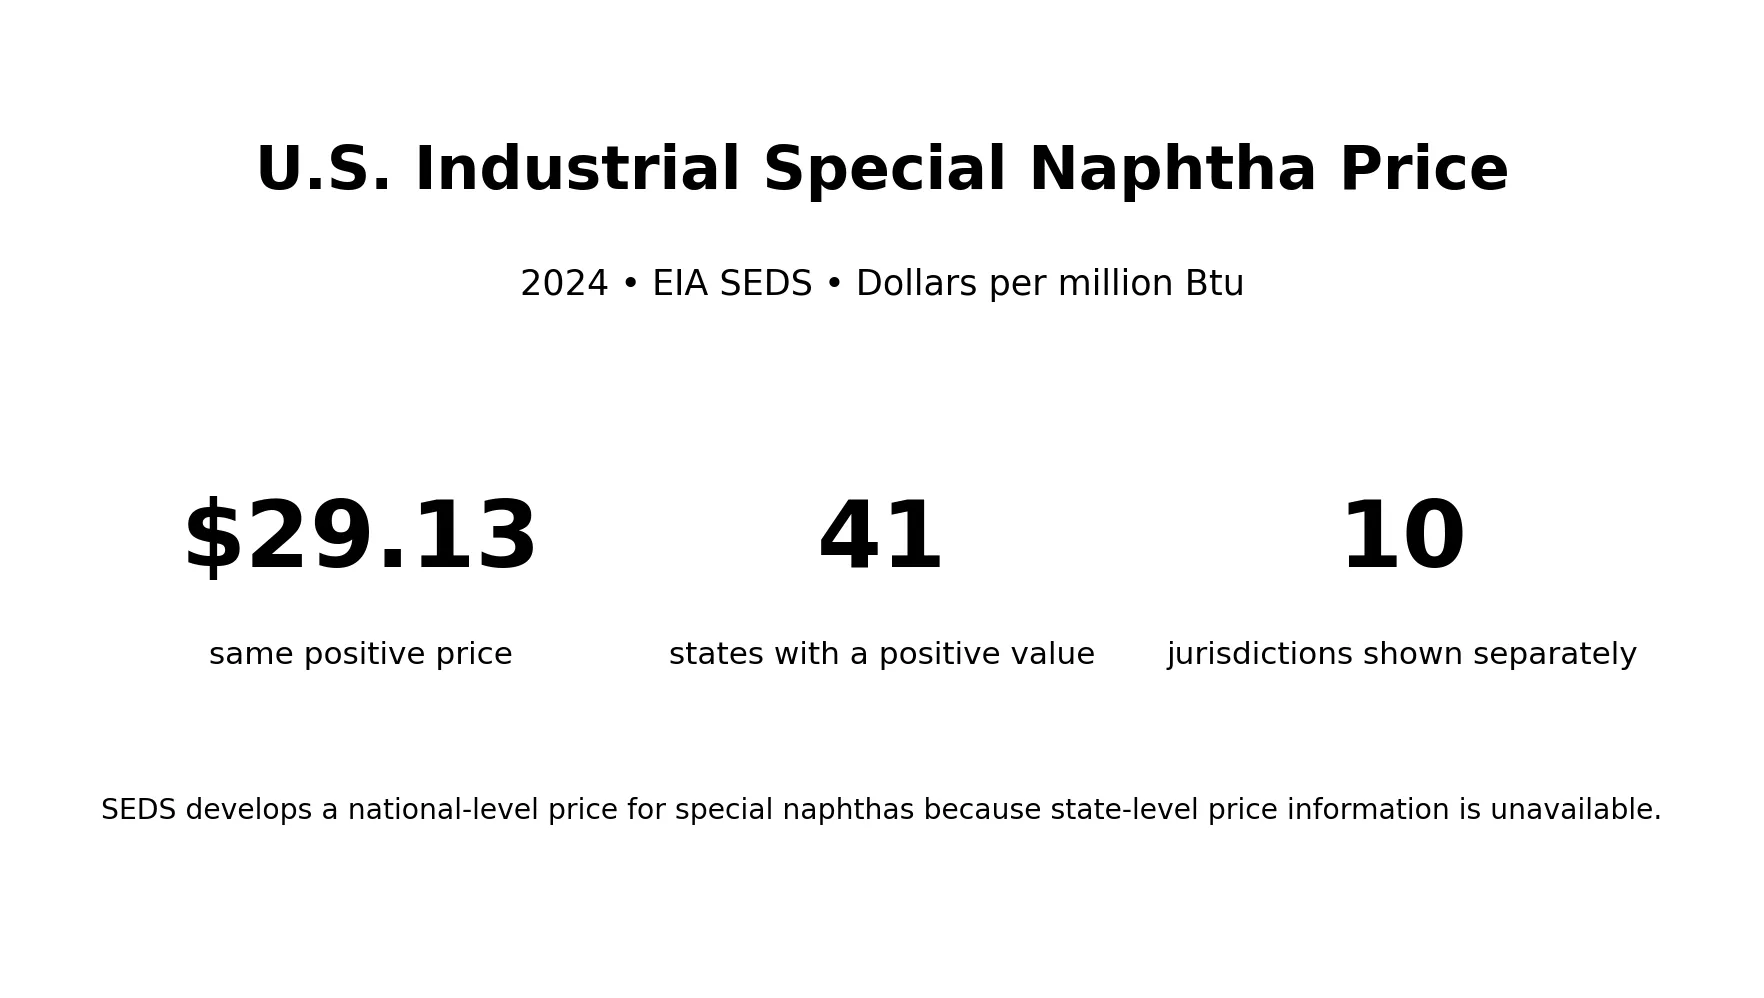
Table of Contents
What special naphthas are used for
Special naphthas are not simply another name for retail motor gasoline. EIA’s petroleum consumption documentation describes them as products used for paint and varnish thinners, dry-cleaning liquids, and solvents. In SEDS, special-naphtha consumption is assigned to the industrial sector, and industrial consumption is defined as equal to total special-naphtha consumption.
The price unit is dollars per million Btu, which places the product on a common energy-content basis. It is not a posted price per gallon or barrel, nor is it a quote for a specific solvent grade or industrial contract. EIA assumes a heat content of 5.248 million Btu per barrel when converting special-naphtha consumption to Btu, but the price series discussed here is already expressed on the million-Btu basis.
That distinction matters because the state data are easier to misread than a typical commodity price table. A repeated thermal-unit price does not tell us that every plant paid the same invoice price. It tells us how SEDS represents this petroleum product within its standardized state energy accounting framework.
Why 41 states all show $29.13 per million Btu
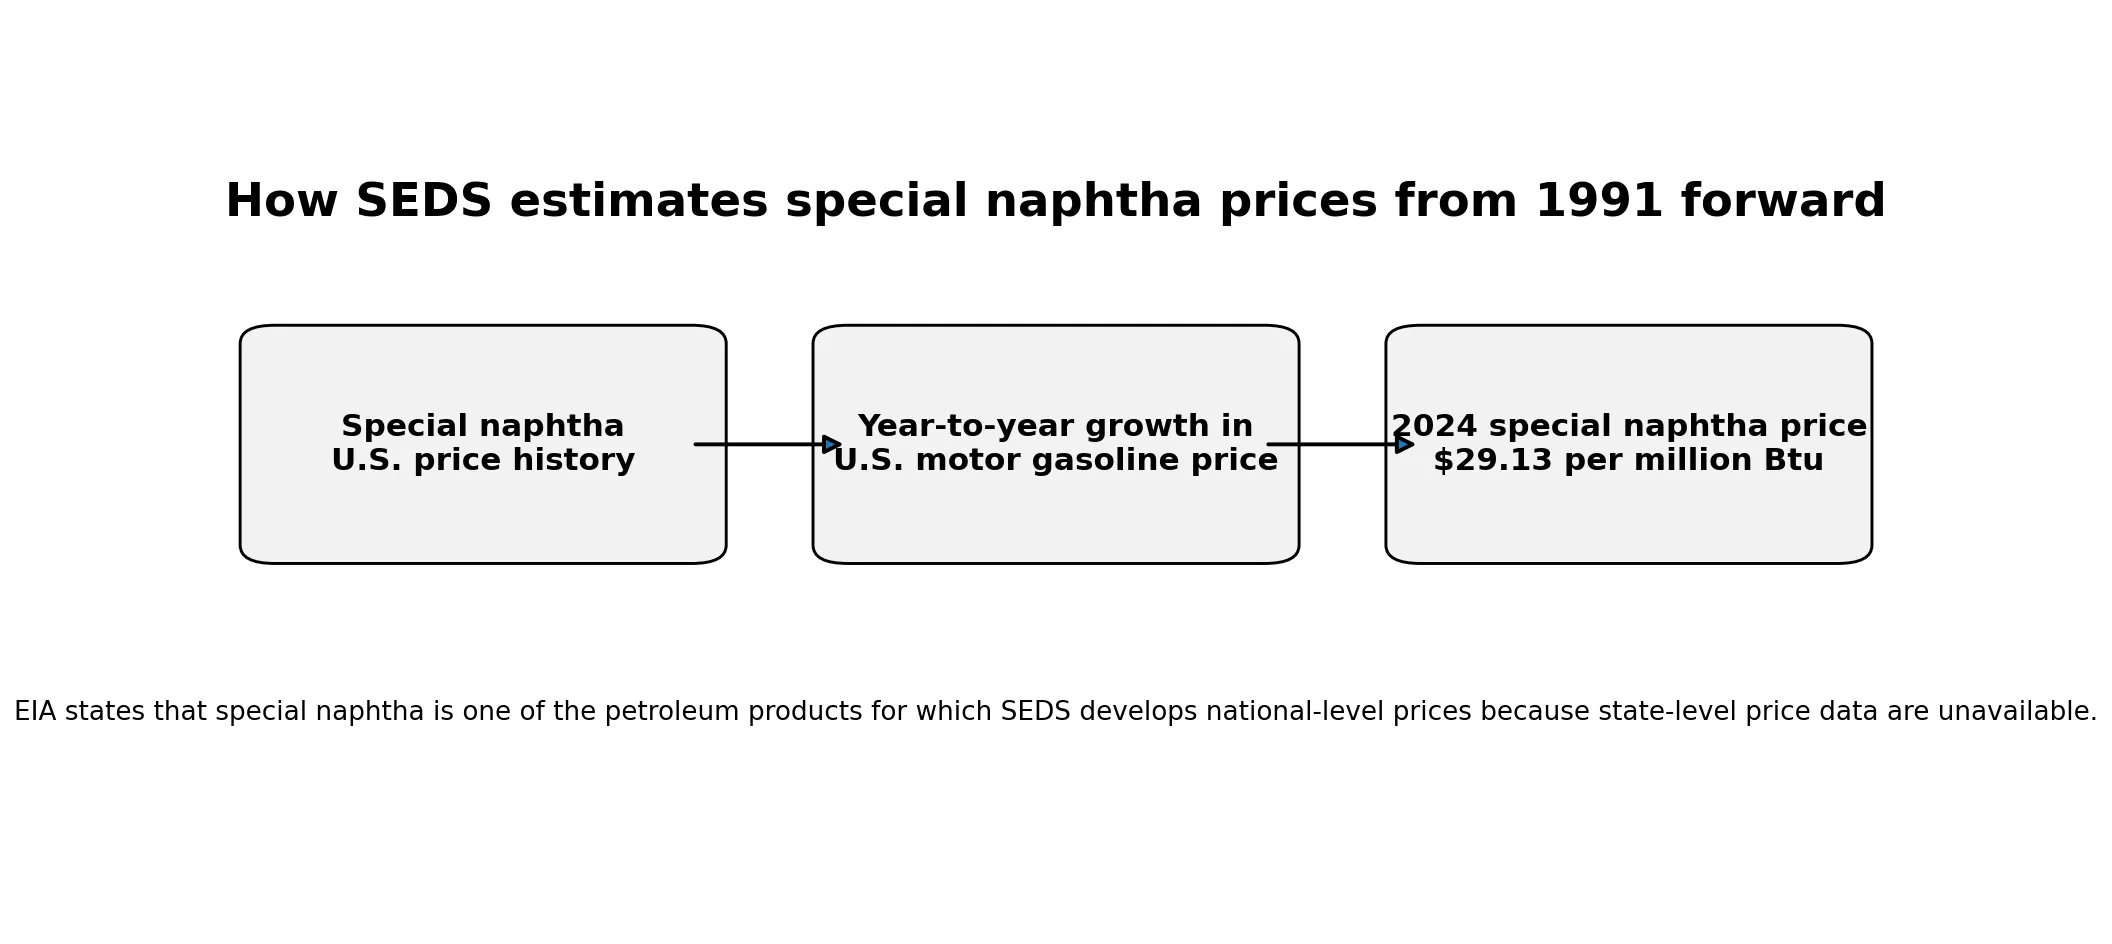
SEDS documentation states that state-level price information is not available for six of the petroleum products in the “other petroleum products” group, including special naphthas. SEDS therefore develops national-level prices for those products. For special naphthas from 1991 forward, the system estimates each year’s price by applying the year-over-year growth rate of the average U.S. motor-gasoline price to the previous year’s special-naphtha price.
That methodology explains the uniform 2024 result. The 41 positive state entries are all $29.13 per million Btu because the underlying price is national rather than a separately observed price for each state. A state map with many identical values is therefore an expected outcome, not by itself a sign of duplicated or faulty data.
EIA also notes that taxes are not included in the price estimates for these “other petroleum products,” which include special naphthas. The $29.13 figure should therefore not be treated as a final tax-inclusive retail price. It is an energy-accounting price estimate designed for consistent SEDS consumption and expenditure calculations.
Why the ten 0.00 entries are not zero-dollar market prices
Alaska, Delaware, the District of Columbia, Hawaii, Maine, Montana, New Mexico, North Dakota, South Dakota, and Wyoming appear as 0.00 in this 2024 state series. Given the national-level pricing method, ranking those jurisdictions as places where special naphtha cost nothing would be misleading.
For that reason, the map and table separate those ten jurisdictions instead of placing them at the bottom of a price ranking. Including the zeros in a simple 51-jurisdiction mean would produce about $23.42 per million Btu, but that average would describe the coding pattern rather than the price method. Among the 41 positive entries, there is no price dispersion: every value is $29.13.
The map shows coverage, not a geographic price gradient
Most state energy price maps are useful because colors reveal meaningful high- and low-price regions. This series is different. Since all 41 positive values are identical, the meaningful visual distinction is between states showing $29.13 and jurisdictions without a positive value in the series.
Using multiple color bins for the 41 identical states would imply geographic variation that is not present in the data. A single color for $29.13 and a separate hatch for the ten other jurisdictions is more faithful to the underlying structure.
State consumption is allocated differently from the price
SEDS does create state estimates for special-naphtha consumption. EIA allocates U.S. special-naphtha consumption to states in proportion to the value of shipments for paint and allied products manufacturing. The system then converts the physical-unit consumption to Btu using the assumed heat content.
That means state consumption can vary even when the price does not. Two states may both carry the $29.13 per million Btu price but have very different special-naphtha consumption and therefore different expenditures. Price, consumption, and expenditure are separate quantities and should not be substituted for one another.
The 2024 petroleum consumption technical notes describe the state allocation of special-naphtha consumption. The 2024 petroleum price and expenditure technical notes explain that SEDS develops national-level prices for special naphthas and several related petroleum products.
Complete table for all 51 jurisdictions
The table below shows the 2024 industrial special-naphtha price series for all 50 states and the District of Columbia. The main point is the uniform $29.13 value across 41 states and the separate treatment of the ten jurisdictions without a positive value.
| State or jurisdiction | Code | Year | Price ($/MMBtu) |
|---|---|---|---|
| Alabama | AL | 2024 | 29.13 |
| Arizona | AZ | 2024 | 29.13 |
| Arkansas | AR | 2024 | 29.13 |
| California | CA | 2024 | 29.13 |
| Colorado | CO | 2024 | 29.13 |
| Connecticut | CT | 2024 | 29.13 |
| Florida | FL | 2024 | 29.13 |
| Georgia | GA | 2024 | 29.13 |
| Idaho | ID | 2024 | 29.13 |
| Illinois | IL | 2024 | 29.13 |
| Indiana | IN | 2024 | 29.13 |
| Iowa | IA | 2024 | 29.13 |
| Kansas | KS | 2024 | 29.13 |
| Kentucky | KY | 2024 | 29.13 |
| Louisiana | LA | 2024 | 29.13 |
| Maryland | MD | 2024 | 29.13 |
| Massachusetts | MA | 2024 | 29.13 |
| Michigan | MI | 2024 | 29.13 |
| Minnesota | MN | 2024 | 29.13 |
| Mississippi | MS | 2024 | 29.13 |
| Missouri | MO | 2024 | 29.13 |
| Nebraska | NE | 2024 | 29.13 |
| Nevada | NV | 2024 | 29.13 |
| New Hampshire | NH | 2024 | 29.13 |
| New Jersey | NJ | 2024 | 29.13 |
| New York | NY | 2024 | 29.13 |
| North Carolina | NC | 2024 | 29.13 |
| Ohio | OH | 2024 | 29.13 |
| Oklahoma | OK | 2024 | 29.13 |
| Oregon | OR | 2024 | 29.13 |
| Pennsylvania | PA | 2024 | 29.13 |
| Rhode Island | RI | 2024 | 29.13 |
| South Carolina | SC | 2024 | 29.13 |
| Tennessee | TN | 2024 | 29.13 |
| Texas | TX | 2024 | 29.13 |
| Utah | UT | 2024 | 29.13 |
| Vermont | VT | 2024 | 29.13 |
| Virginia | VA | 2024 | 29.13 |
| Washington | WA | 2024 | 29.13 |
| West Virginia | WV | 2024 | 29.13 |
| Wisconsin | WI | 2024 | 29.13 |
| Alaska | AK | 2024 | — |
| Delaware | DE | 2024 | — |
| District of Columbia | DC | 2024 | — |
| Hawaii | HI | 2024 | — |
| Maine | ME | 2024 | — |
| Montana | MT | 2024 | — |
| New Mexico | NM | 2024 | — |
| North Dakota | ND | 2024 | — |
| South Dakota | SD | 2024 | — |
| Wyoming | WY | 2024 | — |
What this indicator can and cannot tell you
The series is useful for understanding how SEDS represents special-naphtha prices in state energy accounts. It shows that the price methodology is national, that a state-by-state ranking is not meaningful among the positive values, and that the ten non-positive entries should not be interpreted as free fuel.
The series cannot reveal actual contract prices paid by individual manufacturers, distributor margins, freight differences, local taxes, or price differences among specific solvent grades. EIA explicitly notes the lack of state-level price information for this group of petroleum products. A true state-market price study would require a different source with transaction or sales data.
Sources: U.S. Energy Information Administration State Energy Data System, Prices and expenditures technical notes: petroleum, Special naphthas price methodology, and Consumption technical notes: petroleum.
Frequently Asked Questions
Why do 41 states have the same industrial special naphtha price in 2024?
EIA SEDS develops a national-level price for special naphthas because state-level price information is unavailable. The 41 positive state entries therefore all show $29.13 per million Btu.
Do the ten 0.00 entries mean special naphtha was free there?
No. Given the national-level pricing method, those entries should not be interpreted or ranked as real zero-dollar market prices.
What are special naphthas used for?
EIA describes special naphthas as products used for paint and varnish thinners, dry-cleaning liquids, and solvents. SEDS assigns their consumption to the industrial sector.
Does the $29.13 per million Btu estimate include taxes?
No. EIA states that taxes are not included in the price estimates for the relevant group of other petroleum products, including special naphthas.
Related Articles
Green Map creates custom-edited map images using open geographic data sources such as geoBoundaries, Natural Earth, OpenStreetMap, and government open data. These maps are edited visual materials, not raw data files, and are provided for education, documents, presentations, and graphic reference.