U.S. Energy Information Administration SEDS data report the 2024 industrial-sector average price for all petroleum products for all 50 states plus the District of Columbia. The unit is dollars per million Btu rather than dollars per gallon. Across the 51 jurisdictions, the simple mean is $20.93/MMBtu and the median $21.58/MMBtu. California is highest at $29.01/MMBtu and Texas lowest at $10.97/MMBtu.
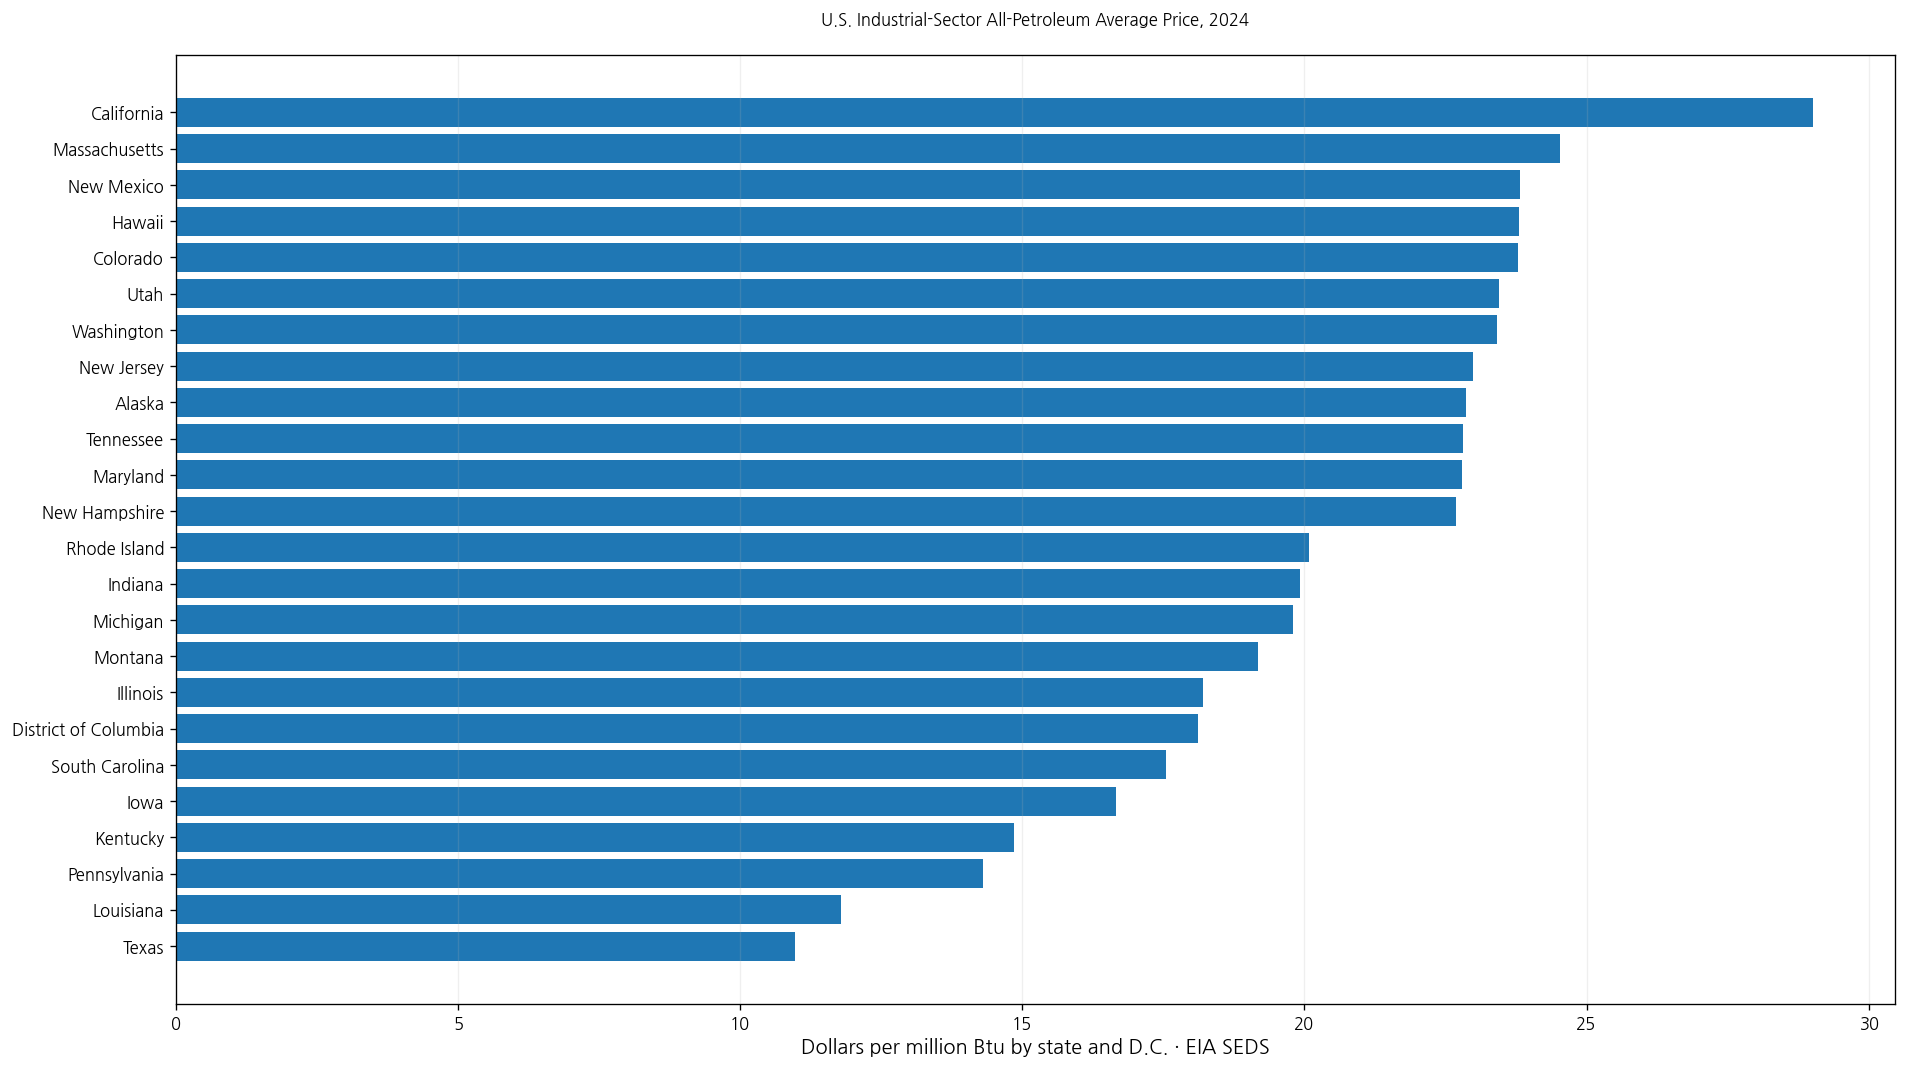
Table of Contents
What this indicator measures
The series is titled All petroleum products average price in the industrial sector. It combines petroleum products used in the industrial sector into a common average energy price, allowing states to be compared on a dollars-per-energy basis.
The industrial sector is distinct from residential, commercial, transportation, and electric-power sectors in SEDS. The value should therefore not be read as a statewide retail gasoline price or as the average price paid by all petroleum consumers.
Dollars per million Btu is different from dollars per gallon
MMBtu means one million British thermal units. Different petroleum products contain different amounts of energy per physical unit, so dollars per gallon alone cannot directly compare the price of a unit of energy across products.
A California value of $29.01/MMBtu does not mean every industrial petroleum product in California was purchased at the same unit price. It is the reported average-price measure for the all-petroleum-products industrial category.
The 51-jurisdiction mean is $20.93/MMBtu
The simple mean across the 50 states and D.C. is $20.93/MMBtu and the median is $21.58/MMBtu. The first quartile is $20.26 and the third quartile $22.61/MMBtu, putting the middle half roughly between $20.26 and $22.61.
40 jurisdictions are at or above $20/MMBtu, 18 are at or above $22, and 2 reach at least $24. At the lower end, 6 are below $18 and 4 are below $15.
California is highest at $29.01/MMBtu
California records $29.01/MMBtu in 2024. Massachusetts follows at $24.53, New Mexico at $23.82, Hawaii at $23.81, and Colorado at $23.79. Utah, Washington, New Jersey, Alaska, and Tennessee also appear near the top.
| 2024 rank | State/jurisdiction | Average price |
|---|---|---|
| 1 | California | $29.01/MMBtu |
| 2 | Massachusetts | $24.53/MMBtu |
| 3 | New Mexico | $23.82/MMBtu |
| 4 | Hawaii | $23.81/MMBtu |
| 5 | Colorado | $23.79/MMBtu |
| 6 | Utah | $23.45/MMBtu |
| 7 | Washington | $23.41/MMBtu |
| 8 | New Jersey | $22.98/MMBtu |
| 9 | Alaska | $22.87/MMBtu |
| 10 | Tennessee | $22.81/MMBtu |
| 11 | Maryland | $22.79/MMBtu |
| 12 | New Hampshire | $22.69/MMBtu |
| 13 | Oregon | $22.68/MMBtu |
| 14 | Nevada | $22.54/MMBtu |
| 15 | West Virginia | $22.39/MMBtu |
The data alone do not identify a single cause for California’s high value. Petroleum-product mix, supply logistics, taxes and fees, transportation costs, and the composition of industrial energy use can all affect the reported average.
Texas is lowest at $10.97/MMBtu
Texas records the lowest 2024 value at $10.97/MMBtu, followed by Louisiana at $11.78, Pennsylvania at $14.31, Kentucky at $14.85, and Iowa at $16.66. South Carolina, D.C., and Illinois are also below $19.
| Low-order position | State/jurisdiction | Average price |
|---|---|---|
| 1 | Texas | $10.97/MMBtu |
| 2 | Louisiana | $11.78/MMBtu |
| 3 | Pennsylvania | $14.31/MMBtu |
| 4 | Kentucky | $14.85/MMBtu |
| 5 | Iowa | $16.66/MMBtu |
| 6 | South Carolina | $17.55/MMBtu |
| 7 | District of Columbia | $18.11/MMBtu |
| 8 | Illinois | $18.21/MMBtu |
| 9 | Montana | $19.17/MMBtu |
| 10 | Michigan | $19.80/MMBtu |
| 11 | Indiana | $19.92/MMBtu |
| 12 | Rhode Island | $20.08/MMBtu |
| 13 | Mississippi | $20.16/MMBtu |
| 14 | Missouri | $20.35/MMBtu |
| 15 | Vermont | $20.60/MMBtu |
A low all-petroleum industrial average does not mean every petroleum product is cheaper in that state. The indicator aggregates the industrial-sector petroleum mix on an energy-price basis.
The high-low spread is $18.04/MMBtu
The difference between California and Texas is $18.04/MMBtu. The highest value is about 2.64 times the lowest. That spread is meaningful for the aggregate indicator, but it should not be translated directly into a gasoline or diesel price gap.
State industrial structures differ substantially. Refining, petrochemicals, manufacturing, mining, construction, and other activities can use different petroleum products and quantities.
Price is different from petroleum heat content
SEDS also publishes average heat-content measures for petroleum liquids. Heat content describes how much energy is contained in a barrel or another physical unit, while this indicator describes average dollars paid per million Btu.
A state with high average petroleum heat content does not necessarily have a high average petroleum price. They are separate physical and economic measurements.
Industrial-sector prices are different from electric-power-sector prices
Petroleum products consumed by industrial users can differ from those used by electric utilities, households, or transportation. Purchasing arrangements and product mixes can also differ by sector.
When comparing related EIA series, the sector, year, unit, and petroleum-product scope should all match. A difference across sectors is not automatically a data inconsistency.
All 51 values are from the same year
A major advantage of this dataset is complete same-year coverage: all 50 states and the District of Columbia have 2024 values. Rankings and distribution statistics therefore do not mix observation years.
The dataset does not, however, establish a time trend. Determining whether a state’s price rose or fell requires the same indicator for 2023, 2024, and other years.
The simple state mean is not the official U.S. average
The $20.93/MMBtu figure used here is an arithmetic mean of 51 jurisdiction values. States consume very different amounts of petroleum in the industrial sector, so the simple mean should not be assumed to equal an EIA U.S. aggregate.
A national average would require the appropriate consumption weights and the official EIA aggregation method. The simple mean here is used only to describe the state distribution.
Complete 2024 state list
The table below lists all 50 states and the District of Columbia alphabetically. Every row is from 2024 and there are no missing or zero values.
| State/jurisdiction | Code | Year | Industrial all-petroleum average price |
|---|---|---|---|
| Alabama | AL | 2024 | $21.38/MMBtu |
| Alaska | AK | 2024 | $22.87/MMBtu |
| Arizona | AZ | 2024 | $21.52/MMBtu |
| Arkansas | AR | 2024 | $20.97/MMBtu |
| California | CA | 2024 | $29.01/MMBtu |
| Colorado | CO | 2024 | $23.79/MMBtu |
| Connecticut | CT | 2024 | $21.58/MMBtu |
| Delaware | DE | 2024 | $20.73/MMBtu |
| District of Columbia | DC | 2024 | $18.11/MMBtu |
| Florida | FL | 2024 | $21.87/MMBtu |
| Georgia | GA | 2024 | $20.81/MMBtu |
| Hawaii | HI | 2024 | $23.81/MMBtu |
| Idaho | ID | 2024 | $22.03/MMBtu |
| Illinois | IL | 2024 | $18.21/MMBtu |
| Indiana | IN | 2024 | $19.92/MMBtu |
| Iowa | IA | 2024 | $16.66/MMBtu |
| Kansas | KS | 2024 | $21.57/MMBtu |
| Kentucky | KY | 2024 | $14.85/MMBtu |
| Louisiana | LA | 2024 | $11.78/MMBtu |
| Maine | ME | 2024 | $21.16/MMBtu |
| Maryland | MD | 2024 | $22.79/MMBtu |
| Massachusetts | MA | 2024 | $24.53/MMBtu |
| Michigan | MI | 2024 | $19.80/MMBtu |
| Minnesota | MN | 2024 | $21.98/MMBtu |
| Mississippi | MS | 2024 | $20.16/MMBtu |
| Missouri | MO | 2024 | $20.35/MMBtu |
| Montana | MT | 2024 | $19.17/MMBtu |
| Nebraska | NE | 2024 | $21.70/MMBtu |
| Nevada | NV | 2024 | $22.54/MMBtu |
| New Hampshire | NH | 2024 | $22.69/MMBtu |
| New Jersey | NJ | 2024 | $22.98/MMBtu |
| New Mexico | NM | 2024 | $23.82/MMBtu |
| New York | NY | 2024 | $20.71/MMBtu |
| North Carolina | NC | 2024 | $22.16/MMBtu |
| North Dakota | ND | 2024 | $21.86/MMBtu |
| Ohio | OH | 2024 | $21.80/MMBtu |
| Oklahoma | OK | 2024 | $22.19/MMBtu |
| Oregon | OR | 2024 | $22.68/MMBtu |
| Pennsylvania | PA | 2024 | $14.31/MMBtu |
| Rhode Island | RI | 2024 | $20.08/MMBtu |
| South Carolina | SC | 2024 | $17.55/MMBtu |
| South Dakota | SD | 2024 | $21.13/MMBtu |
| Tennessee | TN | 2024 | $22.81/MMBtu |
| Texas | TX | 2024 | $10.97/MMBtu |
| Utah | UT | 2024 | $23.45/MMBtu |
| Vermont | VT | 2024 | $20.60/MMBtu |
| Virginia | VA | 2024 | $21.82/MMBtu |
| Washington | WA | 2024 | $23.41/MMBtu |
| West Virginia | WV | 2024 | $22.39/MMBtu |
| Wisconsin | WI | 2024 | $21.63/MMBtu |
| Wyoming | WY | 2024 | $20.96/MMBtu |
How to interpret the comparison
First, the unit is dollars per million Btu, not retail dollars per gallon. Second, the indicator applies specifically to the industrial sector. Third, it averages all petroleum products rather than representing one fuel such as gasoline or distillate fuel oil.
Fourth, the 51-state arithmetic mean is not necessarily the official U.S. average. Fifth, causes of state price differences require additional evidence. Sixth, the same-year coverage supports cross-state comparison but not year-over-year trend analysis.
Source and calculation
The source is the U.S. Energy Information Administration State Energy Data System (SEDS), indicator BULK_3B0C67EE5E82D5438CD66818C784522B. Statistics and rankings use the 51 official 2024 observations for the 50 states and District of Columbia.
Frequently Asked Questions
Is this a retail gasoline price per gallon?
No. It is the industrial-sector average price for all petroleum products measured in dollars per million Btu.
Which jurisdiction is highest and lowest in 2024?
California is highest at $29.01/MMBtu and Texas is lowest at $10.97/MMBtu.
Is the simple mean of 51 jurisdictions the official U.S. average?
Not necessarily. State industrial petroleum consumption differs, so an official national average requires appropriate weighting and EIA aggregation.
Related Articles
Green Map creates custom-edited map images using open geographic data sources such as geoBoundaries, Natural Earth, OpenStreetMap, and government open data. These maps are edited visual materials, not raw data files, and are provided for education, documents, presentations, and graphic reference.