World Bank indicator BM.GSR.TRAN.ZS measures transport services as a percentage of service imports. Transport covers the carriage of people and objects as well as related supporting and auxiliary services, including postal and courier services. The denominator—service imports—consists of services supplied by nonresidents to residents. Among the 96 economies with a 2025 observation, the median transport share is 24.22% and the simple mean is 27.96%.
This is a composition ratio, not a measure of total imports, transport-sector output, logistics performance or freight costs. Two economies can import the same dollar amount of transport services and still have very different percentages if travel, finance, telecommunications, professional services and other service imports differ in size. The denominator is therefore as important as the transport-services numerator.
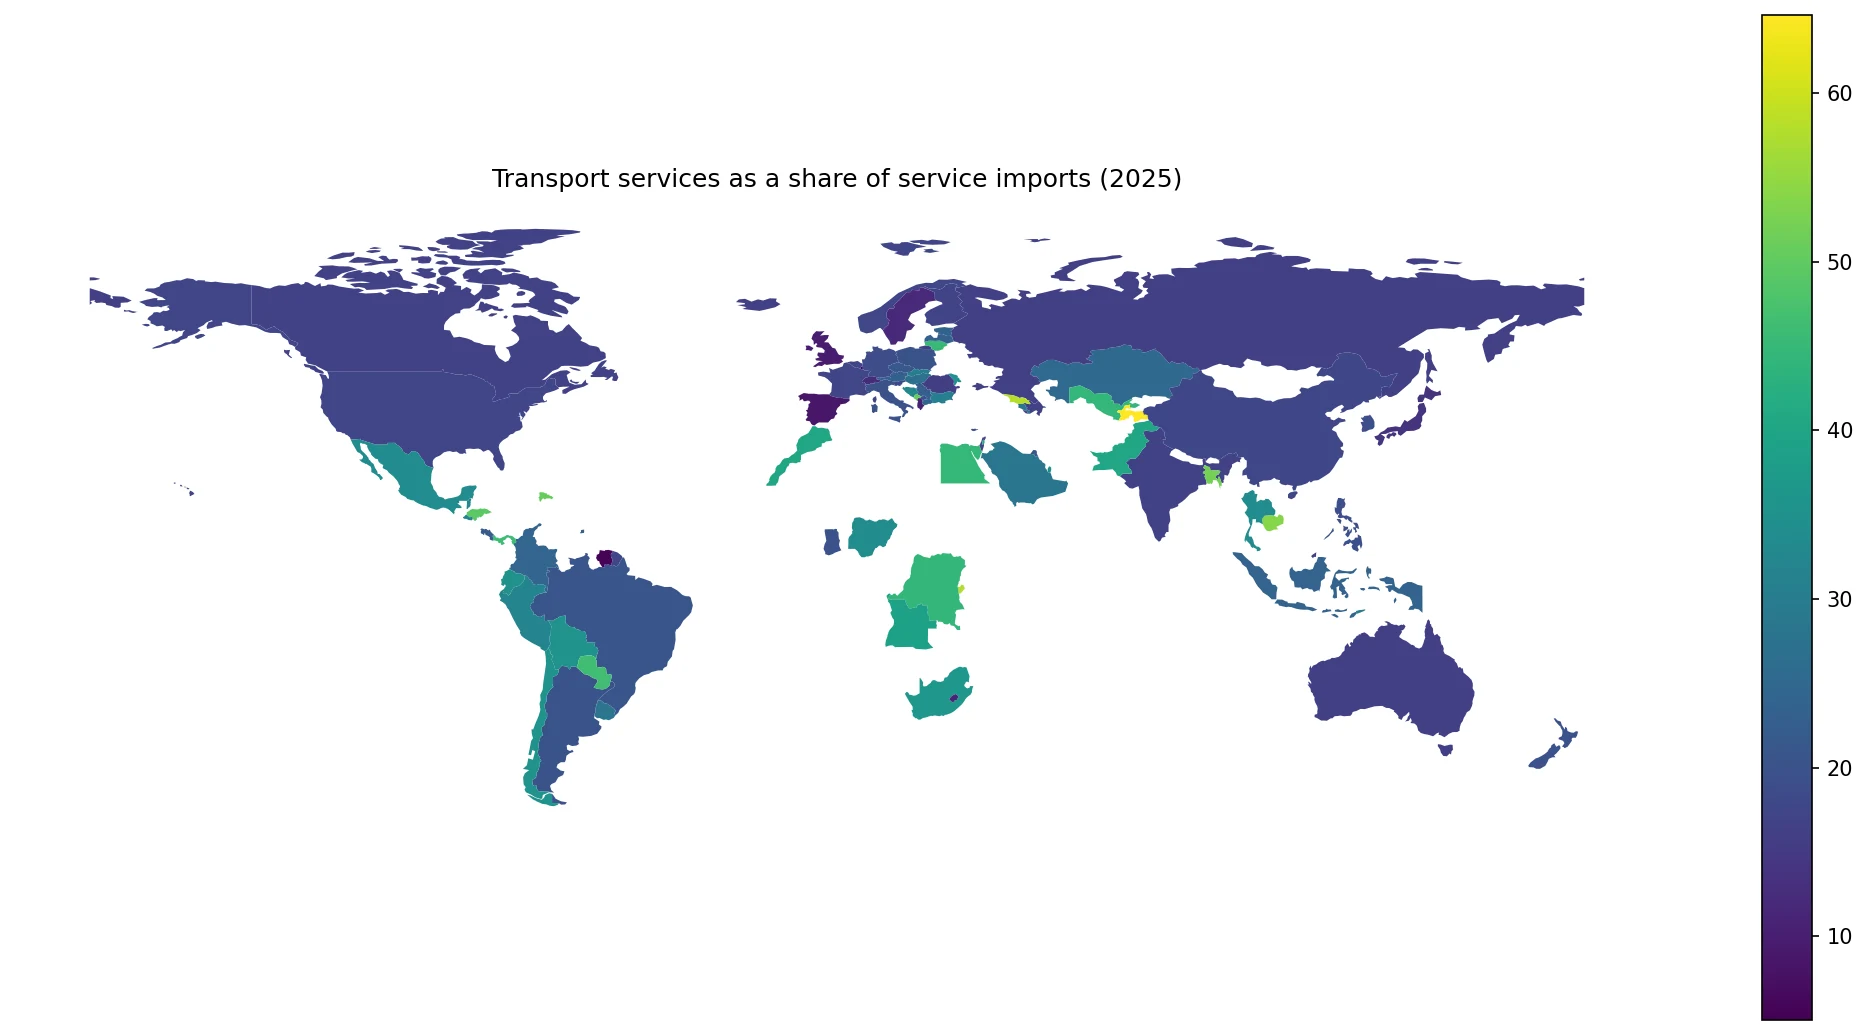
Table of Contents
The indicator describes the composition of service imports
A value of 30% means that transport services account for roughly three tenths of the economy’s recorded service imports. International passenger and freight transport supplied by nonresident carriers can contribute to the category, along with supporting and auxiliary services. Balance-of-payments classification rules determine the exact treatment of transactions, so the ratio should be read as an official services-trade measure rather than a general estimate of every transport-related expense.
World Bank metadata state that transport services include the carriage of people and objects, related support services, and postal and courier services. The underlying source is the IMF Balance of Payments Statistics Yearbook and data files. The indicator is therefore best interpreted as the role of transport within cross-border service purchases.
The 2025 median is 24.22%
The median across the 96 economies is 24.22%, while the mean is 27.96%. The middle half of observations lies between 18.07% and 34.97%. The mean is above the median because several economies record values above 50%, creating a longer upper tail.
Only 4 economies are below 10%. Another 29 are between 10% and 20%, 44 are between 20% and 40%, and 19 are at or above 40%. The largest group is in the 20–40% range, but the full distribution is broad enough that a single average hides substantial differences in service-import composition.
Tajikistan has the highest 2025 share at 64.62%
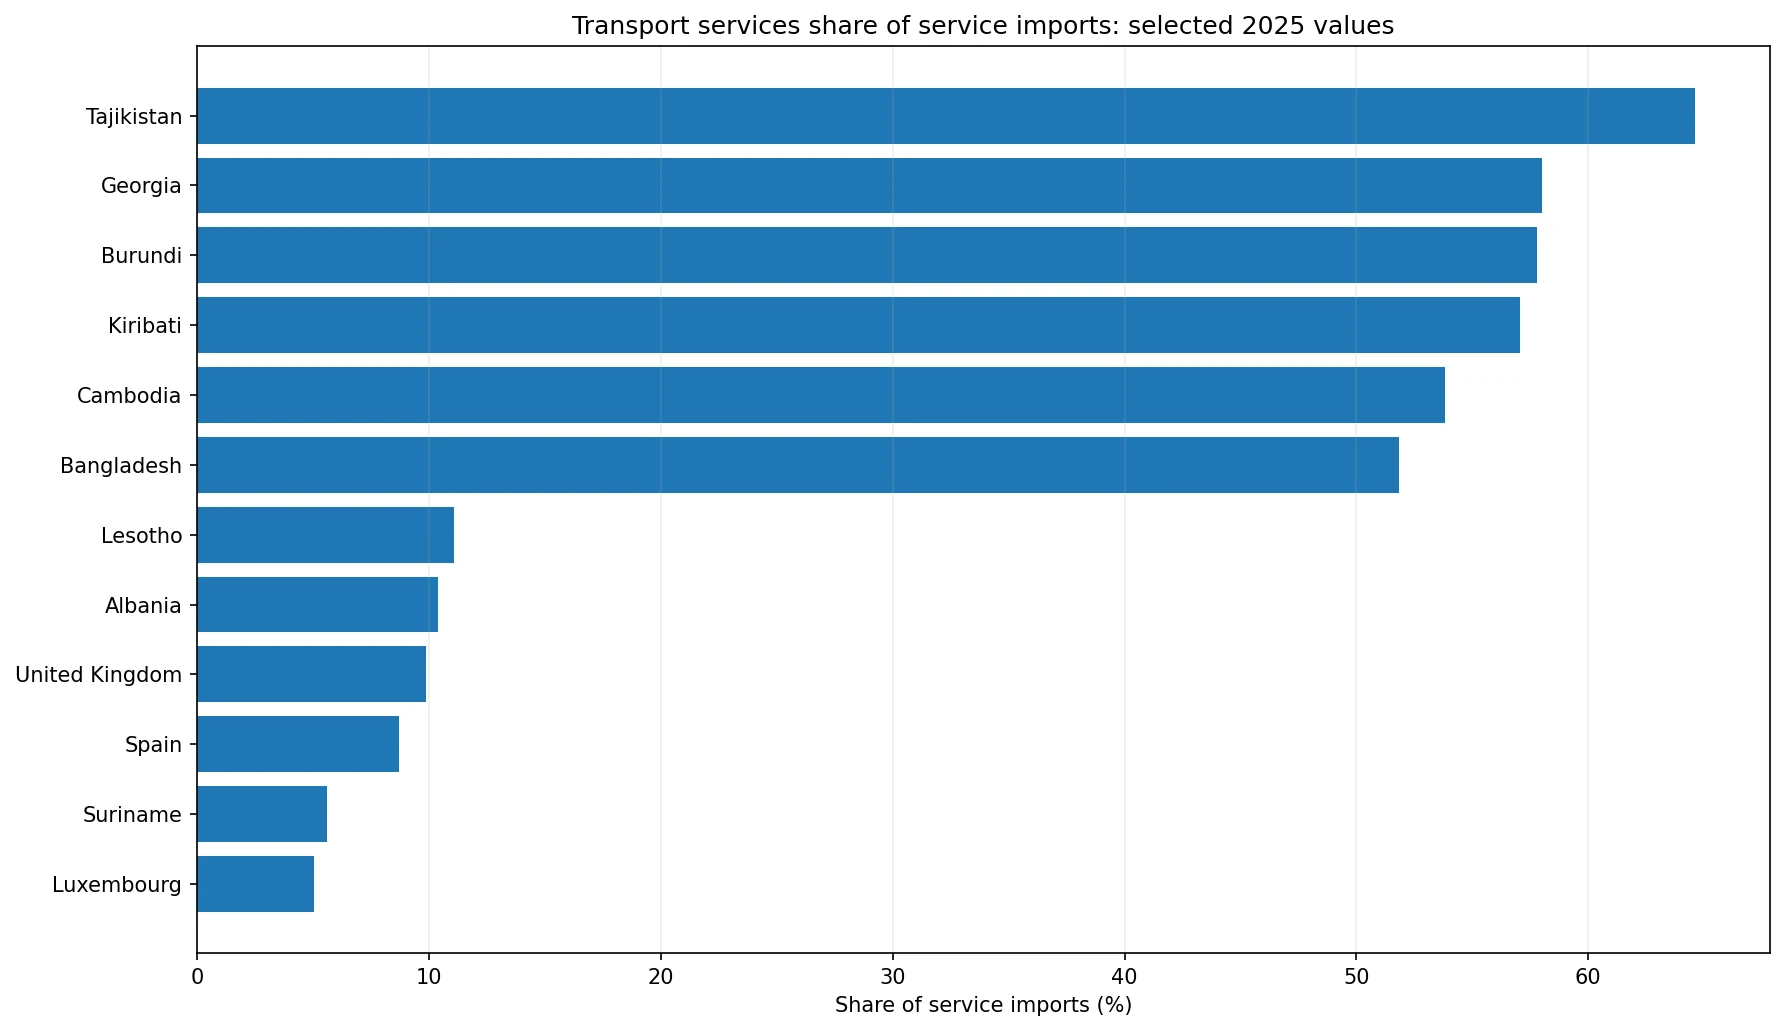
Tajikistan records 64.62%, followed by Georgia at 58.01%, Burundi at 57.80%, Kiribati at 57.07%, Cambodia at 53.80% and Bangladesh at 51.82%. The Dominican Republic is at 50.66% and Montenegro at 50.41%, while Honduras records 49.63% and Paraguay 46.41%.
These values should not be converted into a ranking of transport-sector development. A high share can reflect large transport-service imports, relatively small imports of other services, or both. Port and aviation dependence, trading patterns and the mix of travel, finance, digital and business-service imports may all matter, but the single ratio cannot identify which mechanism dominates in each economy.
| Economy | Year | Transport share of service imports |
|---|---|---|
| Tajikistan | 2025 | 64.62% |
| Georgia | 2025 | 58.01% |
| Burundi | 2025 | 57.80% |
| Kiribati | 2025 | 57.07% |
| Cambodia | 2025 | 53.80% |
| Bangladesh | 2025 | 51.82% |
| Dominican Republic | 2025 | 50.66% |
| Montenegro | 2025 | 50.41% |
| Honduras | 2025 | 49.63% |
| Paraguay | 2025 | 46.41% |
Luxembourg and Suriname are below 6%
Luxembourg has the lowest 2025 share at 5.03%, followed by Suriname at 5.62%, Spain at 8.72% and the United Kingdom at 9.86%. Albania records 10.40%, Lesotho 11.09%, Sweden 11.80%, Switzerland 12.44%, Japan 13.43% and Romania 15.65%.
A low share does not mean that an economy imports little transport service in absolute terms. A large denominator can produce a low percentage even when the transport-services bill is substantial. Dollar-value indicators are needed to compare absolute import scale, while BM.GSR.TRAN.ZS answers a narrower structural question.
| Economy | Year | Transport share of service imports |
|---|---|---|
| Luxembourg | 2025 | 5.03% |
| Suriname | 2025 | 5.62% |
| Spain | 2025 | 8.72% |
| United Kingdom | 2025 | 9.86% |
| Albania | 2025 | 10.40% |
| Lesotho | 2025 | 11.09% |
| Sweden | 2025 | 11.80% |
| Switzerland | 2025 | 12.44% |
| Japan | 2025 | 13.43% |
| Romania | 2025 | 15.65% |
Central Asia shows large differences among neighboring economies
Tajikistan is at 64.62%, Uzbekistan at 44.44% and Kazakhstan at 25.15%. Even within the same broad region, the share ranges from about one quarter to nearly two thirds. Geographic proximity therefore does not imply a common composition of imported services.
Similar transport routes or landlocked geography can be relevant context, but they do not determine the ratio on their own. The size of other service-import categories can change the denominator substantially. Spatial clusters on a map should therefore be treated as patterns to investigate rather than proof of a single geographic cause.
Several Central American economies have relatively high shares
Honduras records 49.63%, Panama 45.99%, El Salvador 31.52% and Costa Rica 21.74%. All four are above 20%, but the gap between the highest and lowest is more than twofold. Regional proximity does not eliminate differences in service-import structure.
It can be tempting to attribute Panama’s value directly to the canal or port activity, but this ratio alone cannot quantify that contribution. The transport-services subcomponents and absolute service-import amounts would be needed to explain the source of the percentage rather than merely describe it.
The western Balkans illustrate sharp neighboring contrasts
Montenegro is at 50.41%, Bosnia and Herzegovina at 32.64%, North Macedonia at 24.41%, Serbia at 22.49% and Albania at just 10.40%. The range from roughly 10% to 50% is a reminder that national service-import baskets can differ sharply even among nearby economies.
This is why the map is most useful as a composition map rather than a map of transport intensity. An economy with modest total service imports can have a high transport share, while a larger and more diversified importer can have a lower percentage even with greater transport spending in absolute terms.
South Asia also shows a strong denominator effect
Bangladesh records 51.82% and Pakistan 40.31%, while India is at 16.77%. All three participate heavily in international transport and trade, but transport occupies a very different share of their imported-service baskets. The ratio cannot be converted into a direct comparison of transport volumes.
Large economies may import substantial amounts of professional, digital, financial and other services, expanding the denominator. Transport-service spending can rise while its percentage falls if other service imports grow faster. The reverse can happen when other service imports contract.
The import share is different from the transport share of service exports
The import indicator uses services supplied by nonresidents to residents as its denominator. The export counterpart uses services supplied by residents to nonresidents. The transport category appears in both, but the direction of trade and the overall service basket are different. The two percentages should not be treated as interchangeable rankings.
An economy can be important both as a buyer and seller of transport services, or it can be much more specialized on one side. Comparing import and export shares can reveal that asymmetry, but a trade-balance or competitiveness assessment requires actual values rather than percentages alone.
The 199 latest values are not a 2025 cross-section
The source file contains the latest non-missing observation for 199 economies. Only 96 are from 2025 and 67 are from 2024. Another 20 are from 2020–2023, 11 from 2010–2019 and five from before 2010. The oldest latest observation in the file dates to 1988.
| Observation period | Economies | Use in this analysis |
|---|---|---|
| 2025 | 96 | Main same-year comparison |
| 2024 | 67 | Supplementary latest-value coverage |
| 2020–2023 | 20 | Latest values kept separate from current comparison |
| 2010–2019 | 11 | Older latest observations |
| Before 2010 | 5 | Historical latest observations only |
A latest-value map can be useful for broad geographic coverage, but it should display observation years. For same-year ranking and distribution statistics, the 2025 subset is cleaner. This article therefore keeps the 199-economy coverage separate from the 96-economy synchronized comparison.
What this ratio cannot tell us
BM.GSR.TRAN.ZS does not reveal the dollar value of transport-service imports, the freight cost embedded in goods imports, the size of the domestic transport industry, port throughput, airline passenger volumes or logistics performance. A high share is not evidence of inefficiency, and a low share is not evidence of superior logistics.
A fuller analysis would combine transport-service imports in value terms with total service imports, transport-service exports, goods trade, travel-service shares and other business-service categories. Those additions would separate absolute scale from composition and help explain why transport occupies a large or small part of the imported-service basket.
Source and interpretation limits
The source is World Bank World Development Indicators series BM.GSR.TRAN.ZS, drawing on the IMF Balance of Payments Statistics Yearbook and data files. Transport includes carriage of people and objects, supporting and auxiliary services, and postal and courier services. The ratio is expressed as a percentage of service imports supplied by nonresidents to residents.
Among the 96 economies observed in 2025, the median is 24.22% and the range runs from 5.03% to 64.62%. The central interpretation rule is simple: the denominator is service imports. Keeping that denominator visible prevents the percentage from being mistaken for transport volume, total imports or logistics performance.
Frequently Asked Questions
What does transport services as a share of service imports mean?
It is the percentage of total imported services supplied by nonresidents to residents that is classified as transport services.
Does a high share mean a more developed transport industry?
No. The percentage also depends on the size of other service imports and does not directly measure transport-sector size or logistics performance.
Can all 199 latest observations be compared as 2025 data?
No. Only 96 are from 2025; the rest are from 2024 or earlier and should remain separate in a same-year comparison.
Related Articles
Green Map creates custom-edited map images using open geographic data sources such as geoBoundaries, Natural Earth, OpenStreetMap, and government open data. These maps are edited visual materials, not raw data files, and are provided for education, documents, presentations, and graphic reference.