Fossil-fuel consumption for electricity generation varied widely across U.S. states in 2025. The 50-state total in the EIA electric-power operational series is 21141.04655 million MMBtu. Because one million MMBtu equals one trillion Btu, the same total can be read as 21141.04655 trillion Btu, or about 21.141 quadrillion Btu. Texas leads with 2712.31758 million MMBtu, followed by Florida at 1550.76556, Pennsylvania at 1222.10959, Ohio at 976.35734, and Indiana at 829.42489.
The series measures the heat content of fossil fuels consumed to generate electricity in the Electric Power sector. It is not a measure of fossil-fuel electricity generation in megawatthours, and it is not total state fossil-energy consumption across homes, factories, vehicles, and power plants. EIA identifies the field as Consumption of Fuels for Electricity Generation (BTUs), with the fossil-fuels aggregate and the Electric Power sector selected.
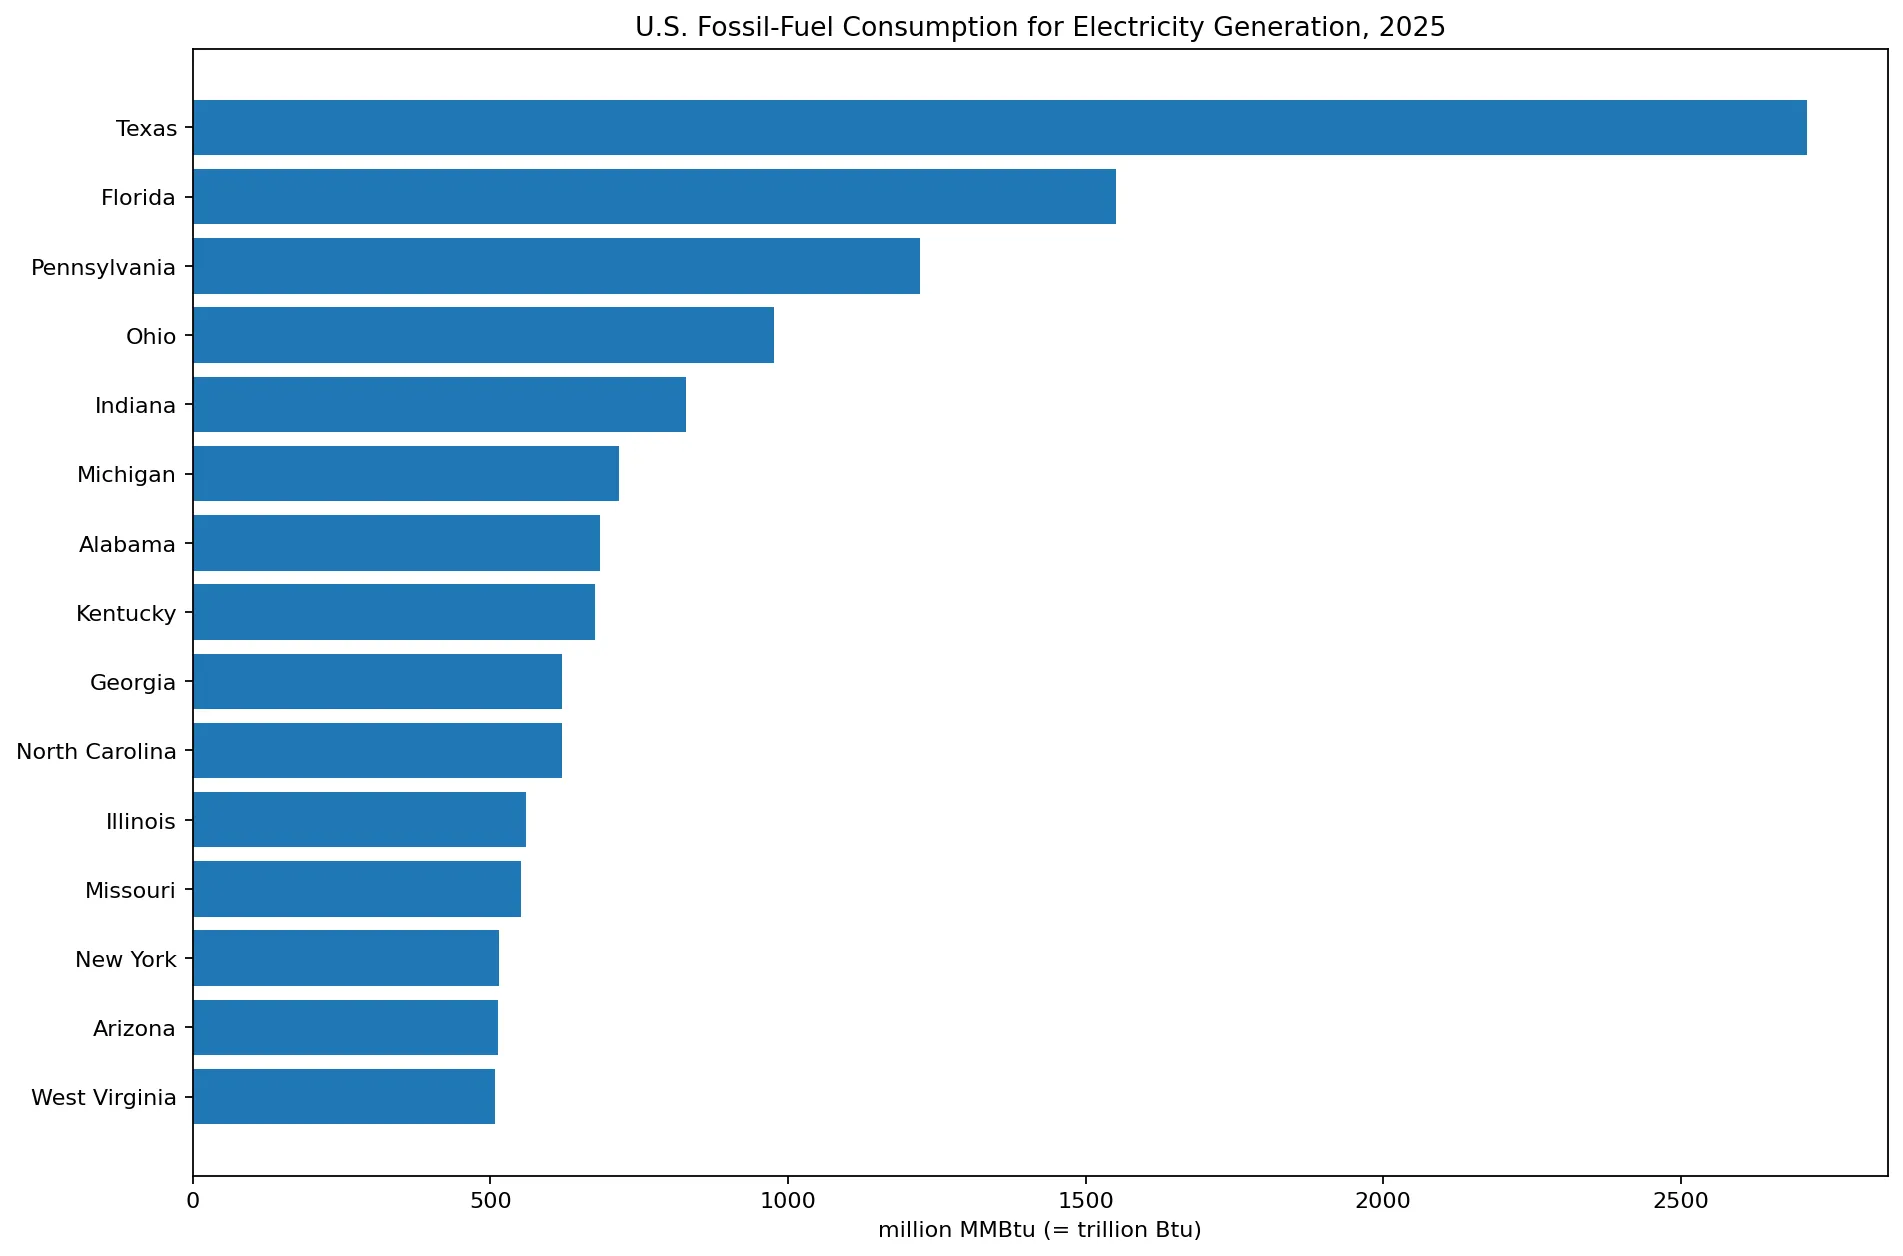
Table of Contents
What the metric measures
Electricity generation requires an energy input. For combustible fuels, EIA can report that input both in physical units and in heat-content units. Coal may be reported in tons, natural gas in cubic feet, and petroleum products in barrels, so those physical quantities cannot be added directly. Converting them to Btu creates a common energy measure that can be aggregated across fossil-fuel types and compared from state to state.
The Electric Power sector scope is equally important. The values in this dataset describe fossil fuel consumed for the purpose of generating electricity in that sector. They do not include every use of natural gas, coal, or petroleum in a state. Industrial boilers, household heating, commercial buildings, and transportation fuels belong to other energy accounts unless they are part of the electric-power generation activity represented here.
EIA electricity tables report fossil-fuel generation inputs across categories such as coal, natural gas, petroleum liquids, and petroleum coke. The FOS value used here is an aggregate, so it tells us the combined fossil-energy input rather than the contribution of each individual fuel. Explaining why one state is high therefore requires fuel-specific data if the goal is to distinguish gas-heavy, coal-heavy, or petroleum-heavy generation.
Texas leads with 2712.32 million MMBtu
Texas accounts for about 12.8% of the combined 50-state value. Florida is second with 1550.76556 million MMBtu and Pennsylvania third with 1222.10959. The first two states together represent about one fifth of the total, while the top three account for roughly 25.9%. Adding Ohio and Indiana brings the top-five share to about 34.5%.
Michigan, Alabama, Kentucky, Georgia, and North Carolina complete the top ten. Together, the ten largest states account for about 50.2% of all fossil-fuel energy consumed for electricity generation in the 50-state dataset. That concentration is substantial, but it should not be confused with a fossil-fuel share of each state’s electricity mix.
Absolute fuel input tends to be larger where the electric-power system is large, but population alone does not determine the ranking. California ranks below many smaller states in this particular measure, while Pennsylvania and Ohio rank near the top. State generation mix, local generating capacity, fuel choice, electricity trade, and plant utilization all matter. The present dataset describes the resulting absolute fossil-energy input rather than isolating those drivers.
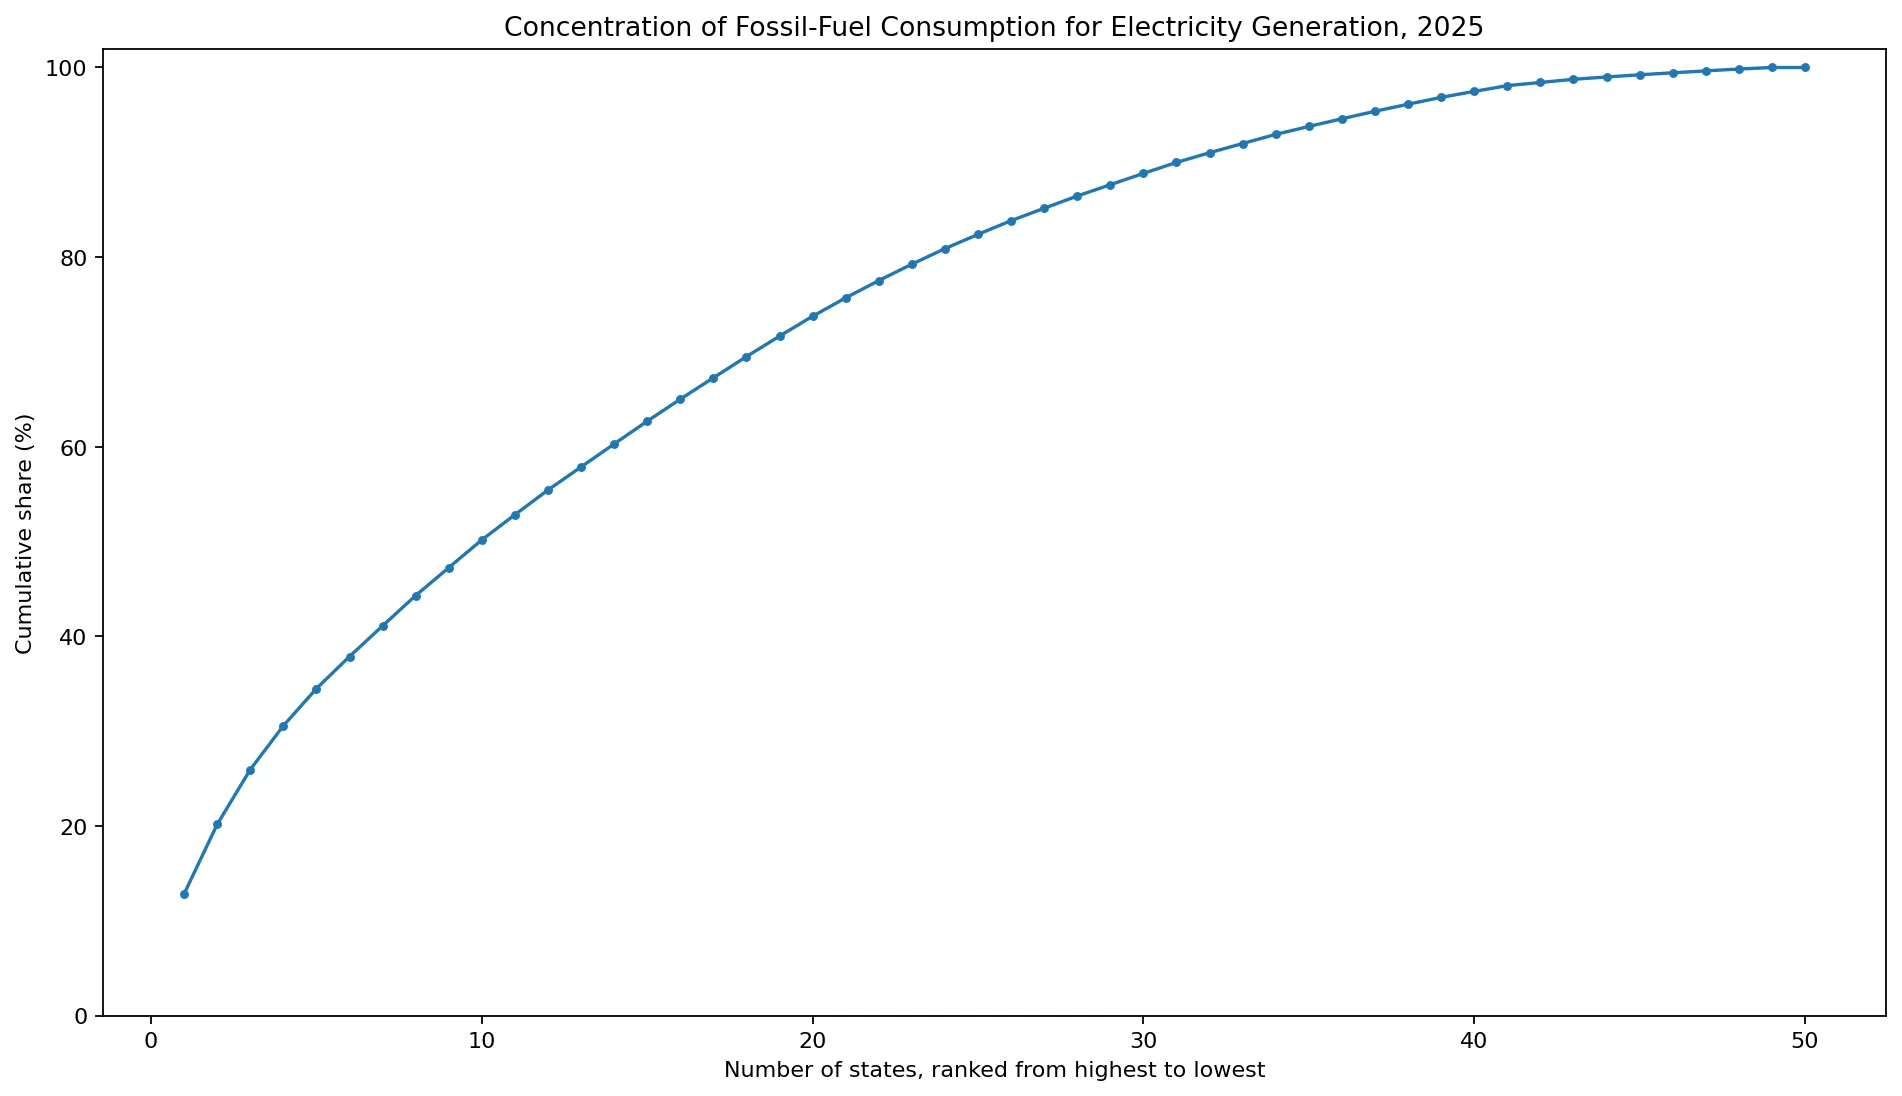
The top ten states account for about half of the total
Ranking the states from largest to smallest shows how quickly the national total accumulates. The top five account for 34.5% and the top ten for 50.2%. The remaining forty states share roughly the other half. This is useful context because a simple national average does not show where the fuel is actually being consumed.
Concentration is different from dependence. A state can consume a large absolute quantity of fossil fuel for electricity generation while also producing substantial nuclear or renewable electricity. To measure dependence, an analyst would need a denominator such as total generation, total generation fuel input, or total state electricity supply. This series provides the numerator-like absolute quantity only.
The median is lower than the mean
The unweighted mean across the 50 states is 422.82093 million MMBtu, while the median is 311.77745. The middle 50% of state observations lie between about 159.90 and 513.48 million MMBtu. The mean sits well above the median because a small number of very large observations, especially Texas and Florida, stretch the upper end of the distribution.
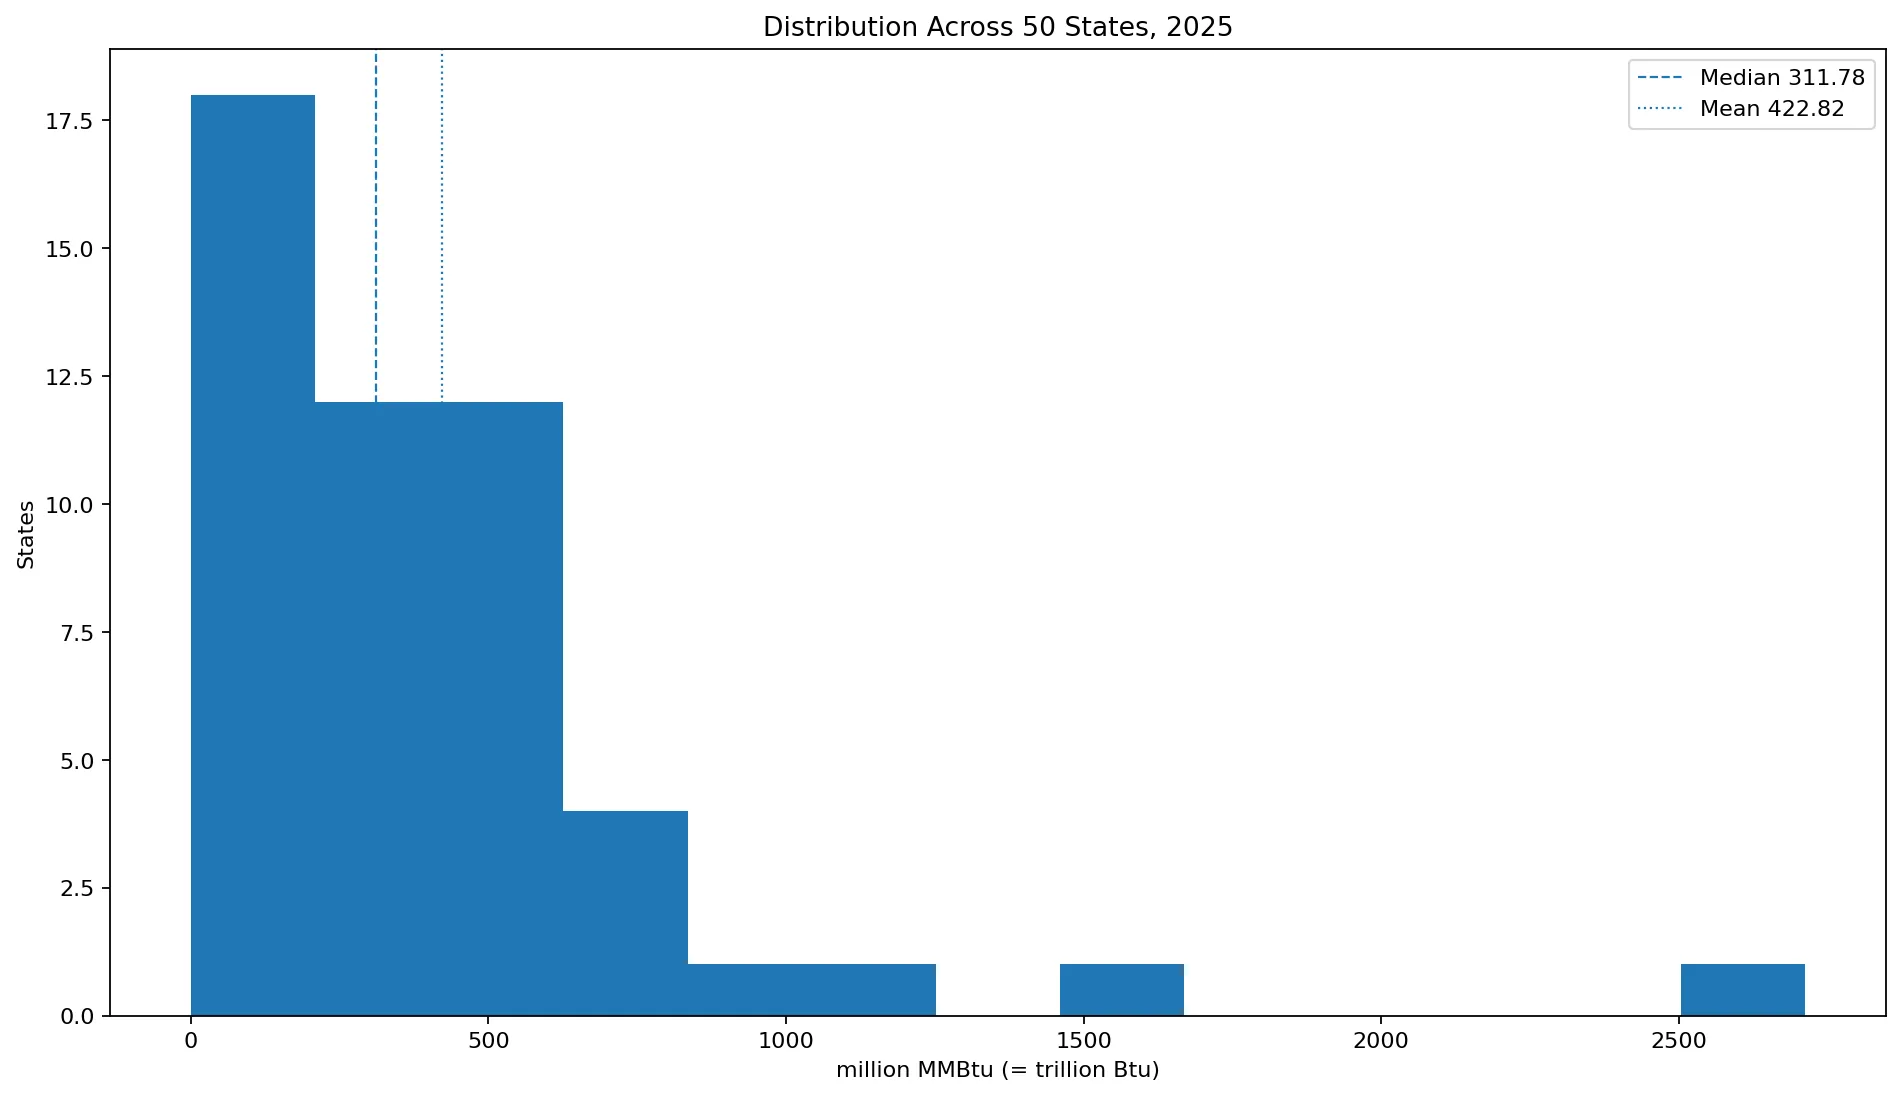
For a description of a typical state, the median is therefore more informative than the mean alone. For questions about national fuel demand, however, the sum and the shares of the leading states matter more. Mean, median, and cumulative concentration answer different questions and should not be substituted for one another.
Vermont is the smallest positive observation
Vermont records 0.11857 million MMBtu, by far the smallest state value in the dataset. Delaware follows at 34.42297, South Dakota at 41.20592, Alaska at 42.42543, New Hampshire at 44.21072, and Maine at 48.70300. All 50 states have positive observations; there are no zero values in this state slice.
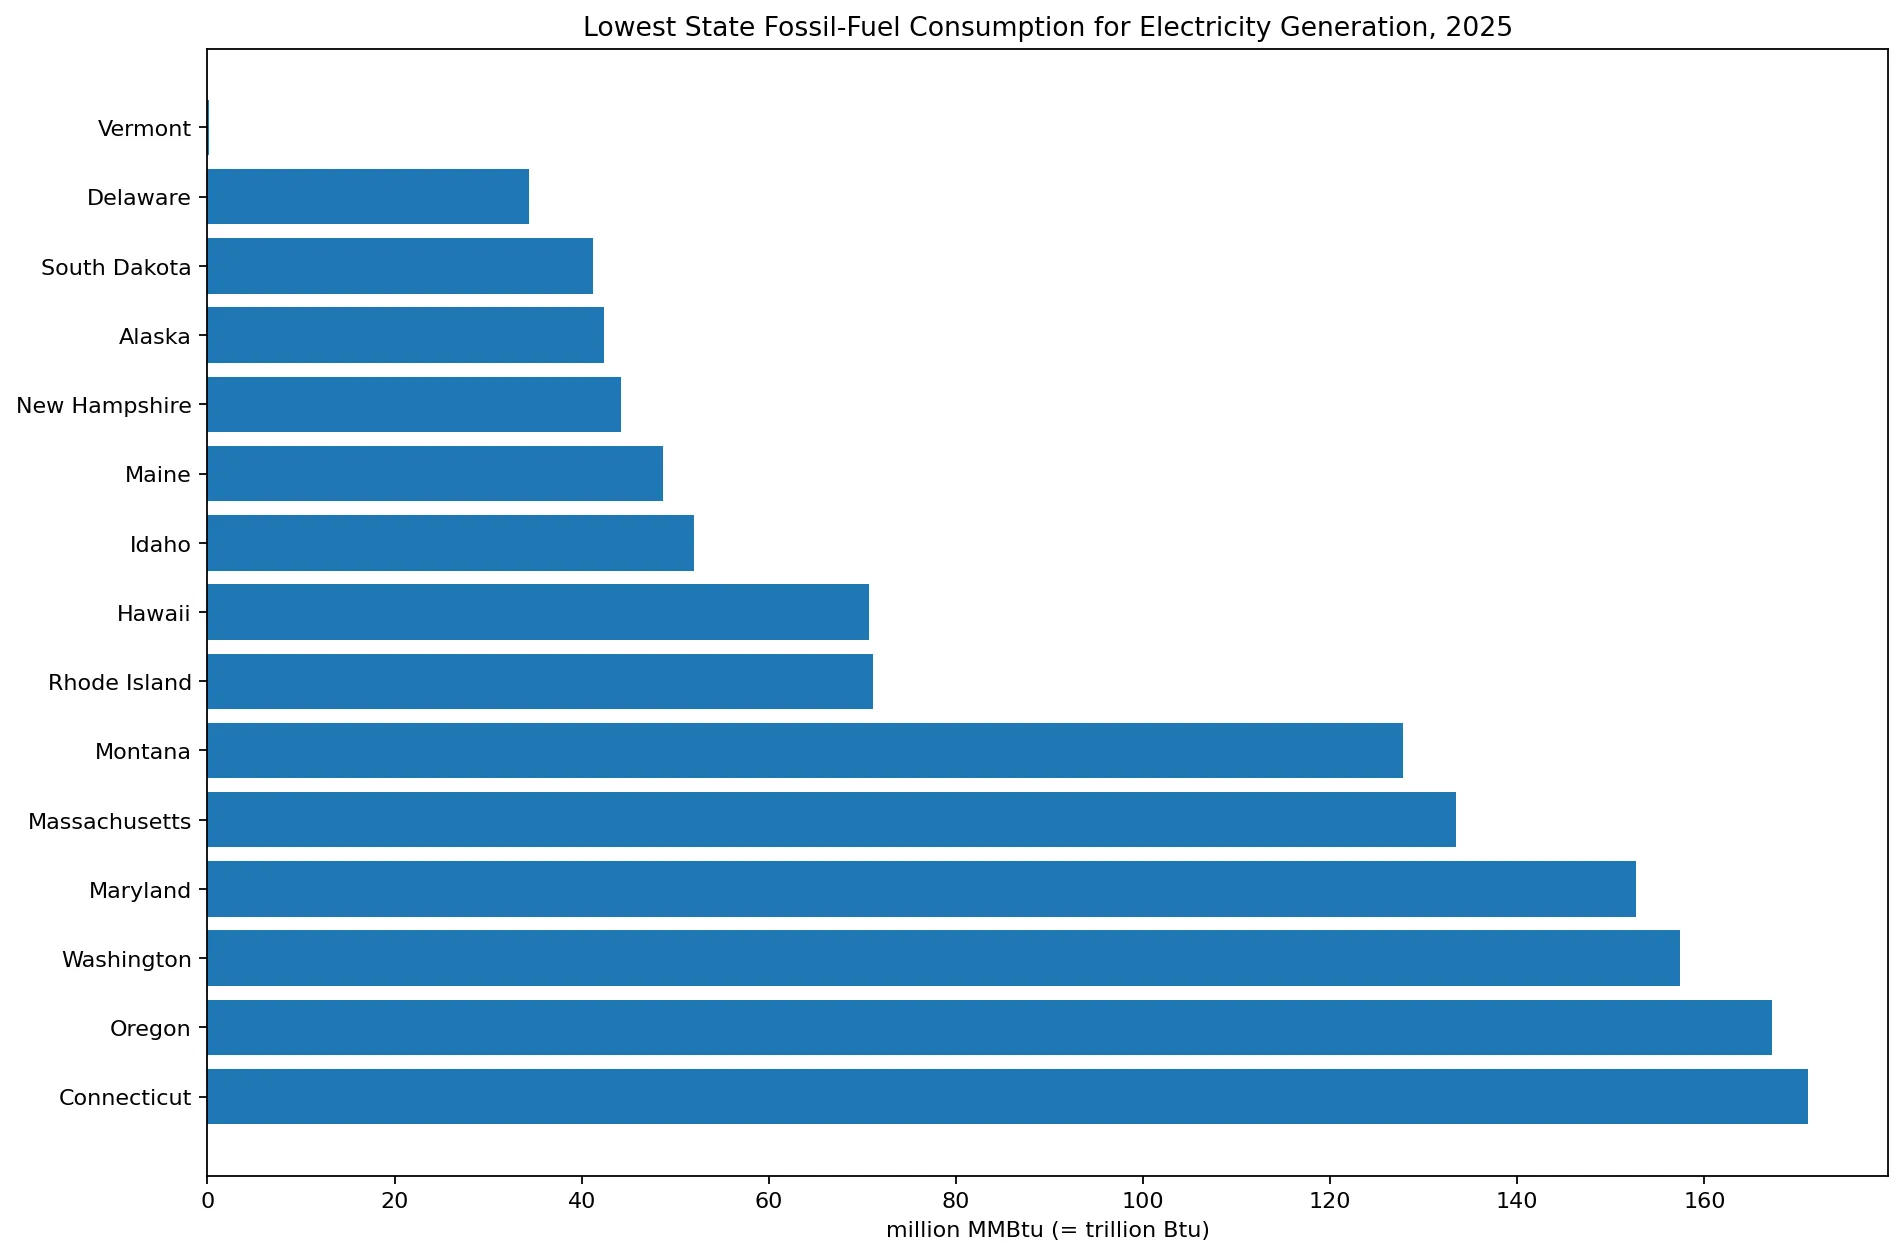
A low value does not mean low electricity consumption. A state may generate relatively little electricity inside its borders, import electricity, rely heavily on nuclear or renewable generation, or have only a small amount of fossil-fired capacity. The dataset cannot distinguish among those possibilities by itself. Its specific purpose is to quantify fossil-fuel heat input used for electricity generation.
How to read million MMBtu
MMBtu means one million British thermal units. The unit million MMBtu means one million units of MMBtu, which is 10 to the 12th power Btu, or one trillion Btu. Texas at 2712.31758 million MMBtu can therefore also be expressed as roughly 2712.32 trillion Btu or 2.712 quadrillion Btu. No energy conversion is being estimated in that restatement; only the unit label changes.
The table retains million MMBtu because that is the unit supplied with the EIA state series. The common heat-content unit is especially valuable for combining fuels that are otherwise measured in incompatible physical quantities. It does not reveal how many tons of coal or cubic feet of natural gas were used unless the fuel mix and heat content of each component are also known.
Fuel consumption is not the same as electricity generation
The amount of fuel energy entering a power plant and the amount of electricity leaving it are related but not identical. Thermal power plants lose part of the fuel’s energy as waste heat, and different technologies have different efficiencies. Two states could consume the same number of Btu of fossil fuel but generate different amounts of electricity if their plant fleets and operating conditions differ.
A comparison of conversion efficiency would require both fuel input and net generation, often summarized through heat-rate measures. A comparison of fossil-fuel dependence would require fossil generation divided by total generation or another appropriate denominator. This dataset is best used for comparing the absolute scale of fossil-energy input in the electric-power sector.
Where the EIA data fit in the broader electricity statistics
EIA’s Electricity Data page provides fuel-consumption tables by energy source, industry type, and state. The Form EIA-923 detailed data provide plant- and operator-level generation, fuel consumption, stocks, and related operating information. Those detailed files are useful when a state total needs to be separated into specific fuels, plants, or generator characteristics.
The 50-state aggregate used here provides a compact geographic comparison. It should be treated as one layer in a larger analysis rather than a complete description of each state’s power system. Pairing it with net generation, generating capacity, fuel-specific consumption, and interstate electricity flows can answer questions that the absolute fossil-fuel input alone cannot.
All 50 states in 2025
The table below lists every state in the dataset from the largest to the smallest 2025 value. The District of Columbia is not part of this 50-state slice. All observations are positive and are displayed in million MMBtu.
| Rank | State | Code | Year | million MMBtu |
|---|---|---|---|---|
| 1 | Texas | TX | 2025 | 2712.31758 |
| 2 | Florida | FL | 2025 | 1550.76556 |
| 3 | Pennsylvania | PA | 2025 | 1222.10959 |
| 4 | Ohio | OH | 2025 | 976.35734 |
| 5 | Indiana | IN | 2025 | 829.42489 |
| 6 | Michigan | MI | 2025 | 715.63016 |
| 7 | Alabama | AL | 2025 | 683.47709 |
| 8 | Kentucky | KY | 2025 | 675.89302 |
| 9 | Georgia | GA | 2025 | 621.14852 |
| 10 | North Carolina | NC | 2025 | 620.4438 |
| 11 | Illinois | IL | 2025 | 559.98915 |
| 12 | Missouri | MO | 2025 | 552.29339 |
| 13 | New York | NY | 2025 | 513.79914 |
| 14 | Arizona | AZ | 2025 | 512.53962 |
| 15 | West Virginia | WV | 2025 | 507.9256 |
| 16 | Virginia | VA | 2025 | 490.79118 |
| 17 | Mississippi | MS | 2025 | 476.77496 |
| 18 | California | CA | 2025 | 472.60659 |
| 19 | Louisiana | LA | 2025 | 456.08722 |
| 20 | Oklahoma | OK | 2025 | 443.8779 |
| 21 | Wisconsin | WI | 2025 | 409.70839 |
| 22 | Arkansas | AR | 2025 | 385.35085 |
| 23 | South Carolina | SC | 2025 | 365.77915 |
| 24 | Wyoming | WY | 2025 | 346.79507 |
| 25 | Tennessee | TN | 2025 | 317.88667 |
| 26 | Colorado | CO | 2025 | 305.66822 |
| 27 | Utah | UT | 2025 | 276.40725 |
| 28 | North Dakota | ND | 2025 | 272.88493 |
| 29 | Kansas | KS | 2025 | 252.52896 |
| 30 | Iowa | IA | 2025 | 251.68758 |
| 31 | Minnesota | MN | 2025 | 245.70078 |
| 32 | New Jersey | NJ | 2025 | 215.15189 |
| 33 | Nebraska | NE | 2025 | 206.21023 |
| 34 | Nevada | NV | 2025 | 202.7049 |
| 35 | New Mexico | NM | 2025 | 177.64448 |
| 36 | Connecticut | CT | 2025 | 171.10279 |
| 37 | Oregon | OR | 2025 | 167.28291 |
| 38 | Washington | WA | 2025 | 157.44101 |
| 39 | Maryland | MD | 2025 | 152.66072 |
| 40 | Massachusetts | MA | 2025 | 133.46323 |
| 41 | Montana | MT | 2025 | 127.8069 |
| 42 | Rhode Island | RI | 2025 | 71.14065 |
| 43 | Hawaii | HI | 2025 | 70.72193 |
| 44 | Idaho | ID | 2025 | 51.97815 |
| 45 | Maine | ME | 2025 | 48.703 |
| 46 | New Hampshire | NH | 2025 | 44.21072 |
| 47 | Alaska | AK | 2025 | 42.42543 |
| 48 | South Dakota | SD | 2025 | 41.20592 |
| 49 | Delaware | DE | 2025 | 34.42297 |
| 50 | Vermont | VT | 2025 | 0.11857 |
Frequently Asked Questions
Which state consumed the most fossil-fuel energy for electricity generation in 2025?
Texas was highest at 2712.31758 million MMBtu, about 12.8% of the combined 50-state total.
What does million MMBtu mean?
MMBtu means one million Btu. One million MMBtu is numerically equal to one trillion Btu.
Does a high value mean a state has a high fossil-fuel share of electricity?
Not necessarily. The series measures absolute fuel input. A fossil share requires a denominator such as total generation.
Is fuel consumption the same as fossil-fuel electricity generation?
No. Fuel consumption is thermal energy entering power plants, while generation is electrical energy produced. Plant efficiency affects the relationship.
Related Articles
Green Map creates custom-edited map images using open geographic data sources such as geoBoundaries, Natural Earth, OpenStreetMap, and government open data. These maps are edited visual materials, not raw data files, and are provided for education, documents, presentations, and graphic reference.