The U.S. Energy Information Administration’s 2024 SEDS series labeled “Hydropower energy total end-use consumption” provides one same-year observation for all 50 states and the District of Columbia. The unit is Billion Btu. The distribution is unusually concentrated: only 17 jurisdictions report a positive value, while 34 report an explicit zero.
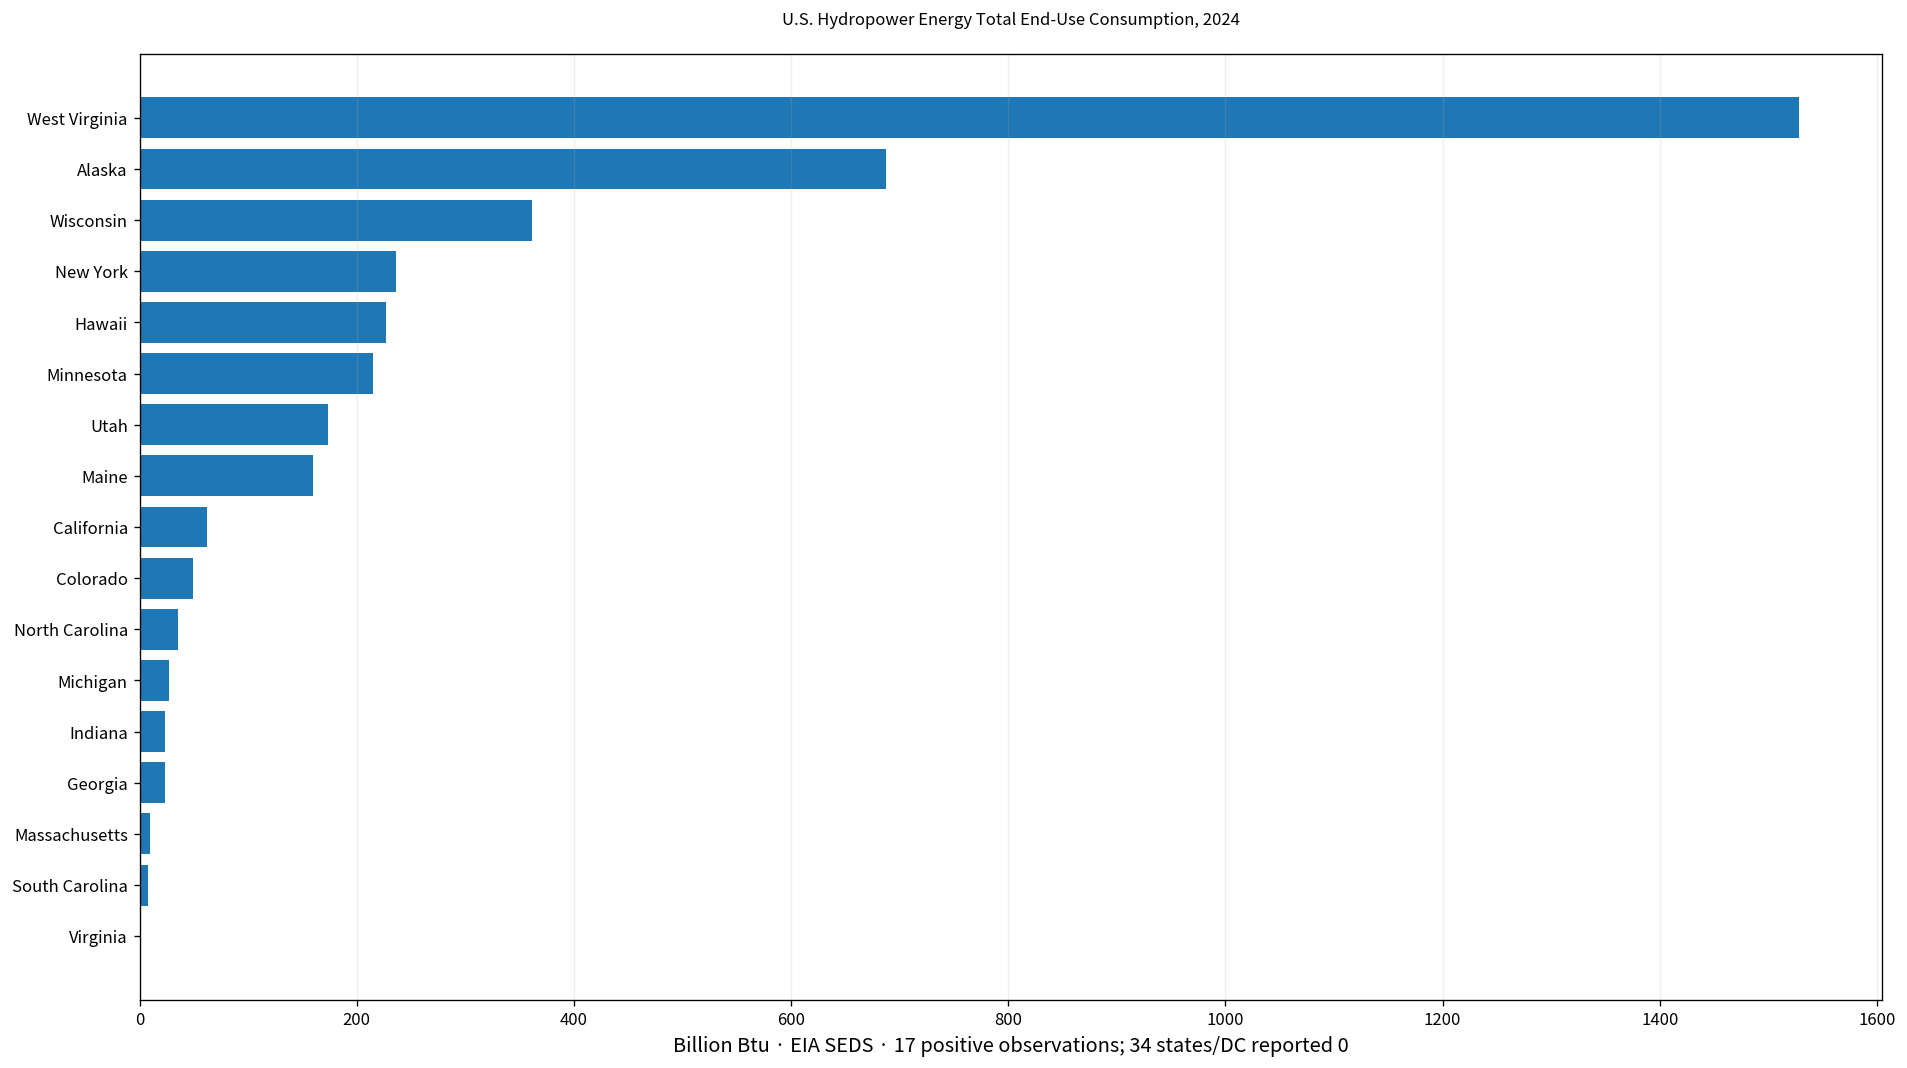
Table of Contents
This series is not the same as hydropower generation
The exact EIA series label is “Hydropower energy total end-use consumption.” This analysis keeps that identity rather than relabeling the values as hydroelectric generation or electricity output. State hydropower generation is a different question and requires a generation or net-generation series.
That distinction is essential because many states have a zero in this series. A zero here does not establish that a state has no hydropower plants or no hydroelectric generation. It means only that the published 2024 value for this particular total end-use consumption series is zero.
All 51 jurisdictions are from 2024 and none are missing
The data cover all 50 states plus the District of Columbia in one common year. Every row contains a numeric observation, so there is no missing-data imputation. The 34 zeros are genuine published numeric values rather than blank cells converted to zero.
The sum of the 51 state/DC observations is 3,826 Billion Btu. This is described here as the sum of the 51 provided rows rather than as an independently verified U.S. national total. The simple mean is 75.02 Billion Btu, but the median is zero because two-thirds of the jurisdictions report zero.
West Virginia leads at 1,528 Billion Btu
West Virginia is the largest observation at 1,528 Billion Btu. Alaska follows at 687, Wisconsin at 361, New York at 236, Hawaii at 227, Minnesota at 215, Utah at 174, and Maine at 160. California records 62 and Colorado 49 Billion Btu.
| Rank | State/jurisdiction | 2024 value |
|---|---|---|
| 1 | West Virginia | 1,528 Billion Btu |
| 2 | Alaska | 687 Billion Btu |
| 3 | Wisconsin | 361 Billion Btu |
| 4 | New York | 236 Billion Btu |
| 5 | Hawaii | 227 Billion Btu |
| 6 | Minnesota | 215 Billion Btu |
| 7 | Utah | 174 Billion Btu |
| 8 | Maine | 160 Billion Btu |
| 9 | California | 62 Billion Btu |
| 10 | Colorado | 49 Billion Btu |
| 11 | North Carolina | 35 Billion Btu |
| 12 | Michigan | 27 Billion Btu |
| 13 | Georgia | 23 Billion Btu |
| 14 | Indiana | 23 Billion Btu |
| 15 | Massachusetts | 10 Billion Btu |
| 16 | South Carolina | 8 Billion Btu |
| 17 | Virginia | 1 Billion Btu |
West Virginia alone accounts for about 39.9% of the sum of the 51 observations. The top three account for 67.3%, the top five for 79.4%, and the top ten for 96.7%. The series is therefore highly concentrated in a relatively small number of states.
Among the 17 positive observations, the median is 62 Billion Btu
If the zero observations are set aside only for a descriptive look at the positive group, the 17 positive values have a mean of 225.1 Billion Btu and a median of 62. The first quartile is 23 and the third quartile 227 Billion Btu.
The low end of the positive group is Virginia at 1 Billion Btu, South Carolina at 8, Massachusetts at 10, Georgia and Indiana at 23 each, Michigan at 27, and North Carolina at 35. Positive values therefore range from 1 to 1,528 Billion Btu.
How to read the 34 published zeros
Alabama, Arkansas, Arizona, Connecticut, the District of Columbia, Delaware, Florida, Idaho, Illinois, Iowa, Kansas, Kentucky, Louisiana, Maryland, Missouri, Mississippi, Montana, Nebraska, Nevada, New Hampshire, New Jersey, New Mexico, North Dakota, Ohio, Oklahoma, Oregon, Pennsylvania, Rhode Island, South Dakota, Tennessee, Texas, Vermont, Washington, and Wyoming all report zero in the 2024 series.
Those zeros are retained exactly as published. They are not treated as missing observations, but they are also not expanded into claims about the absence of hydropower resources or generation. The only direct conclusion supported by the data is that this specific SEDS end-use series reports zero for those jurisdictions in 2024.
Positive observations appear across several U.S. regions
Positive values are not confined to a single part of the country. They appear in Appalachia, Alaska and Hawaii, the Great Lakes and Upper Midwest, the Northeast, and several western states. West Virginia and North Carolina are examples in the Appalachian area; Wisconsin, Minnesota, and Michigan appear around the Great Lakes; New York, Maine, and Massachusetts are in the Northeast; and California, Colorado, and Utah are in the West.
The geographic pattern is descriptive rather than causal. These 51 values alone do not establish why one state has a positive end-use value and another reports zero. Explaining the pattern would require additional information on the exact sector accounting, state energy systems, and related EIA series.
Washington and Oregon illustrate why generation must be kept separate
Some states commonly associated with hydropower have a zero in this total end-use consumption series. That is a strong reason not to reinterpret this table as a hydropower-generation ranking. The label and sector scope of an EIA series matter as much as the energy source named in the title.
A search for the largest hydroelectric-generating states should use a generation dataset. This series instead answers a narrower question: where EIA SEDS reports hydropower energy total end-use consumption in 2024, which states have the largest values and how concentrated are those observations?
Why the median of zero matters more than the mean alone
The all-jurisdiction mean is 75.02 Billion Btu, but 34 of 51 jurisdictions are zero. The mean is pulled upward by West Virginia, Alaska, Wisconsin, and a few other large values. The median of zero and the count of 17 positive observations describe the typical shape of the distribution more clearly.
Concentration is also visible in the cumulative shares. The top ten states contribute almost all of the 51-row sum. For that reason, the featured chart displays the positive states rather than compressing 34 zero bars into the same figure.
Billion Btu is an energy unit, not an electricity-output unit
Btu is a unit of energy, and Billion Btu means one billion British thermal units. Hydroelectric generation is often discussed in MWh or GWh, which are electricity-output units. This article does not convert the values into electricity generation because doing so would change the question represented by the source series.
SEDS uses common energy units to compare energy consumption across fuels, sectors, and states. Different SEDS series can have different sector boundaries, so comparisons with another hydropower-related EIA series should begin by confirming the series definition rather than matching on the word “hydropower” alone.
Complete 2024 table for all 50 states and DC
The table below preserves all 51 observations in alphabetical order. Published zeros remain zero, and there are no missing rows. Every value is in Billion Btu.
| State/jurisdiction | Code | Hydropower energy total end-use consumption |
|---|---|---|
| Alabama | AL | 0 Billion Btu |
| Alaska | AK | 687 Billion Btu |
| Arizona | AZ | 0 Billion Btu |
| Arkansas | AR | 0 Billion Btu |
| California | CA | 62 Billion Btu |
| Colorado | CO | 49 Billion Btu |
| Connecticut | CT | 0 Billion Btu |
| Delaware | DE | 0 Billion Btu |
| District of Columbia | DC | 0 Billion Btu |
| Florida | FL | 0 Billion Btu |
| Georgia | GA | 23 Billion Btu |
| Hawaii | HI | 227 Billion Btu |
| Idaho | ID | 0 Billion Btu |
| Illinois | IL | 0 Billion Btu |
| Indiana | IN | 23 Billion Btu |
| Iowa | IA | 0 Billion Btu |
| Kansas | KS | 0 Billion Btu |
| Kentucky | KY | 0 Billion Btu |
| Louisiana | LA | 0 Billion Btu |
| Maine | ME | 160 Billion Btu |
| Maryland | MD | 0 Billion Btu |
| Massachusetts | MA | 10 Billion Btu |
| Michigan | MI | 27 Billion Btu |
| Minnesota | MN | 215 Billion Btu |
| Mississippi | MS | 0 Billion Btu |
| Missouri | MO | 0 Billion Btu |
| Montana | MT | 0 Billion Btu |
| Nebraska | NE | 0 Billion Btu |
| Nevada | NV | 0 Billion Btu |
| New Hampshire | NH | 0 Billion Btu |
| New Jersey | NJ | 0 Billion Btu |
| New Mexico | NM | 0 Billion Btu |
| New York | NY | 236 Billion Btu |
| North Carolina | NC | 35 Billion Btu |
| North Dakota | ND | 0 Billion Btu |
| Ohio | OH | 0 Billion Btu |
| Oklahoma | OK | 0 Billion Btu |
| Oregon | OR | 0 Billion Btu |
| Pennsylvania | PA | 0 Billion Btu |
| Rhode Island | RI | 0 Billion Btu |
| South Carolina | SC | 8 Billion Btu |
| South Dakota | SD | 0 Billion Btu |
| Tennessee | TN | 0 Billion Btu |
| Texas | TX | 0 Billion Btu |
| Utah | UT | 174 Billion Btu |
| Vermont | VT | 0 Billion Btu |
| Virginia | VA | 1 Billion Btu |
| Washington | WA | 0 Billion Btu |
| West Virginia | WV | 1,528 Billion Btu |
| Wisconsin | WI | 361 Billion Btu |
| Wyoming | WY | 0 Billion Btu |
What this dataset can and cannot tell us
The dataset directly supports comparisons of the 2024 values, the number of zero and positive observations, the state ranking, and the concentration of the observed total. Because every state and DC is present in the same year, there is no mixed-year problem and no geographic coverage gap within the 51-jurisdiction scope.
It does not measure hydropower generating capacity, net generation, number of plants, dams, hydropower’s share of the electricity mix, electricity prices, or water resources. Those questions require different official series.
Source and calculation
The source is the U.S. Energy Information Administration State Energy Data System (SEDS), series “Hydropower energy total end-use consumption.” The analysis uses the 51 directly published 2024 observations for the 50 states and District of Columbia. The sum, mean, median, quartiles, ranking, and concentration shares are calculated directly from those values with no imputation.
Frequently Asked Questions
Is this series a ranking of state hydropower generation?
No. It is the EIA SEDS series “Hydropower energy total end-use consumption,” which is different from generation or net generation.
How many jurisdictions report zero in 2024?
34 of the 50 states plus DC have a published value of zero, while 17 report a positive value.
Which state has the largest 2024 value?
West Virginia is highest at 1,528 Billion Btu, followed by Alaska at 687 and Wisconsin at 361.
Related Articles
Green Map creates custom-edited map images using open geographic data sources such as geoBoundaries, Natural Earth, OpenStreetMap, and government open data. These maps are edited visual materials, not raw data files, and are provided for education, documents, presentations, and graphic reference.