Tax revenue can be compared across countries in many ways, but absolute currency amounts are not very informative when economies differ greatly in size. This article uses World Bank indicator GC.TAX.TOTL.GD.ZS, Tax revenue (% of GDP), for 2023. A value of 20% means that tax revenue captured by this indicator is equivalent to 20% of that economy’s GDP in the same year.
Coverage is incomplete. The country master contains 217 countries and areas, but only 111 have a 2023 value; 106 are source-missing. Gray areas on the map therefore mean “no 2023 data,” not zero tax revenue. All rankings, distribution statistics, and comparisons below use only the 111 reported observations.
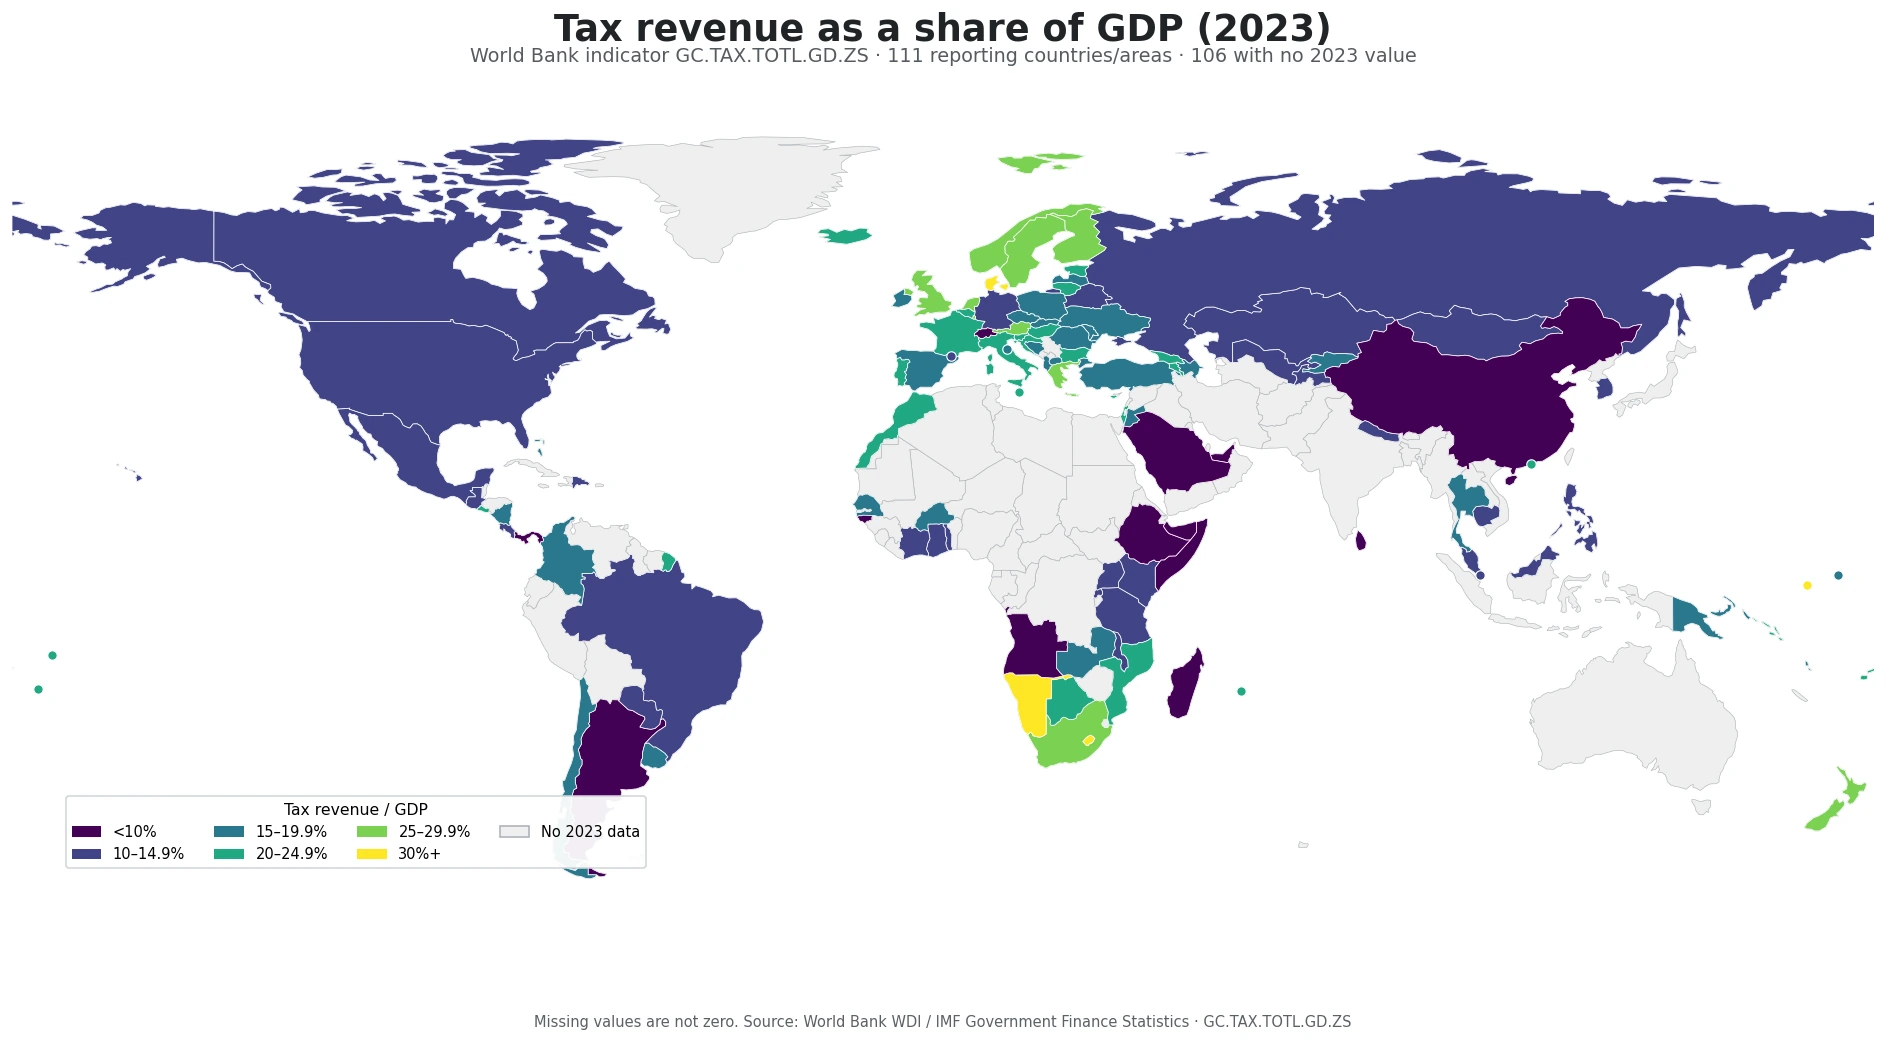
Table of Contents
What tax revenue as a share of GDP measures
The indicator scales tax revenue by the size of the economy. GDP measures the value generated by goods and services produced in an economic territory, so the ratio answers a relative question: how large is recorded tax revenue compared with the economy that generates the tax base? Using a percentage makes it possible to compare economies whose populations, currencies, and nominal GDP levels are very different.
The measure is narrower than an all-in “tax burden.” World Bank metadata describes tax revenue as compulsory transfers to the central government for public purposes and notes that most social security contributions, fines, and penalties are excluded. It also warns that some countries report only budgetary central government rather than all central-government units. Those scope differences matter, especially when comparing countries that finance public programs through different institutional channels.
The 2023 cross-section contains 111 reported observations
Across the 111 countries and areas with a value, the mean is 17.64% of GDP and the median is 17.53%. The first quartile is 13.41% and the third quartile is 22.22%. The mean and median are close, although the full range is wide: from 0.62% to 40.00%.
| Tax revenue / GDP | Countries/areas with 2023 data |
|---|---|
| Below 10% | 12 |
| 10–14.9% | 30 |
| 15–19.9% | 29 |
| 20–24.9% | 26 |
| 25–29.9% | 10 |
| 30% or more | 4 |
Twelve reported observations are below 10% of GDP. Thirty are between 10% and 14.9%, 29 between 15% and 19.9%, and 26 between 20% and 24.9%. Only 14 reported economies are at or above 25%. The map therefore shows a broad middle range with a smaller set of high and low outliers rather than a single global cluster.
Lesotho and Namibia are at the top of the reported 2023 values
Lesotho records the highest value at 40.00%, followed by Namibia at 32.66%, Nauru at 32.10%, and Denmark at 31.97%. New Zealand, Sweden, Luxembourg, the United Kingdom, Greece, and Norway also appear in the upper part of the reported distribution.
| Country/area | 2023 tax revenue / GDP |
|---|---|
| Lesotho | 40.00% |
| Namibia | 32.66% |
| Nauru | 32.10% |
| Denmark | 31.97% |
| New Zealand | 28.06% |
| Sweden | 27.38% |
| Luxembourg | 26.98% |
| United Kingdom | 26.87% |
| Greece | 26.49% |
| Norway | 26.12% |
High observations are not confined to one region. Several Nordic and Western European countries are in upper bands, while Lesotho, Namibia, and South Africa stand out in southern Africa. The indicator itself does not identify the cause of a high ratio. Tax bases, statutory rates, enforcement, economic structure, the business cycle, and reporting coverage may all matter, but causal attribution requires evidence beyond this cross-sectional map.
The lowest reported values also span several regions
The United Arab Emirates has the lowest reported value at 0.62%. Somalia is 2.07%, Ethiopia 3.93%, China 7.64%, and Saudi Arabia 7.80%. Panama, Switzerland, Guinea-Bissau, Angola, and Madagascar follow in the lower tail.
| Country/area | 2023 tax revenue / GDP |
|---|---|
| United Arab Emirates | 0.62% |
| Somalia, Fed. Rep. | 2.07% |
| Ethiopia | 3.93% |
| China | 7.64% |
| Saudi Arabia | 7.80% |
| Panama | 8.41% |
| Switzerland | 8.67% |
| Guinea-Bissau | 8.85% |
| Angola | 8.96% |
| Madagascar | 9.51% |
A low value should not automatically be read as a weak tax system or a small public sector. Most social security contributions are outside this indicator, and non-tax revenue can also be important. In addition, central-government coverage is not identical in every reporting system. A broader fiscal comparison would need revenue composition, social contributions, subnational government finance, expenditure, and other public-sector indicators.
Neighboring countries can sit in very different bands
Europe illustrates the range clearly. France is 23.18%, the United Kingdom 26.87%, and Italy 24.74%, while Germany is 10.69% and Spain 15.00%. Denmark, Sweden, and Norway are all above 25%. Geographic proximity therefore does not imply similar values, and the institutional scope of the series should be kept in mind when interpreting those gaps.
North America also shows variation: the United States is 10.62%, Canada 13.74%, and Mexico 14.22%. In South America, Brazil is 14.04%, Argentina 9.93%, and Paraguay 10.13%. These country-level contrasts are more informative than assuming that a regional label can substitute for the reported value.
Why a higher or lower ratio is not a policy score
Tax revenue as a share of GDP is an accounting ratio, not a rating of tax policy. A higher ratio can coexist with very different tax mixes and public-service systems. A lower ratio can reflect lower statutory rates, a different revenue model, a larger informal economy, the economic cycle, administrative capacity, or measurement boundaries. The map identifies where reported ratios differ; it does not determine which system is preferable.
The GDP denominator also moves. If tax revenue is stable while nominal GDP expands rapidly, the ratio can fall. If GDP contracts while tax receipts fall less sharply, the ratio can rise. That is why a one-year cross-section should not be used as a substitute for a time-series analysis. Long-run evaluation requires multiple years measured on a consistent basis and attention to breaks in fiscal reporting.
Missing data are a major part of the 2023 picture
The 106 missing observations are not a small technical detail. Australia, Japan, India, Indonesia, Nigeria, and Egypt are among the economies without a 2023 value in this supplied country file. Assigning zero to those rows would create false low values and materially distort the global map and summary statistics. The map therefore leaves them gray and excludes them from all rankings.
For the same reason, the simple mean of 17.64% should be described as the average among the 111 reporting countries and areas, not as “the world tax-revenue ratio.” Economies differ enormously in GDP size, and nearly half of the country master lacks a 2023 observation. No global weighted total is calculated here.
Three rules for reading the map
- Gray means no 2023 observation, not 0%. Rankings and distribution summaries use only the 111 reported values.
- The indicator is tax revenue relative to GDP, not total government revenue or a complete measure of all taxes and social contributions paid in an economy.
- High and low values describe reported fiscal ratios; they do not by themselves establish policy quality or explain the cause of the difference.
The source is the World Bank World Development Indicators series GC.TAX.TOTL.GD.ZS, drawing on government finance statistics. The map and tables preserve the supplied 2023 values and leave missing observations unfilled.
Frequently Asked Questions
Does a higher tax-revenue-to-GDP ratio necessarily mean a higher overall tax burden?
Not necessarily. This indicator has a specific government-finance scope and excludes most social security contributions, so broader measures are needed to compare the total burden of taxes and contributions.
Do gray countries on the map have zero tax revenue?
No. Gray means no 2023 observation. Of 217 countries and areas in the master, 111 have a value and 106 are source-missing.
Is 17.64% the global tax-revenue-to-GDP average?
No. It is the simple mean of the 111 reported 2023 observations. It is not a GDP-weighted global ratio, and nearly half of the country master has no 2023 value.
Related Articles
Green Map creates custom-edited map images using open geographic data sources such as geoBoundaries, Natural Earth, OpenStreetMap, and government open data.
These maps are edited visual materials, not raw data files, and are provided for education, documents, presentations, and graphic reference.