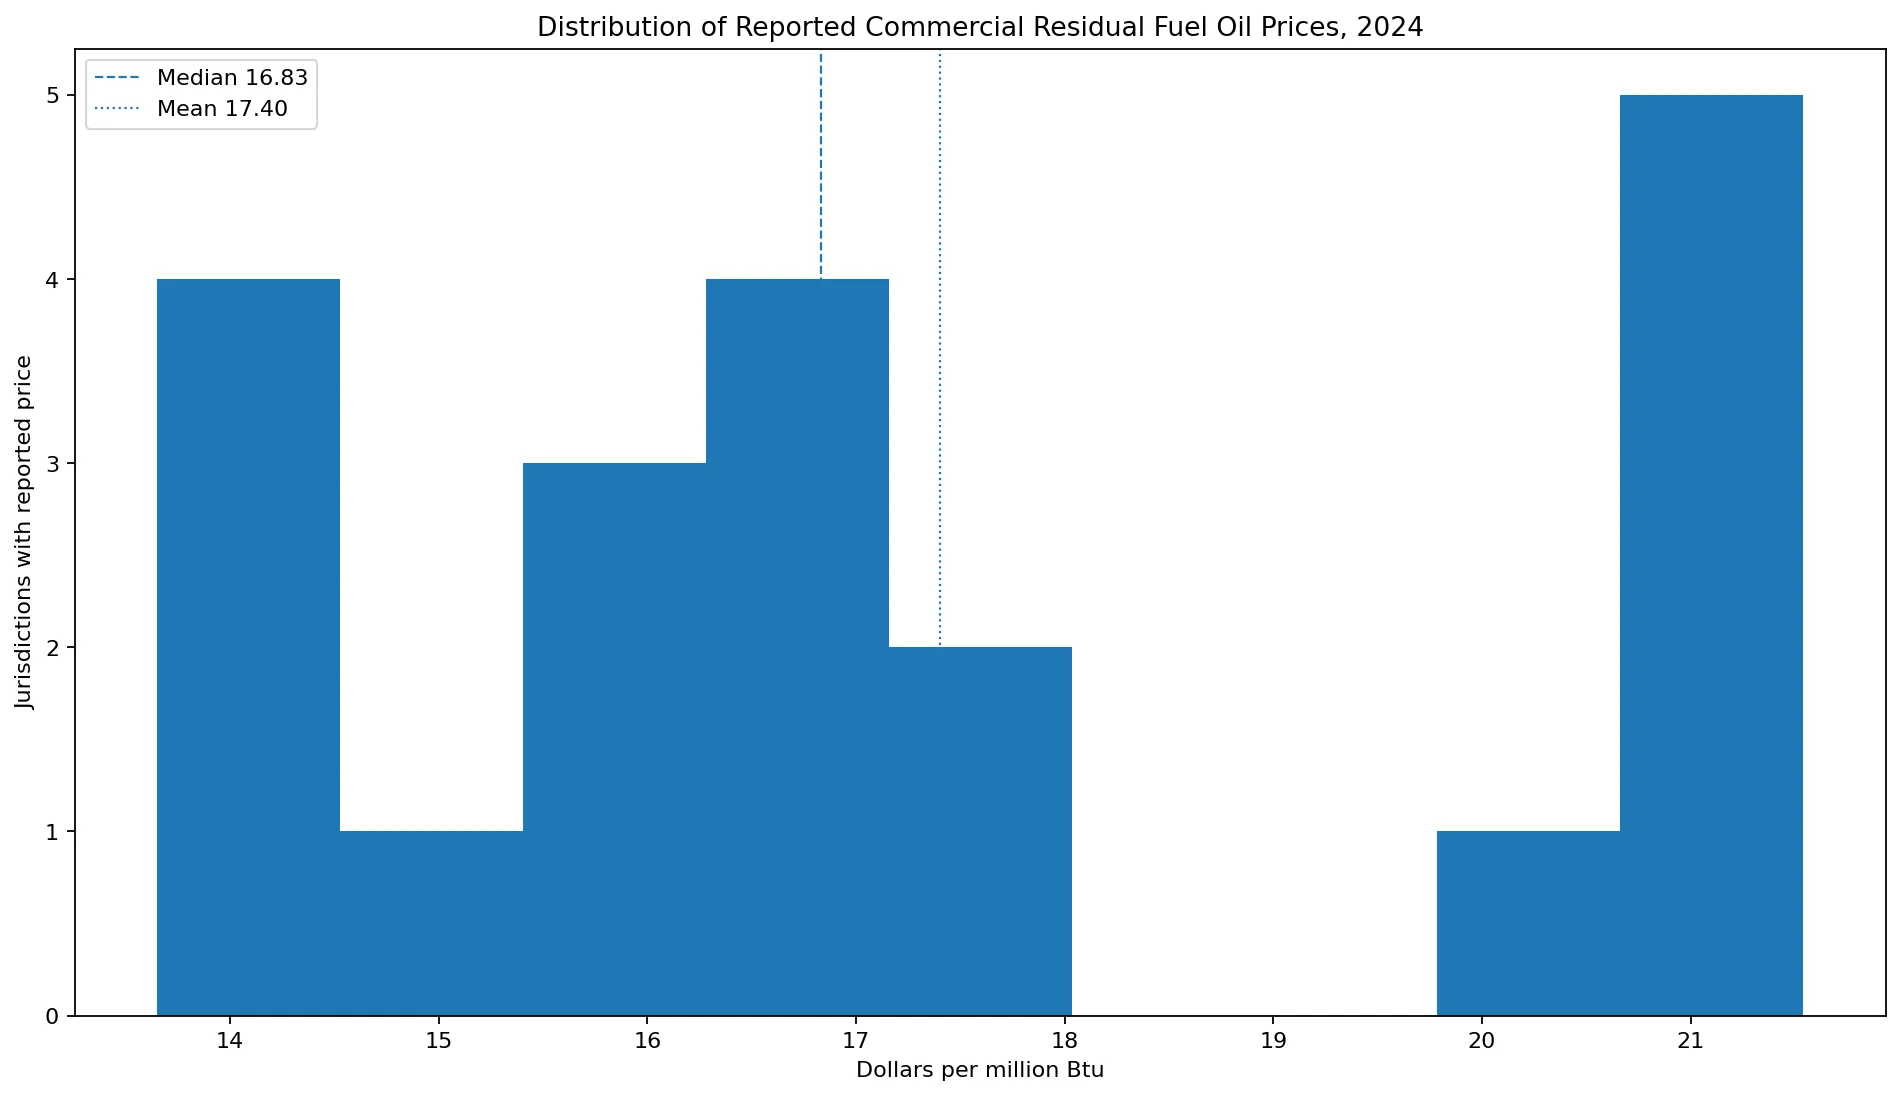
Commercial-sector residual fuel oil prices were reported for only 20 U.S. state jurisdictions in 2024. In EIA State Energy Data System Table F7, Rhode Island was highest at $21.54 per million Btu, followed by Connecticut at $21.41, Massachusetts at $21.39, Vermont at $21.34, and Maine at $21.24. Pennsylvania had the lowest positive reported price at $13.65/MMBtu. Across the 20 reported observations, the median was $16.83 and the simple mean was $17.40.
The other 31 jurisdictions should not be ranked at zero. EIA’s published table displays a dash for their commercial residual fuel oil price, and the table footnote defines that dash as no consumption. The zero values present in the state series therefore represent the absence of commercial-sector residual fuel oil consumption for this price table, not a market price of $0. Rankings and summary statistics in this article use only the 20 jurisdictions with reported prices.
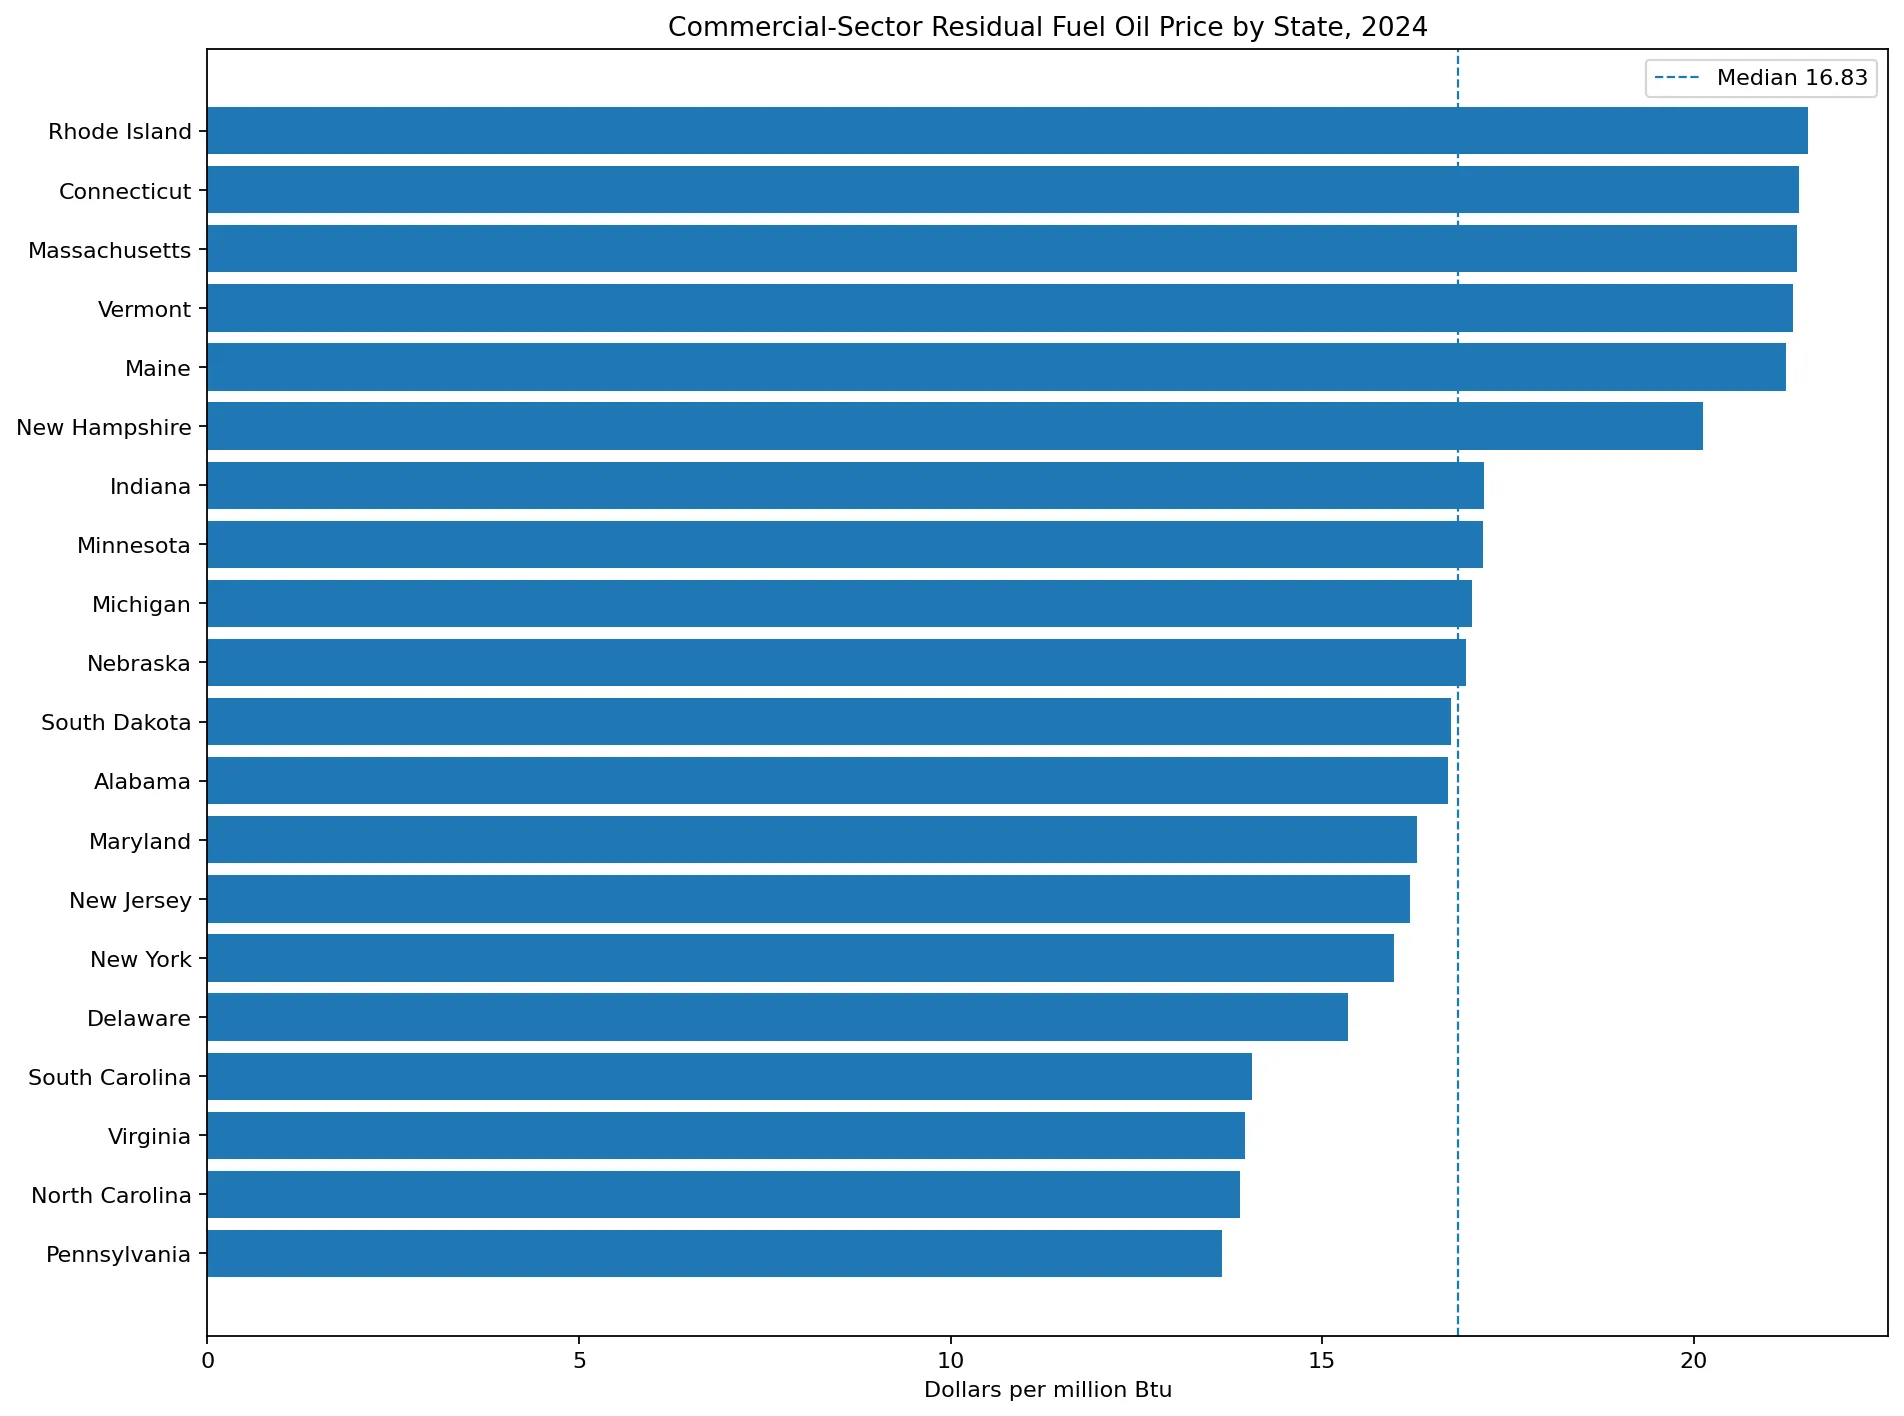
Table of Contents
What the commercial residual fuel oil price measures
Residual fuel oil is a heavy petroleum product that remains after lighter petroleum fractions are separated during refining. SEDS estimates residual fuel oil consumption, prices, and expenditures for commercial, industrial, transportation, and electric-power sectors. This article focuses only on the commercial-sector price, expressed in dollars per million Btu.
The commercial sector generally includes nonmanufacturing establishments such as offices, stores, schools, hospitals, lodging facilities, and government buildings. The residual fuel oil series should not be read as the overall price of commercial energy. Commercial buildings use many other energy sources, including electricity, natural gas, distillate fuel oil, propane, and other fuels. This metric isolates one petroleum product when it is consumed in the commercial sector.
The energy-normalized unit also matters. MMBtu means one million British thermal units. A price expressed in dollars per million Btu can be compared on an energy-content basis with other fuels, but it is not the same thing as a per-barrel or per-gallon purchase price. Moving between those units requires the appropriate heat-content information.
The highest prices are concentrated in the Northeast
Rhode Island records the highest price at $21.54/MMBtu. Connecticut follows at $21.41, Massachusetts at $21.39, Vermont at $21.34, Maine at $21.24, and New Hampshire at $20.13. The six jurisdictions above $20 are all in the Northeast, making this the clearest geographic pattern in the 2024 data.
Below that high-price group, Indiana is at $17.18, Minnesota at $17.16, Michigan at $17.01, and Nebraska at $16.93. South Dakota and Alabama are also close to the median. The gap between New Hampshire and Indiana is large enough that the distribution looks more like a high Northeastern cluster plus a lower main group than a smooth nationwide gradient.
The state price table alone cannot identify the cause of the Northeastern pattern. Regional supply chains, market size, refining and distribution arrangements, heating demand, contract structures, and transaction volumes may all matter. EIA’s annual SEDS price estimates document the level of the state observations; causal attribution requires additional market data.
Pennsylvania is the lowest reported positive price
Pennsylvania records $13.65/MMBtu, the lowest of the 20 reported commercial prices. North Carolina follows at $13.89, Virginia at $13.96, and South Carolina at $14.05. Delaware is at $15.35, New York at $15.97, New Jersey at $16.18, and Maryland at $16.27.
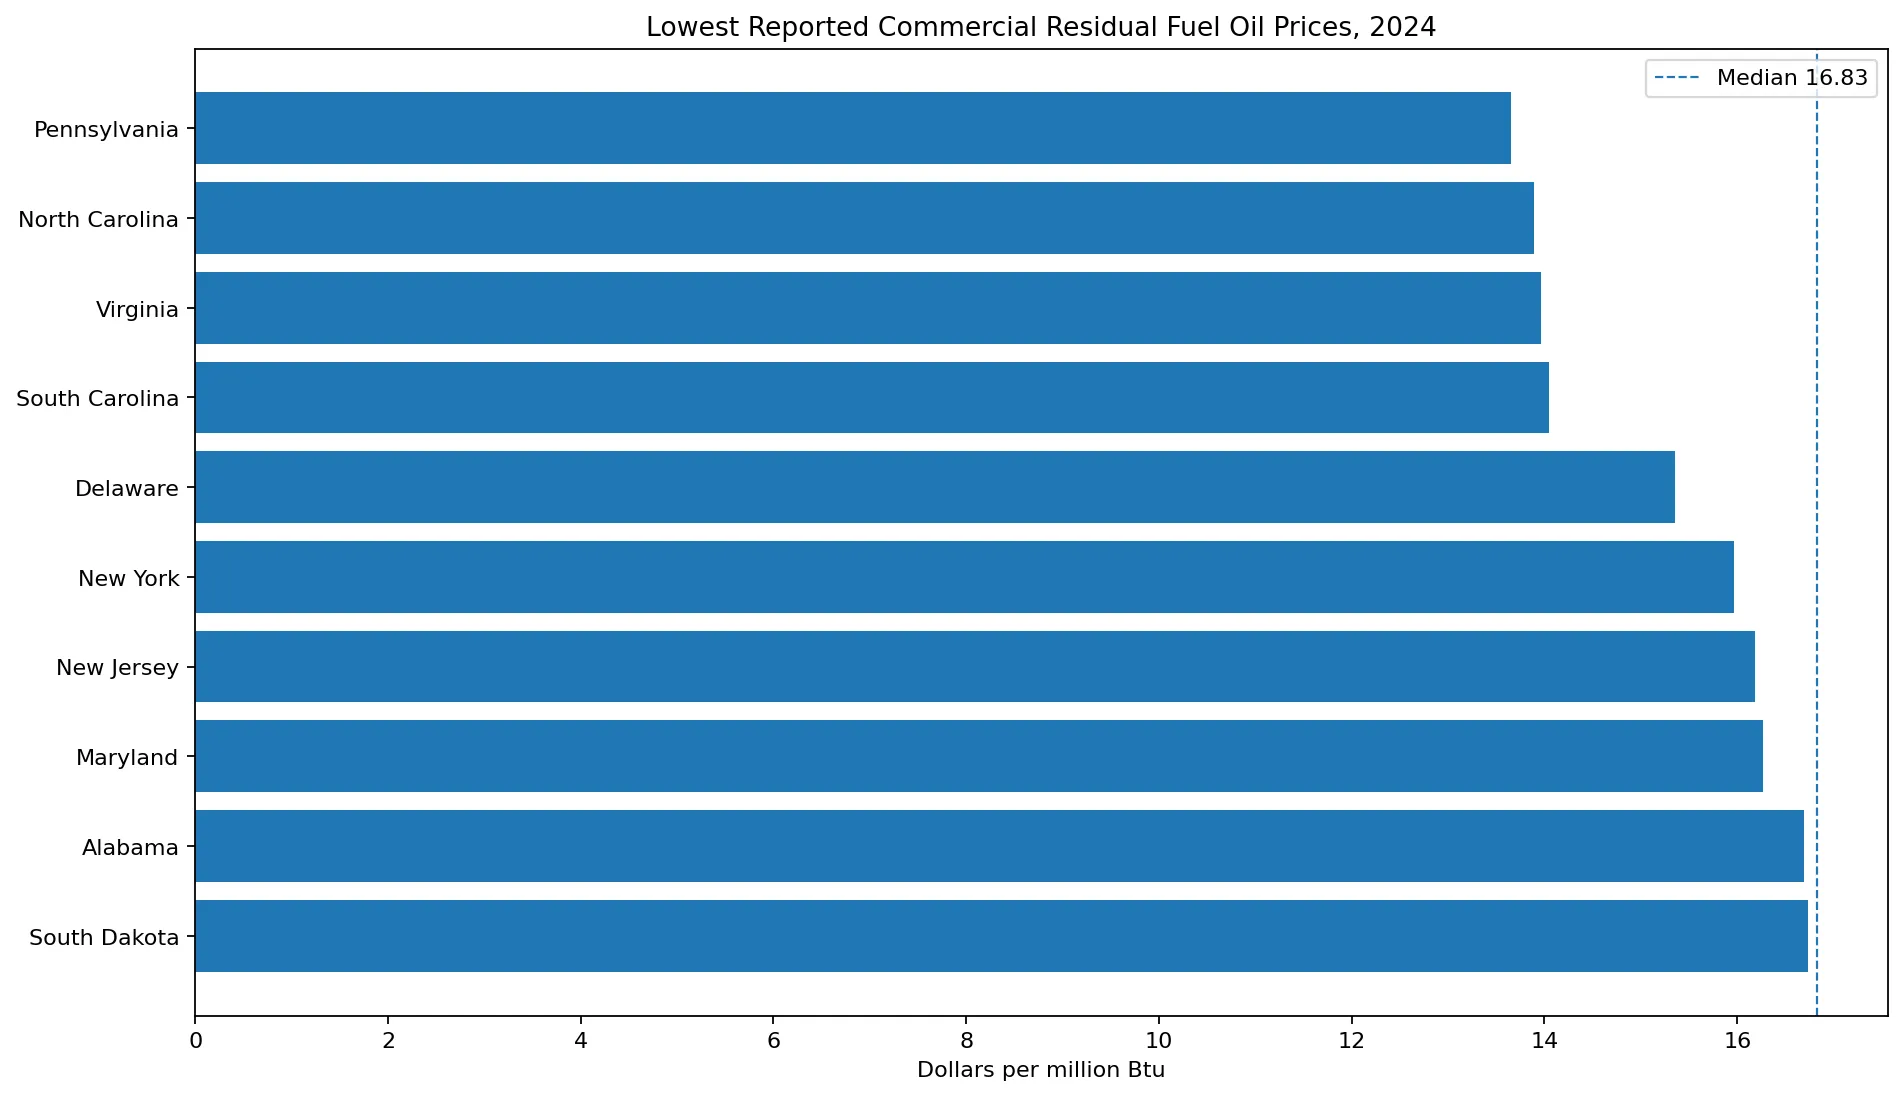
The maximum reported price is about 1.58 times the minimum positive price. The middle half of the 20 observations lies between roughly $15.82 and $20.41/MMBtu. The mean of $17.40 sits slightly above the median of $16.83 because several Northeastern observations above $20 pull the distribution upward.
Why 31 zero entries are not $0 prices
Thirty-one jurisdictions appear with 0.00 in the state series: Alaska, Arizona, Arkansas, California, Colorado, the District of Columbia, Florida, Georgia, Hawaii, Iowa, Idaho, Illinois, Kansas, Kentucky, Louisiana, Missouri, Mississippi, Montana, North Dakota, New Mexico, Nevada, Ohio, Oklahoma, Oregon, Tennessee, Texas, Utah, Washington, Wisconsin, West Virginia, and Wyoming.
In the official EIA Table F7, these entries are not printed as numerical zeros. They are shown as dashes, and the footnote states that a dash means no consumption. That is a materially different concept from a zero-dollar price. Ranking these jurisdictions below Pennsylvania would create a false price result.
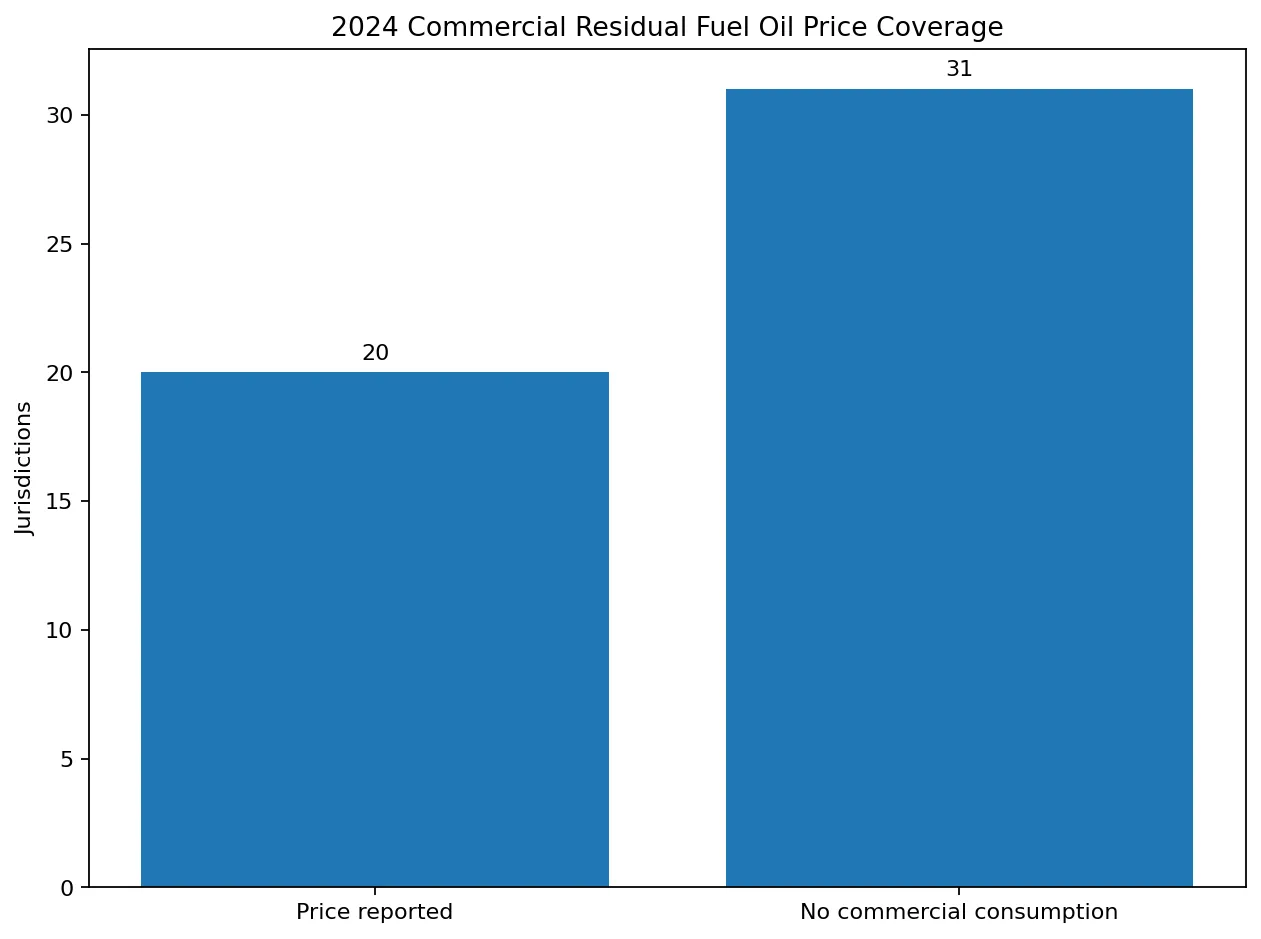
The same distinction matters in visualization. A true zero plotted on the same price scale would look like an extremely low-price market. A no-consumption category should instead be separated from the price scale. The charts and summary statistics here therefore use the 20 positive reported observations and keep the other jurisdictions in a separate status category.
EIA changed the residual fuel oil price method beginning in 2022
The post-2021 state prices are not based solely on a continuing survey of end-user sales. EIA suspended survey EIA-782 after data year 2021. For 2022 forward, SEDS estimates state residual fuel oil prices for the commercial, industrial, and transportation sectors with regression models. Historical state SEDS prices serve as dependent variables, while the independent variables differ by sector and can include U.S. No. 2 diesel retail prices, U.S. residual fuel receipts costs at electric generating plants, crude-oil spot prices, and U.S. Gulf Coast ultra-low-sulfur diesel spot prices.
That methodology change matters for long time-series analysis. The observations remain in the same SEDS framework, but the source and estimation process changed after 2021. A 2024 cross-state comparison is internally consistent because the states are being estimated within the same annual methodology. Small changes across the methodological break, however, should not automatically be interpreted as pure market movements.
Consumption estimation changed separately. EIA suspended the Fuel Oil and Kerosene Sales Report after data year 2020, and for 2021 forward SEDS estimates commercial, industrial, and transportation residual fuel oil consumption using historical state and sector shares. The presence or absence of a commercial price should therefore be understood within both the consumption and price estimation systems.
The U.S. commercial price of $18.46 is not the same as the $17.40 state mean
EIA Table F7 reports a 2024 U.S. commercial residual fuel oil price of $18.46/MMBtu. The unweighted average of the 20 state-jurisdiction prices is about $17.40. These statistics answer different questions. The simple state mean gives equal weight to each jurisdiction with a reported price. The U.S. value reflects national commercial-sector residual fuel oil consumption and expenditures, so jurisdictions with larger consumption have greater influence.
For a description of the middle of the reported state distribution, the $16.83 median is useful. For the arithmetic average of the 20 published state prices, $17.40 is appropriate. For the effective average price across U.S. commercial residual fuel oil consumption, EIA’s national $18.46 figure is the relevant measure.
Residual fuel oil price is not the same as total commercial petroleum price
Table F7 isolates residual fuel oil. Commercial-sector petroleum use can also include distillate fuel oil, kerosene, propane, motor gasoline, and other products. A state’s total commercial petroleum price depends on the mix and quantities of those fuels. A residual fuel oil observation therefore should not be substituted for the overall petroleum or overall commercial energy price.
Price and expenditure are different as well. A high price does not necessarily imply high spending if the volume consumed is very small. Table F7 shows that some commercial residual fuel oil expenditures are small enough to be marked with the suppression symbol for amounts below $0.05 million. Consumption, price, and expenditure need to be read as separate dimensions.
Official EIA references
EIA Table F7 lists 2024 residual fuel oil prices and expenditures for the commercial, industrial, transportation, electric-power, and total sectors. The footnote explicitly defines the dash as no consumption. EIA’s SEDS data-change documentation explains the regression-based residual fuel oil price method used from 2022 forward.
All 51 state jurisdictions
The table below retains the 50 states and the District of Columbia. Only the 20 jurisdictions with a published commercial price receive a price rank. The other 31 are shown with a dash because EIA identifies no commercial residual fuel oil consumption for the table.
| Rank | State | Code | Year | $/MMBtu | Status |
|---|---|---|---|---|---|
| 1 | Rhode Island | RI | 2024 | 21.54 | Price reported |
| 2 | Connecticut | CT | 2024 | 21.41 | Price reported |
| 3 | Massachusetts | MA | 2024 | 21.39 | Price reported |
| 4 | Vermont | VT | 2024 | 21.34 | Price reported |
| 5 | Maine | ME | 2024 | 21.24 | Price reported |
| 6 | New Hampshire | NH | 2024 | 20.13 | Price reported |
| 7 | Indiana | IN | 2024 | 17.18 | Price reported |
| 8 | Minnesota | MN | 2024 | 17.16 | Price reported |
| 9 | Michigan | MI | 2024 | 17.01 | Price reported |
| 10 | Nebraska | NE | 2024 | 16.93 | Price reported |
| 11 | South Dakota | SD | 2024 | 16.73 | Price reported |
| 12 | Alabama | AL | 2024 | 16.69 | Price reported |
| 13 | Maryland | MD | 2024 | 16.27 | Price reported |
| 14 | New Jersey | NJ | 2024 | 16.18 | Price reported |
| 15 | New York | NY | 2024 | 15.97 | Price reported |
| 16 | Delaware | DE | 2024 | 15.35 | Price reported |
| 17 | South Carolina | SC | 2024 | 14.05 | Price reported |
| 18 | Virginia | VA | 2024 | 13.96 | Price reported |
| 19 | North Carolina | NC | 2024 | 13.89 | Price reported |
| 20 | Pennsylvania | PA | 2024 | 13.65 | Price reported |
| — | Alaska | AK | 2024 | — | No commercial consumption |
| — | Arizona | AZ | 2024 | — | No commercial consumption |
| — | Arkansas | AR | 2024 | — | No commercial consumption |
| — | California | CA | 2024 | — | No commercial consumption |
| — | Colorado | CO | 2024 | — | No commercial consumption |
| — | District of Columbia | DC | 2024 | — | No commercial consumption |
| — | Florida | FL | 2024 | — | No commercial consumption |
| — | Georgia | GA | 2024 | — | No commercial consumption |
| — | Hawaii | HI | 2024 | — | No commercial consumption |
| — | Idaho | ID | 2024 | — | No commercial consumption |
| — | Illinois | IL | 2024 | — | No commercial consumption |
| — | Iowa | IA | 2024 | — | No commercial consumption |
| — | Kansas | KS | 2024 | — | No commercial consumption |
| — | Kentucky | KY | 2024 | — | No commercial consumption |
| — | Louisiana | LA | 2024 | — | No commercial consumption |
| — | Mississippi | MS | 2024 | — | No commercial consumption |
| — | Missouri | MO | 2024 | — | No commercial consumption |
| — | Montana | MT | 2024 | — | No commercial consumption |
| — | Nevada | NV | 2024 | — | No commercial consumption |
| — | New Mexico | NM | 2024 | — | No commercial consumption |
| — | North Dakota | ND | 2024 | — | No commercial consumption |
| — | Ohio | OH | 2024 | — | No commercial consumption |
| — | Oklahoma | OK | 2024 | — | No commercial consumption |
| — | Oregon | OR | 2024 | — | No commercial consumption |
| — | Tennessee | TN | 2024 | — | No commercial consumption |
| — | Texas | TX | 2024 | — | No commercial consumption |
| — | Utah | UT | 2024 | — | No commercial consumption |
| — | Washington | WA | 2024 | — | No commercial consumption |
| — | West Virginia | WV | 2024 | — | No commercial consumption |
| — | Wisconsin | WI | 2024 | — | No commercial consumption |
| — | Wyoming | WY | 2024 | — | No commercial consumption |
Frequently Asked Questions
Which jurisdiction had the highest commercial residual fuel oil price in 2024?
Rhode Island was highest at $21.54/MMBtu, followed by Connecticut at $21.41 and Massachusetts at $21.39.
Do the 31 zero entries mean residual fuel oil was free?
No. EIA Table F7 shows dashes for those jurisdictions and defines the dash as no commercial consumption.
What was the lowest reported positive price?
Pennsylvania was lowest among the reported prices at $13.65/MMBtu.
Are the 2024 state prices directly surveyed end-user prices?
For 2022 forward, SEDS estimates commercial, industrial, and transportation residual fuel oil prices with regression models after EIA-782 was suspended following data year 2021.
Related Articles
Green Map creates custom-edited map images using open geographic data sources such as geoBoundaries, Natural Earth, OpenStreetMap, and government open data. These maps are edited visual materials, not raw data files, and are provided for education, documents, presentations, and graphic reference.