World Bank indicator SE.LPV.PRIM.LD measures the share of pupils at the end of primary education who are below the minimum reading proficiency level under the Low GAML threshold. A higher value means a larger share of assessed pupils did not reach the minimum benchmark. The latest non-empty file contains 125 country observations, but 2023 has only Kenya and 2022 only Bangladesh. The largest recent same-year group is 2021 with 53 economies, so the main ranking and distribution use 2021.
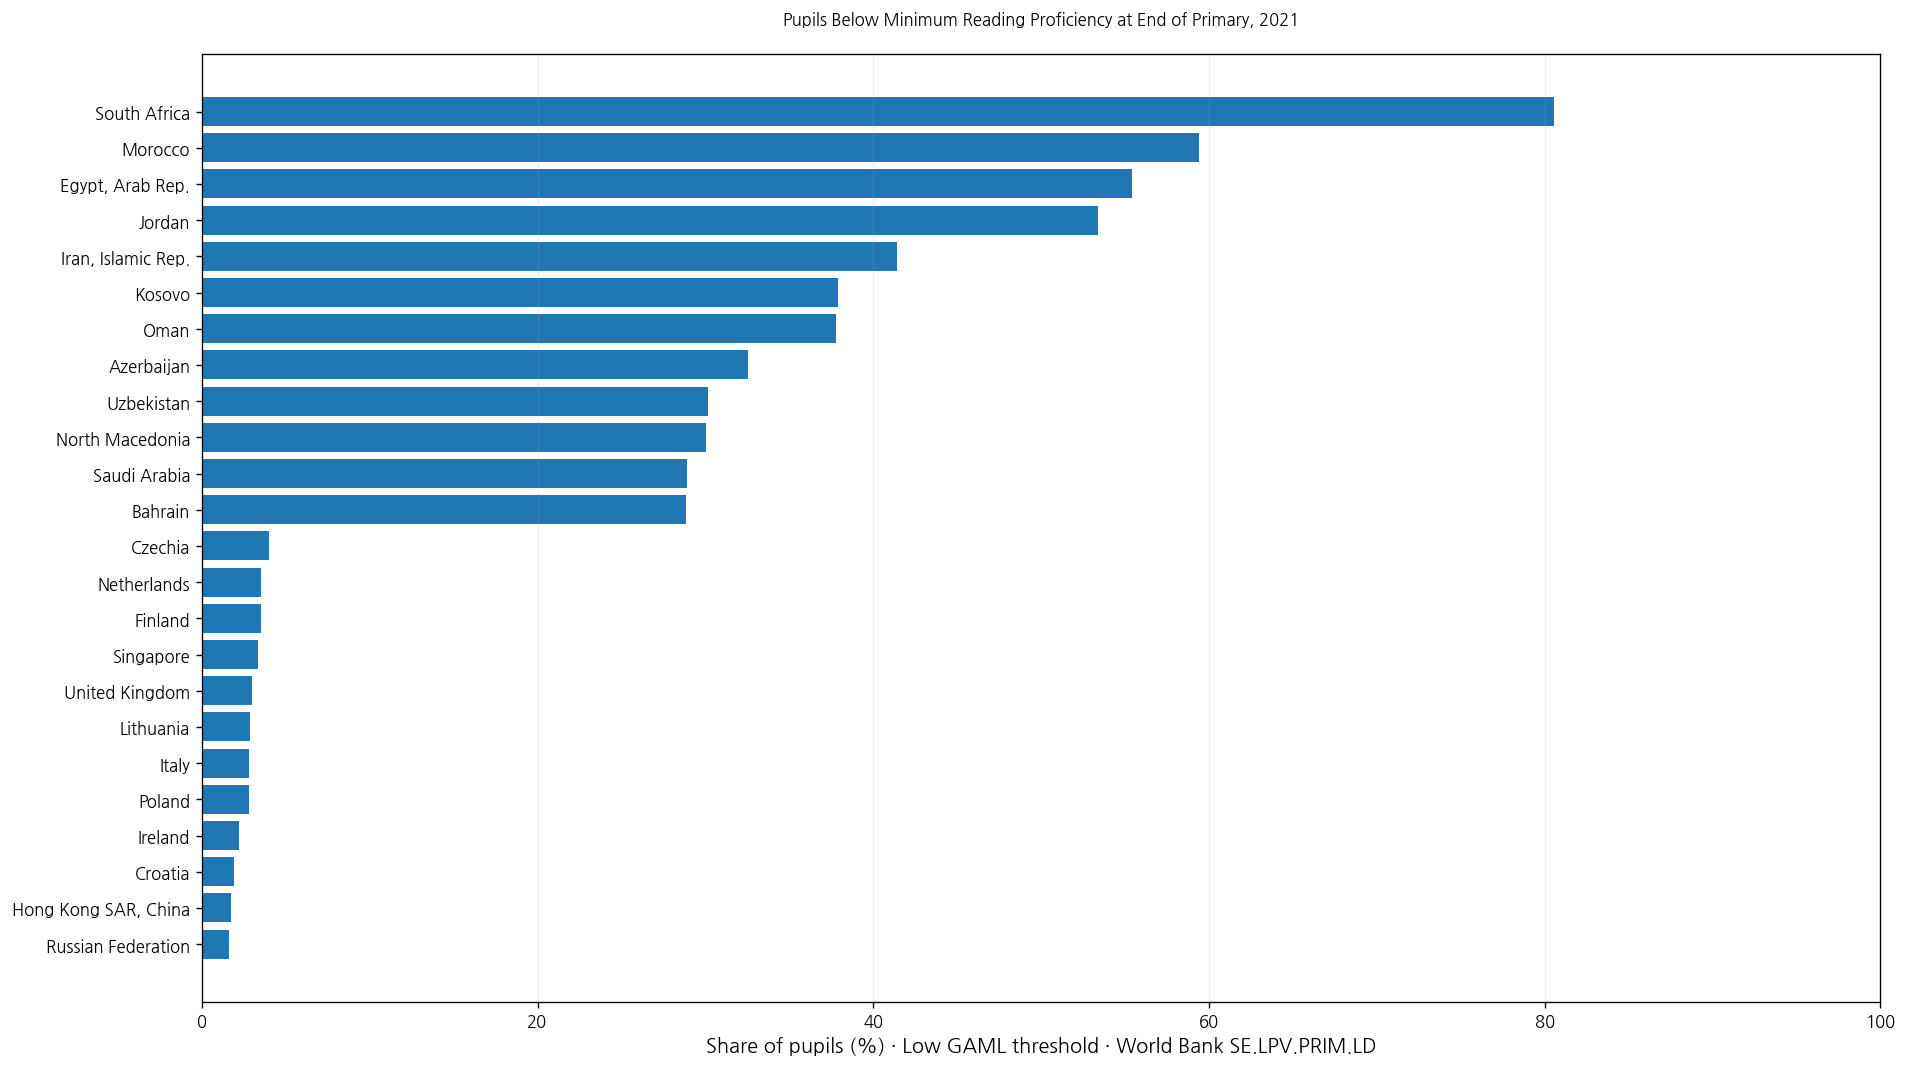
Table of Contents
What the minimum reading benchmark means
Under the GAML description, pupils reaching the end-of-primary minimum can independently and fluently read simple short narrative and informational texts, locate explicitly stated information, interpret key ideas, provide some explanation, and make simple judgments about what they read.
Falling below that benchmark is broader than being unable to recognize letters or read words aloud. A pupil may decode text but still fail to identify information or understand a short age-appropriate passage well enough to meet the minimum standard.
This is not the adult illiteracy rate
Adult literacy indicators refer to literacy among older age groups and use different populations and measurement approaches. SE.LPV.PRIM.LD concerns pupils at the end of primary education and a learning-assessment benchmark.
The indicator should therefore not be relabeled as adult illiteracy, nor should adult literacy rates be used as substitutes for end-of-primary reading proficiency.
It is not automatically the same as learning poverty
The indicator title refers to pupils below minimum proficiency. Broader learning-poverty measures can combine reading performance with children who are out of school, depending on the methodology.
Because denominators and construction differ, this series should be interpreted according to its own definition rather than treated as identical to every measure labeled learning deprivation or learning poverty.
The 2021 mean is 14.96% and the median is 6.41%
The 2021 subset contains 53 economies. Its mean is 14.96% and median 6.41%. The first quartile is 4.08% and the third quartile 19.61%, putting the middle half roughly between 4.08% and 19.61%.
34 economies are below 10%, 12 are at or above 25%, 4 are at or above 50%, and 1 reaches 75% or more. The mean is well above the median because a small number of high values stretch the upper tail.
South Africa is highest in 2021 at 80.55%
South Africa records 80.55%, followed by Morocco at 59.42%, Egypt, Arab Rep. at 55.43%, Jordan at 53.36%, Iran, Islamic Rep. at 41.40%, Kosovo at 37.92%, Oman at 37.80%, Azerbaijan at 32.57%, Uzbekistan at 30.16%, and North Macedonia at 30.04%.
| 2021 high-order position | Economy/territory | Below minimum reading proficiency |
|---|---|---|
| 1 | South Africa | 80.55% |
| 2 | Morocco | 59.42% |
| 3 | Egypt, Arab Rep. | 55.43% |
| 4 | Jordan | 53.36% |
| 5 | Iran, Islamic Rep. | 41.40% |
| 6 | Kosovo | 37.92% |
| 7 | Oman | 37.80% |
| 8 | Azerbaijan | 32.57% |
| 9 | Uzbekistan | 30.16% |
| 10 | North Macedonia | 30.04% |
| 11 | Saudi Arabia | 28.93% |
| 12 | Bahrain | 28.82% |
| 13 | United Arab Emirates | 24.97% |
| 14 | Qatar | 19.61% |
| 15 | Turkiye | 14.11% |
| 16 | Montenegro | 13.09% |
| 17 | Georgia | 12.84% |
| 18 | Israel | 12.04% |
| 19 | New Zealand | 10.12% |
| 20 | Malta | 9.76% |
A high percentage means many pupils assessed near the end of primary did not meet the minimum reading benchmark. It is an important learning-outcome signal, but it should not be turned into a single-number verdict on an entire education system.
Russian Federation is lowest in 2021 at 1.64%
At the lower end, Russian Federation records 1.64%, Hong Kong SAR, China 1.72%, Croatia 1.92%, Ireland 2.22%, Poland 2.79%, Italy 2.82%, Lithuania 2.89%, United Kingdom 2.98%, Singapore 3.34%, and Finland 3.52%.
| 2021 low-order position | Economy/territory | Below minimum reading proficiency |
|---|---|---|
| 1 | Russian Federation | 1.64% |
| 2 | Hong Kong SAR, China | 1.72% |
| 3 | Croatia | 1.92% |
| 4 | Ireland | 2.22% |
| 5 | Poland | 2.79% |
| 6 | Italy | 2.82% |
| 7 | Lithuania | 2.89% |
| 8 | United Kingdom | 2.98% |
| 9 | Singapore | 3.34% |
| 10 | Finland | 3.52% |
| 11 | Netherlands | 3.55% |
| 12 | Czechia | 3.99% |
| 13 | Denmark | 4.05% |
| 14 | Austria | 4.08% |
| 15 | Macao SAR, China | 4.08% |
| 16 | Norway | 4.18% |
| 17 | Sweden | 4.72% |
| 18 | Spain | 4.77% |
| 19 | United States | 5.49% |
| 20 | Slovenia | 5.62% |
A low percentage means relatively few assessed pupils fell below the minimum threshold. It does not show whether advanced reading skills are strong, whether achievement gaps are small, or whether all children are enrolled and assessed.
Kenya’s 74.50% is the only 2023 observation
The most recent year in the file is 2023, but Kenya at 74.50% is the only observation. Bangladesh at 50.00% is the only 2022 observation.
A one-country year cannot support a meaningful global ranking or distribution. Using the 2021 group avoids presenting an extremely sparse latest year as if it represented the world.
The much higher 2019 average is not evidence of a global trend
The 2019 group contains 41 economies with a mean of 62.90% and a median of 69.78%. Those figures are much higher than the 2021 group, but the country composition differs sharply.
It would therefore be incorrect to conclude from these group averages alone that global reading proficiency improved dramatically between 2019 and 2021. A trend analysis needs matched countries and comparable assessment series over time.
Cross-country assessment comparability has limits
Countries can contribute data from international, regional, or national assessments that are linked to a common minimum proficiency benchmark. The purpose is to improve comparability, but assessment instruments, samples, timing, curricula, and administration can still differ.
Large gaps are informative, while very small differences should be interpreted cautiously and ideally checked against the underlying assessment documentation and uncertainty measures.
The indicator does not identify causes
Teacher supply, instructional time, learning materials, language of instruction, attendance, household conditions, nutrition, public spending, conflict, and other factors can all affect reading outcomes. This indicator reports the outcome share and does not isolate causal mechanisms.
A high below-minimum rate should therefore prompt further investigation rather than an unsupported claim that one factor caused the result.
Primary completion and reading proficiency answer different questions
Completion rates show whether pupils reach the end of the primary stage. Reading proficiency shows what pupils can do academically around that stage. A child can complete primary education and still remain below the minimum reading benchmark.
Access, completion, enrollment, and learning outcomes are complementary dimensions. They should be examined together when assessing an education system.
Lower values indicate better outcomes
Because the indicator measures the share below a minimum threshold, its direction is the reverse of a conventional achievement score. A 5% value is better than 50% in the narrow sense that fewer pupils are below minimum proficiency.
This direction should remain explicit in rankings and charts. Calling the largest values the ‘best’ results would invert the meaning of the series.
The 125 latest observations span 2001–2023
The latest non-empty observations span 2001–2023. The largest groups are 2021 with 53 economies and 2019 with 41. Only one observation is from 2023 and one from 2022.
| Observation year | Economies/territories | Share of 125 |
|---|---|---|
| 2023 | 1 | 0.8% |
| 2022 | 1 | 0.8% |
| 2021 | 53 | 42.4% |
| 2019 | 41 | 32.8% |
| 2017 | 1 | 0.8% |
| 2016 | 5 | 4.0% |
| 2015 | 3 | 2.4% |
| 2014 | 2 | 1.6% |
| 2013 | 1 | 0.8% |
| 2012 | 1 | 0.8% |
| 2011 | 5 | 4.0% |
| 2008 | 1 | 0.8% |
| 2007 | 3 | 2.4% |
| 2006 | 4 | 3.2% |
| 2004 | 1 | 0.8% |
| 2001 | 2 | 1.6% |
The complete file therefore should not be labeled a 2023 ranking of 125 economies. It is a latest-observation inventory, while the 2021 subset is the most useful recent same-year comparison.
Complete list of the 125 latest observations
The table below lists each economy or territory’s latest non-empty observation in alphabetical order. Observation year should be read alongside the percentage, especially when the latest value is old.
| Economy/territory | Observation year | Below minimum reading proficiency |
|---|---|---|
| Afghanistan | 2013 | 88.00% |
| Albania | 2021 | 7.88% |
| Algeria | 2007 | 66.53% |
| Argentina | 2019 | 58.93% |
| Armenia | 2019 | 19.91% |
| Australia | 2021 | 5.76% |
| Austria | 2021 | 4.08% |
| Azerbaijan | 2021 | 32.57% |
| Bahrain | 2021 | 28.82% |
| Bangladesh | 2022 | 50.00% |
| Belgium | 2021 | 7.71% |
| Belize | 2001 | 74.78% |
| Benin | 2019 | 54.51% |
| Botswana | 2011 | 44.30% |
| Brazil | 2019 | 45.56% |
| Bulgaria | 2021 | 7.12% |
| Burkina Faso | 2019 | 67.06% |
| Burundi | 2019 | 95.52% |
| Cambodia | 2019 | 88.98% |
| Cameroon | 2019 | 69.78% |
| Canada | 2016 | 4.26% |
| Chad | 2019 | 92.39% |
| Chile | 2019 | 23.18% |
| China | 2016 | 18.20% |
| Colombia | 2019 | 50.24% |
| Comoros | 2008 | 82.35% |
| Congo, Dem. Rep. | 2019 | 90.77% |
| Congo, Rep. | 2019 | 66.42% |
| Costa Rica | 2019 | 33.29% |
| Cote d’Ivoire | 2019 | 77.97% |
| Croatia | 2021 | 1.92% |
| Cyprus | 2021 | 8.21% |
| Czechia | 2021 | 3.99% |
| Denmark | 2021 | 4.05% |
| Dominican Republic | 2019 | 76.26% |
| Ecuador | 2019 | 65.09% |
| Egypt, Arab Rep. | 2021 | 55.43% |
| El Salvador | 2019 | 62.10% |
| Ethiopia | 2015 | 88.72% |
| Finland | 2021 | 3.52% |
| France | 2021 | 6.14% |
| Gabon | 2019 | 23.74% |
| Georgia | 2021 | 12.84% |
| Germany | 2021 | 6.41% |
| Greece | 2001 | 5.49% |
| Guatemala | 2019 | 75.92% |
| Guinea | 2019 | 77.81% |
| Honduras | 2019 | 74.27% |
| Hong Kong SAR, China | 2021 | 1.72% |
| Hungary | 2021 | 5.87% |
| Iceland | 2006 | 6.83% |
| India | 2017 | 53.70% |
| Indonesia | 2015 | 49.37% |
| Iran, Islamic Rep. | 2021 | 41.40% |
| Ireland | 2021 | 2.22% |
| Israel | 2021 | 12.04% |
| Italy | 2021 | 2.82% |
| Japan | 2019 | 1.83% |
| Jordan | 2021 | 53.36% |
| Kazakhstan | 2021 | 9.30% |
| Kenya | 2023 | 74.50% |
| Korea, Rep. | 2019 | 0.80% |
| Kosovo | 2021 | 37.92% |
| Kuwait | 2016 | 49.38% |
| Kyrgyz Republic | 2014 | 63.80% |
| Lao PDR | 2019 | 97.50% |
| Latvia | 2021 | 5.71% |
| Lesotho | 2016 | 96.60% |
| Lithuania | 2021 | 2.89% |
| Luxembourg | 2006 | 1.23% |
| Macao SAR, China | 2021 | 4.08% |
| Madagascar | 2019 | 93.74% |
| Malaysia | 2019 | 41.74% |
| Mali | 2012 | 85.74% |
| Malta | 2021 | 9.76% |
| Mauritania | 2004 | 92.95% |
| Mauritius | 2006 | 38.00% |
| Mexico | 2019 | 47.20% |
| Moldova | 2006 | 8.74% |
| Mongolia | 2007 | 38.07% |
| Montenegro | 2021 | 13.09% |
| Morocco | 2021 | 59.42% |
| Myanmar | 2019 | 89.26% |
| Netherlands | 2021 | 3.55% |
| New Zealand | 2021 | 10.12% |
| Nicaragua | 2019 | 78.10% |
| Niger | 2019 | 85.62% |
| North Macedonia | 2021 | 30.04% |
| Norway | 2021 | 4.18% |
| Oman | 2021 | 37.80% |
| Pakistan | 2019 | 70.00% |
| Panama | 2019 | 75.24% |
| Paraguay | 2019 | 74.66% |
| Peru | 2019 | 43.60% |
| Philippines | 2019 | 90.44% |
| Poland | 2021 | 2.79% |
| Portugal | 2021 | 5.82% |
| Qatar | 2021 | 19.61% |
| Romania | 2011 | 14.07% |
| Russian Federation | 2021 | 1.64% |
| Saudi Arabia | 2021 | 28.93% |
| Senegal | 2019 | 58.89% |
| Serbia | 2021 | 7.20% |
| Singapore | 2021 | 3.34% |
| Slovak Republic | 2021 | 6.35% |
| Slovenia | 2021 | 5.62% |
| South Africa | 2021 | 80.55% |
| Spain | 2021 | 4.77% |
| Sri Lanka | 2015 | 14.00% |
| Sweden | 2021 | 4.72% |
| Thailand | 2011 | 21.92% |
| Togo | 2019 | 80.63% |
| Trinidad and Tobago | 2016 | 19.66% |
| Tunisia | 2011 | 65.12% |
| Turkiye | 2021 | 14.11% |
| Uganda | 2014 | 81.10% |
| Ukraine | 2007 | 18.30% |
| United Arab Emirates | 2021 | 24.97% |
| United Kingdom | 2021 | 2.98% |
| United States | 2021 | 5.49% |
| Uruguay | 2019 | 43.41% |
| Uzbekistan | 2021 | 30.16% |
| Viet Nam | 2019 | 18.12% |
| Yemen, Rep. | 2011 | 93.50% |
| Zambia | 2019 | 98.24% |
How to interpret the comparison
First, lower values are better because the series measures the share below minimum proficiency. Second, this is not adult illiteracy. Third, it is not automatically identical to broader learning-poverty measures. Fourth, common benchmarking improves comparability but does not make every assessment identical.
Fifth, the full 125-row file mixes years, so the same-year ranking uses the 53 observations from 2021. Sixth, the indicator reports outcomes rather than causes and should be paired with access, completion, resources, and other education measures.
Source and calculation
The source is World Bank World Development Indicators SE.LPV.PRIM.LD, Pupils below minimum reading proficiency at end of primary (%), Low GAML threshold. The 2021 mean, median, quartiles, threshold counts, and rankings use only the 53 observations dated 2021. The complete table preserves all 125 latest non-empty observations.
Frequently Asked Questions
Are lower values better for this indicator?
Yes. It measures the share of pupils below the minimum benchmark, so a lower percentage means fewer pupils are below minimum reading proficiency.
Is this the same as the adult illiteracy rate?
No. It measures end-of-primary pupil performance against a reading benchmark, while adult literacy indicators use different populations and methods.
Why is 2021 used instead of 2023 for the main comparison?
Kenya is the only 2023 observation and Bangladesh the only 2022 observation, while 2021 contains 53 economies and supports a meaningful same-year comparison.
Related Articles
Green Map creates custom-edited map images using open geographic data sources such as geoBoundaries, Natural Earth, OpenStreetMap, and government open data. These maps are edited visual materials, not raw data files, and are provided for education, documents, presentations, and graphic reference.