World Bank indicator TX.VAL.TRAN.ZS.WT provides a latest non-empty estimate of transport services as a share of commercial service exports for 198 countries and economies. Observation years range from 1993 to 2025, although 96 values are from 2025 and 67 from 2024. The unweighted mean across the latest observations is 19.69% and the median is 15.25%.
This percentage is not the dollar value of transport-service exports. It describes the composition of commercial service exports: if the value is 40%, roughly 40 of every 100 units of commercial service exports are classified as transport services. A high share can reflect large transport exports, a relatively small denominator of other services, or both.
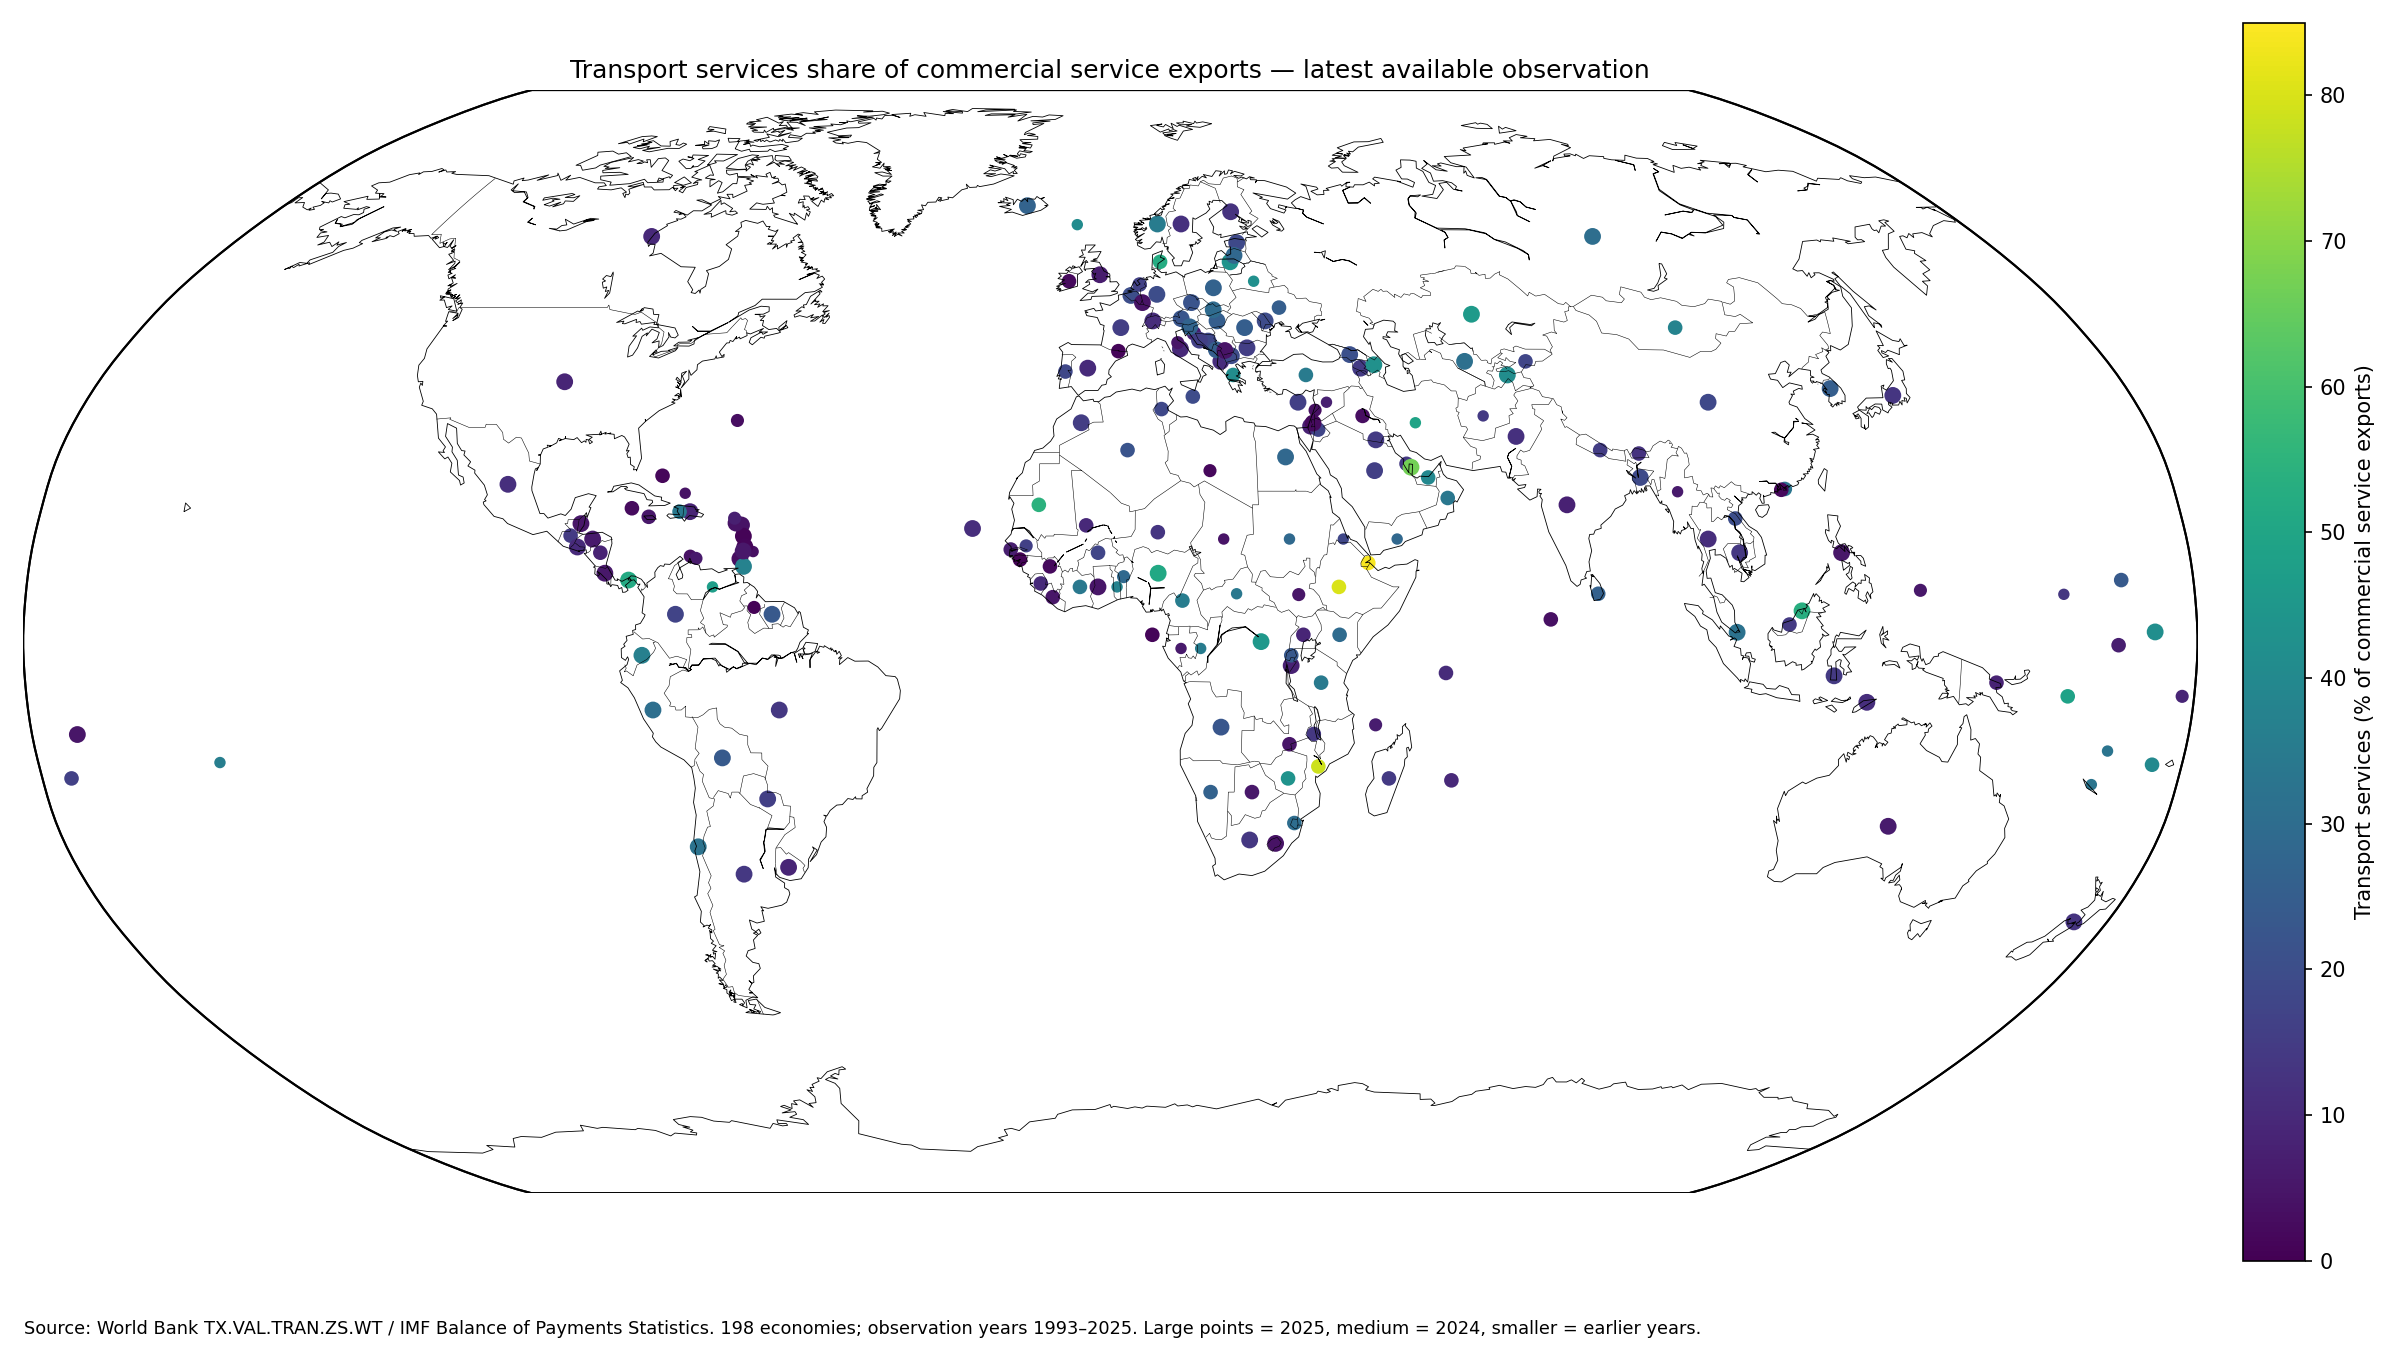
Table of Contents
Transport services cover passengers, freight, support services, post and courier
The World Bank metadata glossary defines transport as the carriage of people and objects from one location to another together with related supporting and auxiliary services. Postal and courier services are also included.
WTO technical notes describe transport services as sea, air and other transport—including land, inland waterway, space and pipeline—covering passengers, freight, carrier rentals with crew, and related support services. The indicator is therefore broader than shipping or aviation alone.
The denominator is total commercial service exports
The denominator consists of commercial services provided by residents to non-residents. It is a balance-of-payments services concept, not GDP, merchandise exports, or total exports of goods and services.
Travel, finance, insurance, telecommunications, computer services, other business services, and other service categories can affect the denominator. A transport share can therefore change even when transport exports themselves do not move much.
The median latest observation is 15.25%
The median across 198 latest observations is 15.25%. The middle half lies between 7.26% and 28.67%. The simple mean is 19.69%, above the median because a group of estimates above 50% extends the upper tail.
For a typical country composition, the median and distribution bands are more informative than the mean alone.
Sixty-six latest observations are below 10%
33 observations are below 5% and 33 are from 5% to under 10%, for a combined 66. Another 57 are from 10% to under 20%, 28 from 20% to under 30%, 38 from 30% to under 50%, and 9 are at least 50%.
| Transport share of commercial service exports | Economies | Share of 198 |
|---|---|---|
| Below 5% | 33 | 16.7% |
| 5% to under 10% | 33 | 16.7% |
| 10% to under 20% | 57 | 28.8% |
| 20% to under 30% | 28 | 14.1% |
| 30% to under 50% | 38 | 19.2% |
| 50% or more | 9 | 4.5% |
The highest latest shares include several East African economies
Djibouti has the highest latest observation at 84.28%, followed by Ethiopia at 80.26%, Mozambique at 78.44%, Qatar at 66.94%, and Mauritania at 54.35%. Brunei Darussalam, Denmark, Panama, and Nigeria also exceed 50%.
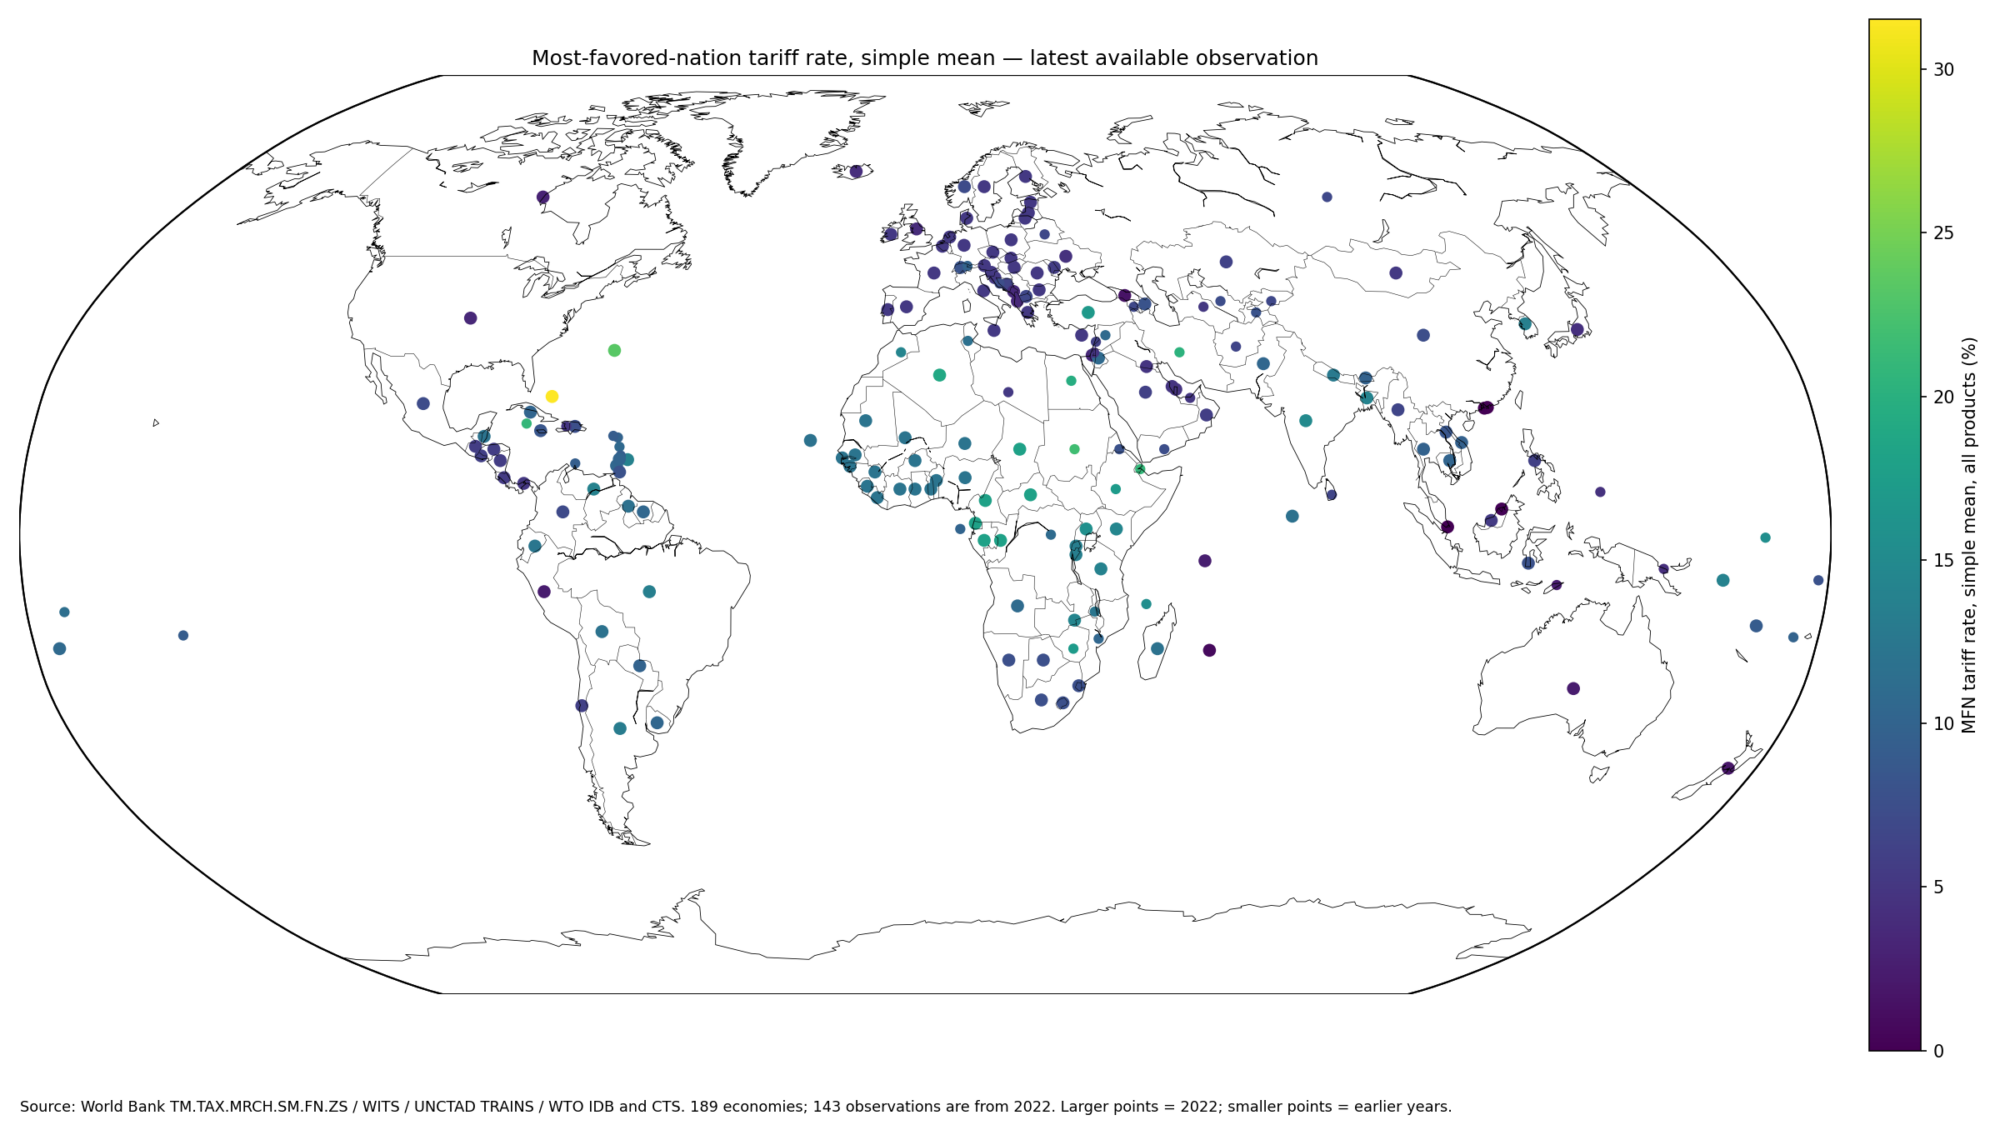
The countries do not share one single economic model. A high ratio can reflect an important transport sector, limited exports in other commercial-service categories, or a combination. The map shows where the composition is transport-heavy, not why each country reached that share.
| Latest-observation rank | Country or economy | Observation year | Transport-service share |
|---|---|---|---|
| 1 | Djibouti | 2024 | 84.28% |
| 2 | Ethiopia | 2024 | 80.26% |
| 3 | Mozambique | 2024 | 78.44% |
| 4 | Qatar | 2025 | 66.94% |
| 5 | Mauritania | 2024 | 54.35% |
| 6 | Brunei Darussalam | 2025 | 53.24% |
| 7 | Denmark | 2024 | 52.17% |
| 8 | Panama | 2025 | 51.58% |
| 9 | Nigeria | 2025 | 51.01% |
| 10 | Iran, Islamic Rep. | 2000 | 49.45% |
| 11 | Solomon Islands | 2024 | 48.84% |
| 12 | Venezuela, RB | 2016 | 47.34% |
| 13 | Kazakhstan | 2025 | 45.86% |
| 14 | Congo, Dem. Rep. | 2025 | 45.24% |
| 15 | Lithuania | 2025 | 43.80% |
The synchronized 2025 subset contains 96 economies
Among the 96 observations dated 2025, Qatar records 66.94%, Brunei Darussalam 53.24%, Panama 51.58%, Nigeria 51.01%, and Kazakhstan 45.86%.
| 2025 rank | Country or economy | Transport-service share |
|---|---|---|
| 1 | Qatar | 66.94% |
| 2 | Brunei Darussalam | 53.24% |
| 3 | Panama | 51.58% |
| 4 | Nigeria | 51.01% |
| 5 | Kazakhstan | 45.86% |
| 6 | Congo, Dem. Rep. | 45.24% |
| 7 | Lithuania | 43.80% |
| 8 | Azerbaijan | 42.68% |
| 9 | Kiribati | 41.70% |
| 10 | Tajikistan | 41.46% |
| 11 | Trinidad and Tobago | 37.43% |
| 12 | Ecuador | 36.61% |
| 13 | Norway | 35.36% |
| 14 | Chile | 32.24% |
| 15 | Singapore | 32.01% |
The 2025 subset has an unweighted mean of 19.02% and a median of 15.42%. The first quartile is 9.43% and the third quartile 25.69%. It is temporally cleaner than the 198-economy latest-value table for same-year comparison.
The largest 2025 group is between 10% and 20%
In 2025, 11 observations are below 5%, 15 from 5% to under 10%, 35 from 10% to under 20%, 17 from 20% to under 30%, 14 from 30% to under 50%, and 4 are at least 50%.
Even within one reference year, values range from around 1% to above 60%, showing substantial differences in export-service composition.
East Africa shows both clustering and sharp contrasts
Djibouti at 84.28%, Ethiopia at 80.26%, and Mozambique at 78.44% are among the highest 2024 observations. Tanzania is also above the global median at 34.69% and Kenya at 29.27%, while Uganda is much lower at 8.84%.
The pattern shows that geographic proximity does not guarantee a similar service-export structure. The data alone do not identify whether ports, transit activity, airline services, or the size of other service exports caused the differences.
The Gulf contains one very high outlier and several mid-range shares
Qatar records 66.94% in 2025, while the United Arab Emirates is 39.77% in 2024 and Oman 33.71%. Saudi Arabia is 15.66% in 2025, Kuwait 14.92%, and Bahrain 14.11% in 2024.
That spread within a relatively compact region is a reminder that the denominator matters. Economies with large travel, finance, business, or digital-service exports can have a lower transport share even when transport activity itself is substantial.
Central Asia also shows a transport-heavy group
Kazakhstan records 45.86% in 2025, Tajikistan 41.46%, and Uzbekistan 31.11%. The Kyrgyz Republic is lower at 17.88% in 2024.
Landlocked geography and transit activity may be relevant context, but this single ratio cannot prove that geography or a particular transport policy caused the observed shares.
The Caribbean has a notable contrast
Trinidad and Tobago reaches 37.43% in 2025, while Dominica is 0.91%, St. Lucia 1.31%, Grenada 2.74%, the Bahamas 1.40% in 2024, and Jamaica 5.49% in 2024.
Travel-heavy service exports can mechanically reduce transport’s percentage of the denominator, but country-specific causes require the underlying service-export values and composition.
A low share does not prove that transport exports are small in dollars
Guyana at 0.66%, Guinea-Bissau 0.91%, Dominica 0.91%, Andorra 1.29%, and Sao Tome and Principe 1.30% sit near the bottom of the latest-value distribution.
Absolute scale requires value data such as commercial service exports in current U.S. dollars together with the transport-services export value. A large service exporter can have a low transport share and still export substantial transport services.
| Low-end rank | Country or economy | Observation year | Transport-service share |
|---|---|---|---|
| 1 | Guyana | 2023 | 0.66% |
| 2 | Guinea-Bissau | 2024 | 0.91% |
| 3 | Dominica | 2025 | 0.91% |
| 4 | Andorra | 2024 | 1.29% |
| 5 | Sao Tome and Principe | 2024 | 1.30% |
| 6 | St. Lucia | 2025 | 1.31% |
| 7 | Bahamas, The | 2024 | 1.40% |
| 8 | Macao SAR, China | 2024 | 1.70% |
| 9 | Libya | 2023 | 1.76% |
| 10 | Guinea | 2024 | 2.09% |
| 11 | Ireland | 2024 | 2.22% |
| 12 | Cayman Islands | 2024 | 2.40% |
| 13 | West Bank and Gaza | 2025 | 2.43% |
| 14 | Grenada | 2025 | 2.74% |
| 15 | Bermuda | 2023 | 3.22% |
A rising share does not necessarily mean transport exports increased
Both numerator and denominator can move. If transport exports are unchanged while travel, financial, ICT, or other service exports fall, the transport percentage rises. Conversely, transport exports can grow while the share falls if other services grow faster.
A time-series interpretation should therefore pair the percentage with transport-service export values and total commercial service exports.
Commercial service exports are different from merchandise exports
The denominator is services, not exported goods. The fact that ships or aircraft move physical merchandise does not put the value of the goods themselves into the denominator. The exported service is the transport service performed for non-residents.
Measures such as manufactures as a share of merchandise exports describe a different trade structure and should not be combined as if they used the same denominator.
Mixed observation years are the main limitation of the full map
Of the 198 latest observations, 96 are from 2025, 67 from 2024, and 14 from 2023. 21 are from 2022 or earlier, and the oldest latest observation dates to 1993.
The World Bank most-recent-non-empty approach broadens geographic coverage but does not synchronize time. Point sizes on the map therefore reveal recency instead of presenting old observations as current 2025 values.
| Observation year | Economies |
|---|---|
| 2025 | 96 |
| 2024 | 67 |
| 2023 | 14 |
| 2022 | 2 |
| 2021 | 2 |
| 2020 | 2 |
| 2019 | 1 |
| 2018 | 1 |
| 2017 | 1 |
| 2016 | 4 |
| 2015 | 1 |
| 2014 | 1 |
| 2011 | 1 |
| 2010 | 1 |
| 2000 | 2 |
| 1994 | 1 |
| 1993 | 1 |
The simple country mean is not a world export-weighted share
The 19.69% overall mean and 19.02% 2025 mean give every economy equal weight. A major service exporter and a very small exporter each contribute one percentage.
A world transport share of commercial service exports would require weighting countries by the value of their commercial service exports or using an official aggregate. The mean and median here summarize country ratios only.
Source and calculation notes
The source is World Bank World Development Indicators series TX.VAL.TRAN.ZS.WT, based on IMF Balance of Payments Statistics Yearbook and data files. The analysis uses 198 latest non-empty observations for rankings and distribution statistics and separately summarizes the 96 observations from 2025.
All 198 country codes are matched to geographic centroids for the map, producing a 100% match. Point size distinguishes recent from older observations, and no missing economy is filled with zero.
Frequently Asked Questions
What is included in transport services?
The category includes passenger and freight transport, sea, air and other modes, related supporting services, carrier rentals with crew, and postal and courier services.
Does a high transport share mean transport exports are large in dollar terms?
Not necessarily. The indicator is a share of total commercial service exports, so the size of other service-export categories also changes the percentage.
Are all 198 observations from 2025?
No. Observation years range from 1993 to 2025; 96 are from 2025, 67 from 2024, and 14 from 2023.
Related Articles
Green Map creates custom-edited map images using open geographic data sources such as geoBoundaries, Natural Earth, OpenStreetMap, and government open data. These maps are edited visual materials, not raw data files, and are provided for education, documents, presentations, and graphic reference.