Textiles and clothing account for very different shares of manufacturing activity across economies. The World Bank indicator NV.MNF.TXTL.ZS.UN measures the value added generated by textiles and clothing industries as a percentage of total manufacturing value added. The verified dataset contains 161 economies and uses the most recent non-empty observation available for each one.
The phrase “most recent” needs careful handling. Only 17 observations are from 2024, while 67 are from 2023 and 17 from 2022. Sixty economies have observations from 2021 or earlier, and the oldest value dates to 1973. This is therefore not a uniform 2024 cross-section. It is a latest-available comparison whose observation year must be read alongside the percentage.
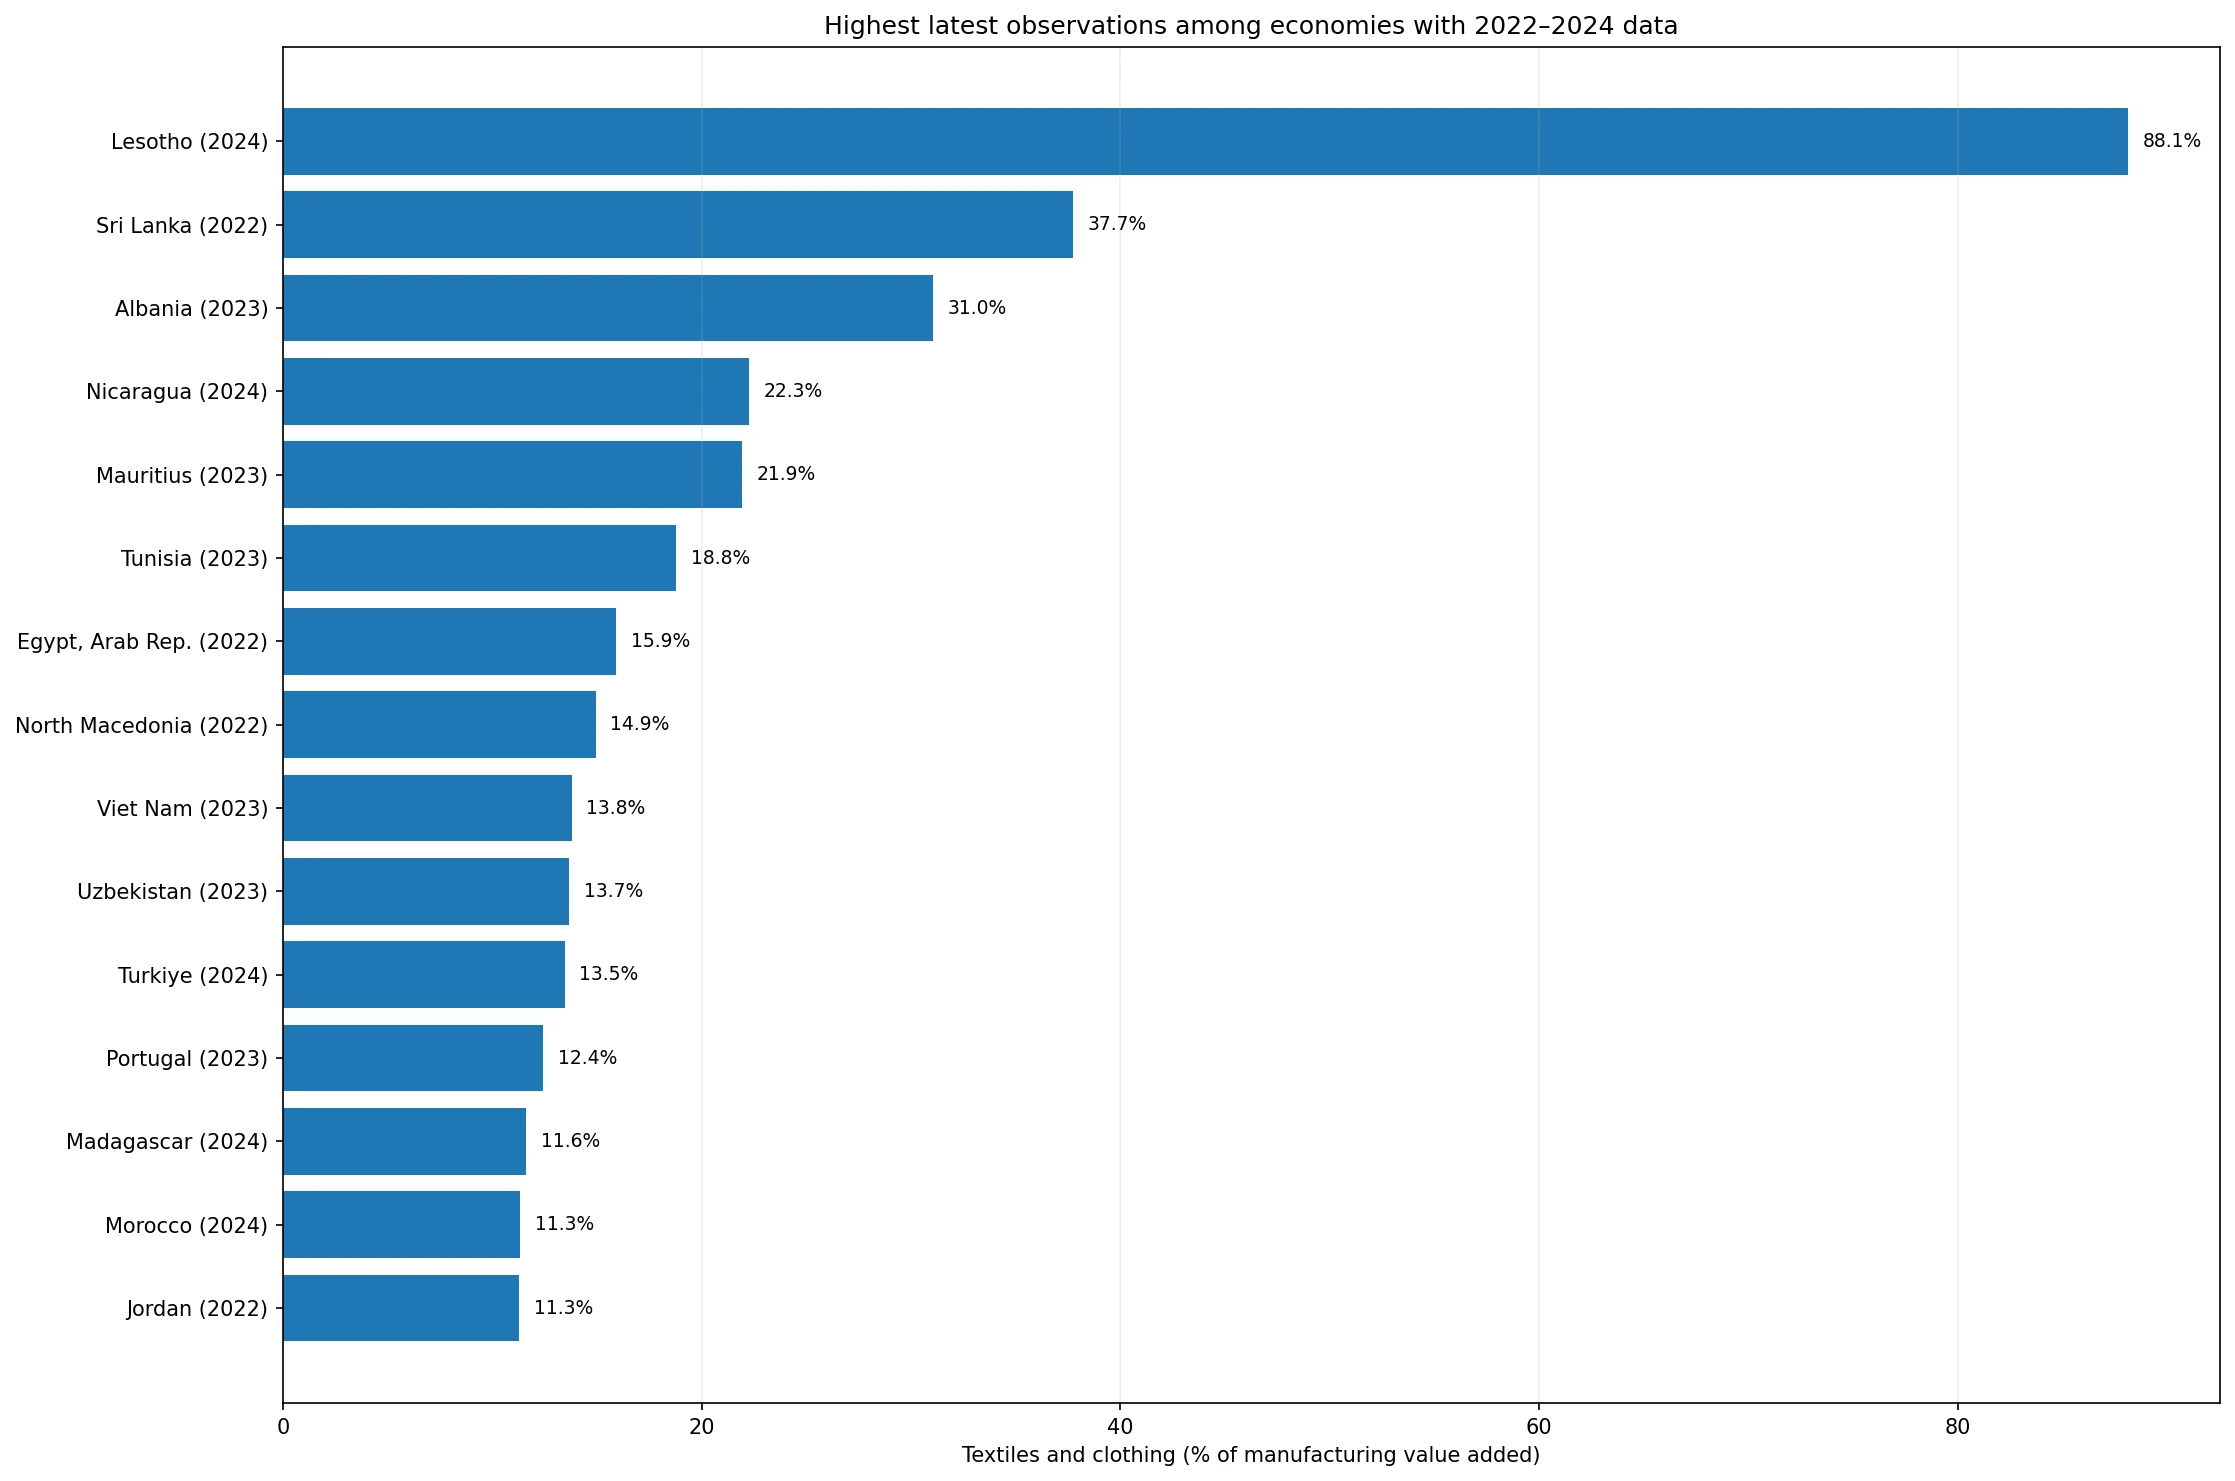
Table of Contents
What the indicator measures
The indicator is narrower than “the size of the textile industry” and broader than apparel factories alone. The World Bank description refers to ISIC Rev. 3 divisions 17–19, covering textiles, apparel, dressing and dyeing of fur, tanning of leather, and related manufacturing. Value added is the contribution created by a producer or industry, broadly calculated as the value of output less the value of intermediate goods and services used in production.
Because the denominator is manufacturing value added, a value of 20% means that about one-fifth of manufacturing value added in that economy and year came from the textiles-and-clothing group. It does not mean that textiles represented 20% of GDP, exports, employment, factory output, or corporate revenue. Those are different questions and require different datasets.
The denominator also changes the interpretation of high values. An economy can have a large textile and clothing sector in absolute terms but a modest percentage if electronics, machinery, chemicals, food processing, vehicles, or other manufacturing industries are also large. Conversely, an economy with a relatively narrow manufacturing base can record a high percentage even if its absolute textile output is not among the world’s largest.
The highest latest-available values mix very different years
Across all 161 latest-available observations, Lesotho records 88.1% in 2024. Cambodia follows with 86.5%, but that observation is from 2000. The Syrian Arab Republic records 78.5% in 2005, Bangladesh 56.6% in 2020, Sri Lanka 37.7% in 2022, and Albania 31.0% in 2023. The values are real observations from the same indicator, but they do not describe the same moment in time.
| Economy | Observation year | Textiles and clothing share |
|---|---|---|
| Lesotho | 2024 | 88.1% |
| Cambodia | 2000 | 86.5% |
| Syrian Arab Republic | 2005 | 78.5% |
| Bangladesh | 2020 | 56.6% |
| Sri Lanka | 2022 | 37.7% |
| Albania | 2023 | 31.0% |
| Pakistan | 2018 | 29.6% |
| El Salvador | 1998 | 28.2% |
That mixed-year table is useful mainly as a warning against a simple ranking. A 2024 value for Lesotho and a 2000 value for Cambodia should not be treated as if they were the result of the same global industrial conditions. The older observation may still be the most recent non-empty value in the source for that economy, but it is not necessarily representative of its current manufacturing structure.
For this reason, a more defensible contemporary comparison is to narrow the year window. Doing so reduces coverage but improves comparability. It also reveals whether a striking value is part of a recent pattern or is being carried forward from a much older reporting year.
A 2022–2024 subset gives a more comparable recent view
There are 101 economies with observations from 2022, 2023, or 2024. Within this subset, the median textiles-and-clothing share is 3.25% and the mean is 6.36%. The mean sits above the median because a relatively small number of high values pull the average upward. Sixteen of the 101 economies are at or above 10%, five are at or above 20%, and only one exceeds 50%.
| Economy | Observation year | Share |
|---|---|---|
| Lesotho | 2024 | 88.1% |
| Sri Lanka | 2022 | 37.7% |
| Albania | 2023 | 31.0% |
| Nicaragua | 2024 | 22.3% |
| Mauritius | 2023 | 21.9% |
| Tunisia | 2023 | 18.8% |
| Egypt, Arab Rep. | 2022 | 15.9% |
| North Macedonia | 2022 | 14.9% |
| Viet Nam | 2023 | 13.8% |
| Uzbekistan | 2023 | 13.7% |
Lesotho remains the strongest outlier in the recent subset at 88.1% in 2024. Sri Lanka records 37.7% in 2022, Albania 31.0% in 2023, Nicaragua 22.3% in 2024, and Mauritius 21.9% in 2023. Tunisia, Egypt, North Macedonia, Viet Nam, and Uzbekistan also appear among the higher recent observations. These figures describe manufacturing composition, not an overall ranking of industrial strength.
A high share indicates specialization or concentration within manufacturing, but it does not establish why that structure exists. Trade specialization, supply chains, investment patterns, labor availability, domestic demand, industrial policy, and the size of competing manufacturing sectors could all matter, but those explanations require evidence beyond this single indicator. The safest conclusion from the percentage alone is simply that textiles and clothing make up a larger or smaller part of manufacturing value added.
Observation-year gaps are the central limitation
Only 84 of the 161 economies, or 52.2%, have observations from 2023 or 2024. Expanding the window to 2022 raises coverage to 101 economies, or 62.7%. A total of 112 economies, 69.6%, have values from 2020–2024. That leaves 49 economies with latest observations from before 2020. Twenty-three are from before 2000 and 12 are from before 1990.
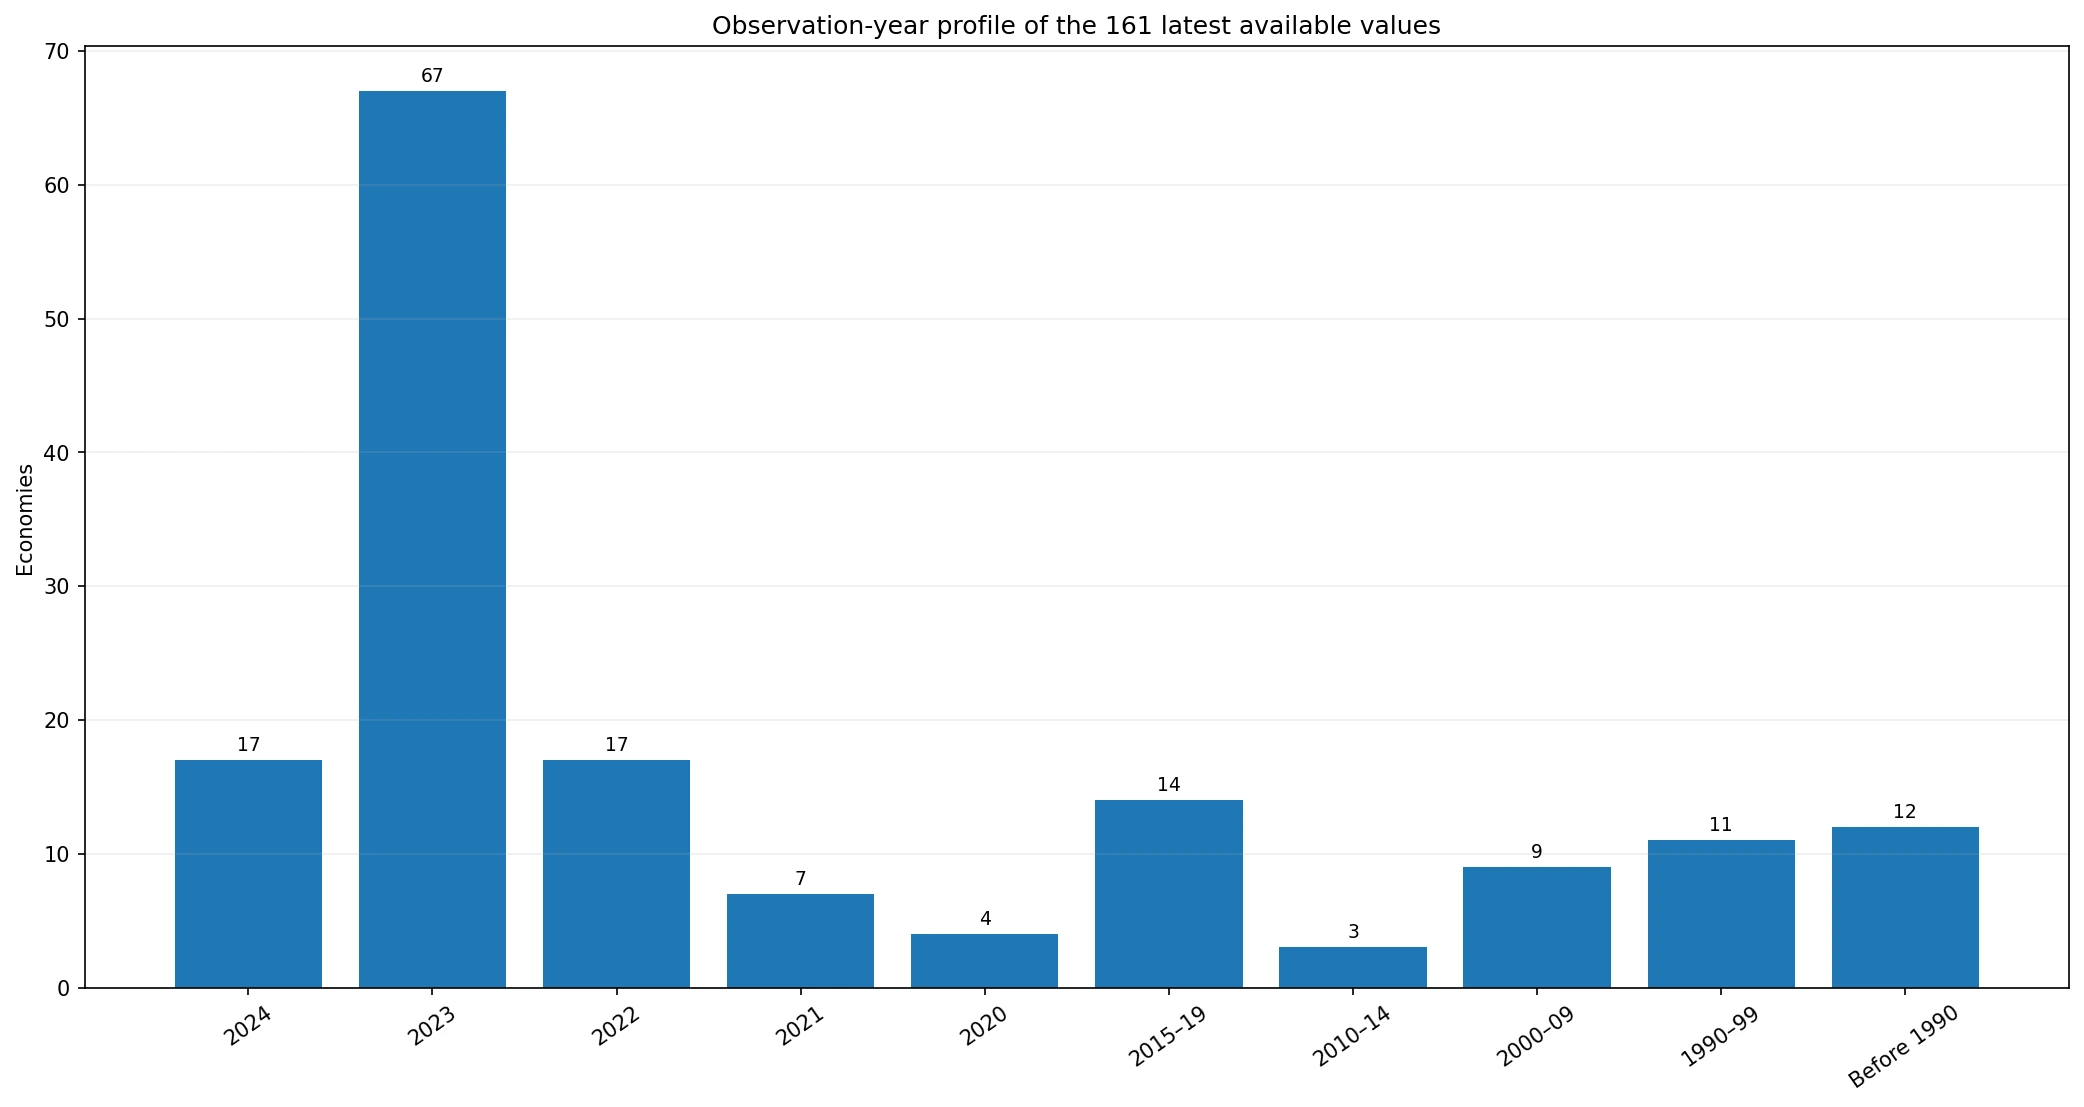
This matters because industrial structure can change substantially over decades. A country may diversify away from clothing, move into higher-value manufacturing, lose production to other locations, or expand its textile value chain. None of those changes can be inferred when the only available value is old. The age of the observation therefore becomes part of the data, not a minor footnote.
The latest-available format is still useful for broad coverage. It prevents economies with reporting gaps from disappearing entirely and shows the range of values observed in the indicator. But it is best used for structural screening. For any claim about the current position of a particular economy, the observation year should be checked first; for any claim about change, the full time series is necessary.
The overall distribution is strongly concentrated at low shares
Across all 161 latest-available observations, the median is 3.91% and the mean is 7.96%. Thirty-six economies are at or above 10%, 13 are at or above 20%, eight are at or above 25%, and four exceed 50%. At the low end, 18 observations are below 1%, including one exact zero and one slightly negative value.
The gap between the median and mean reflects a right-skewed distribution: most economies have relatively small textiles-and-clothing shares, while a limited group has much higher concentrations. That does not imply that low-share economies lack textile production. It means that other manufacturing industries account for a larger portion of their manufacturing value added, or that textiles and clothing contribute only a small measured share in the relevant year.
Similarly, a high percentage should not be interpreted as a large absolute market. If total manufacturing value added is small, even an 80% share can correspond to less absolute value added than a 5% share in a very large manufacturing economy. Absolute manufacturing value added and sector-specific value added are therefore essential companions when the question is economic scale rather than industrial composition.
How to read zero and negative values
The dataset contains one value of exactly 0% and one slightly negative observation: the Central African Republic at about -0.39% in 1993. Because value added is derived from output minus intermediate consumption, negative industry value added can occur in national-accounts data under unusual conditions. It should not be interpreted as negative physical production. In this case the observation is also more than three decades old, so it is particularly unsuitable as evidence of the economy’s current textile sector.
Near-zero values require similar caution. They do not prove that an economy has no textile factories, no clothing exports, or no employment in the sector. They only indicate that the measured contribution of the covered industries to manufacturing value added was very small in the observation year. Production, trade, employment, and enterprise counts are separate dimensions.
What to combine with this indicator
The percentage becomes much more informative when paired with other data. Total manufacturing value added separates composition from scale. Sector-specific exports show whether textile and clothing production is strongly connected to external markets. Employment and wage data show whether the sector’s labor-market importance resembles its value-added importance. Productivity measures can distinguish labor-intensive growth from higher value creation per worker.
- Total manufacturing value added to separate percentage share from absolute manufacturing scale
- Textile and apparel exports to compare manufacturing composition with trade specialization
- Industry employment and wages to compare value creation with labor-market importance
- The full historical series of NV.MNF.TXTL.ZS.UN to measure structural change rather than a single latest point
It is also useful to compare the textile share with other manufacturing subsectors. A falling textile percentage does not automatically signal contraction if other manufacturing industries are growing faster. Likewise, a rising share can reflect textile expansion, weakness elsewhere in manufacturing, or both. Decomposing the denominator is necessary before assigning a cause to the movement.
Source, coverage, and interpretation limits
The source is the World Bank indicator NV.MNF.TXTL.ZS.UN, “Textiles and clothing (% of value added in manufacturing).” The dataset used here contains one most recent non-empty observation for each of 161 economies. Values are percentages of manufacturing value added, not percentages of GDP, exports, employment, or total industrial output.
The principal limitation is the wide observation-year range from 1973 to 2024. The full set should therefore be read as a collection of latest available observations rather than a 2024 ranking. For a closer-to-current comparison, the 2022–2024 subset of 101 economies is more defensible. For trends, the proper method is to retrieve multiple years for the same economy and compare like-for-like observations.
Frequently Asked Questions
What does the textiles and clothing share of manufacturing value added measure?
It measures the value added generated by covered textile and clothing industries as a percentage of total manufacturing value added. It is not a GDP, export, employment, or physical-output share.
Are all 161 observations from 2024?
No. Only 17 are from 2024, and the latest available observation years range from 1973 to 2024. The year must be read together with the percentage.
How can I make a more current comparison?
A narrower window, such as the 101 economies with observations from 2022–2024, is more comparable. Trend analysis requires the full time series for the same economy.
Related Articles
Green Map creates custom-edited map images using open geographic data sources such as geoBoundaries, Natural Earth, OpenStreetMap, and government open data. These maps are edited visual materials, not raw data files, and are provided for education, documents, presentations, and graphic reference.