World Bank indicator NV.IND.TOTL.KD.ZG provides a latest non-empty annual growth rate for industry including construction in 199 countries and territories. 161 observations are from 2025 and 26 from 2024, while a small remainder is older. The unweighted mean across all latest observations is 3.05% and the median 2.50%. Palau and Tonga lead the full latest-value table, but both values are from 2024.
This is a real growth rate for industry value added, not industry’s current share of GDP. The World Bank defines industry including construction as ISIC Rev.4 divisions 05–43: mining, manufacturing, construction, electricity, water, and gas. The growth rate is the year-over-year percentage change in the constant-price series, using 2015 as the reference year.
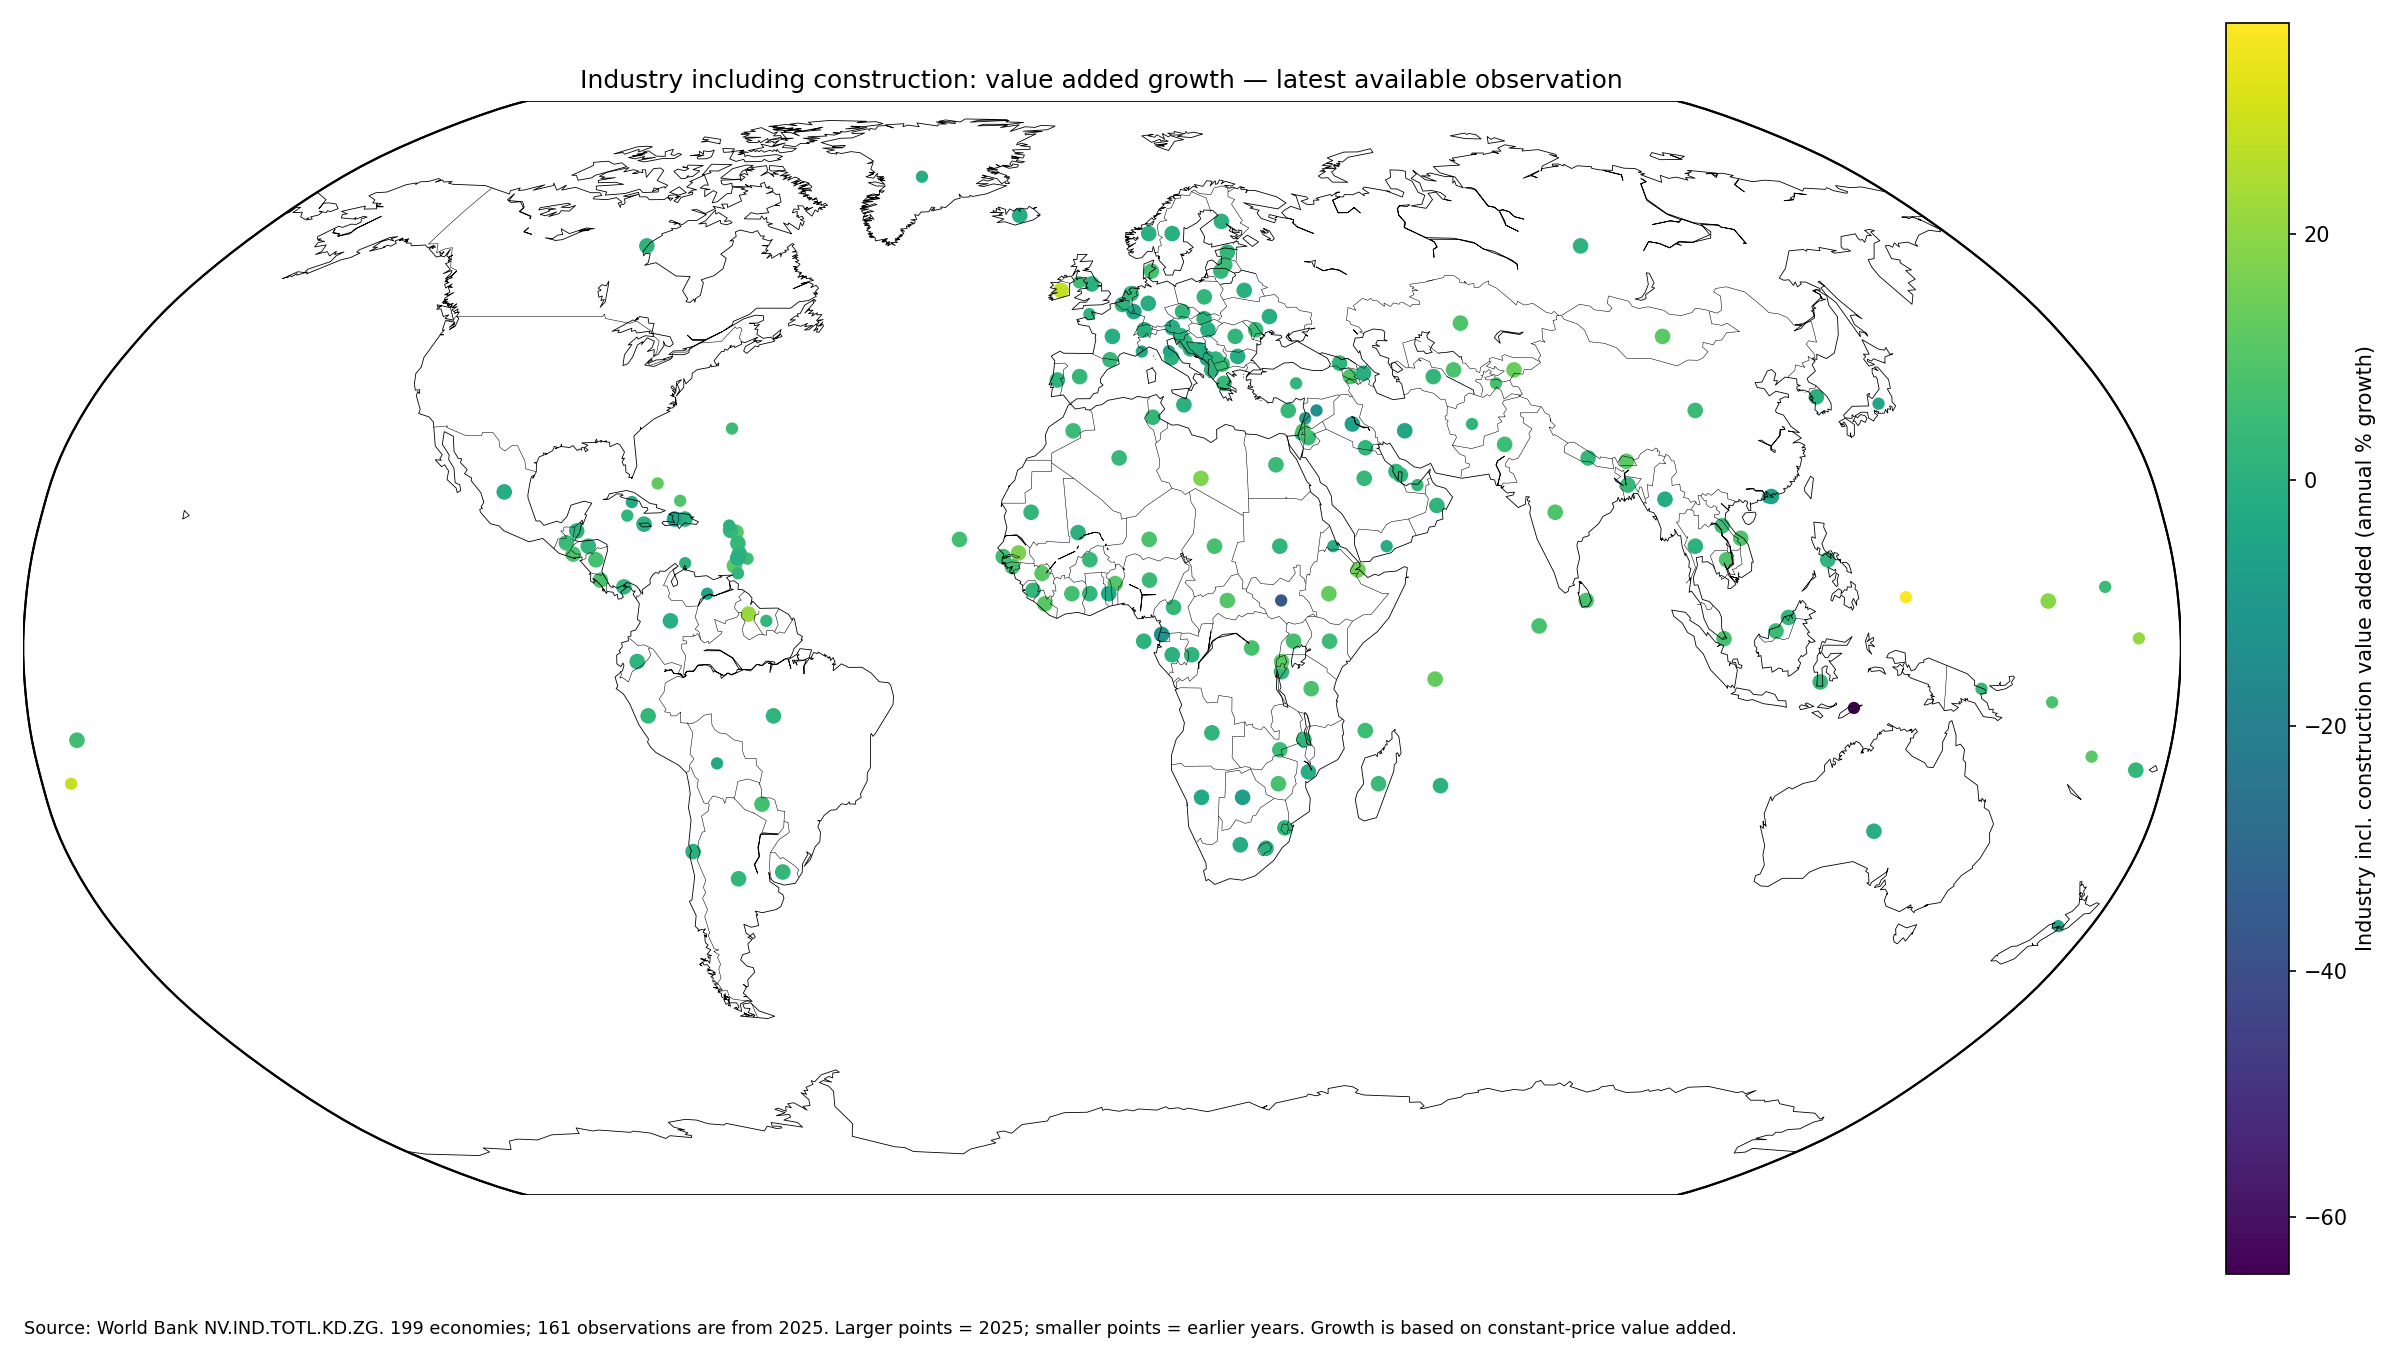
Table of Contents
What industry value-added growth measures
Value added is output produced by an industry minus intermediate goods and services used in production. The indicator measures how that real value added changes from the previous year. It is not a sales-growth rate and it is not simply the percentage change in the nominal value of industrial output.
The World Bank metadata glossary defines the sector scope and the constant-price growth calculation. The World Bank API provides the latest country observations. The source framework draws on official national statistics, national accounts, central banks, and World Bank staff estimates.
The full latest-value ranking mixes 2024 and 2025 leaders
Palau records 37.23%, Tonga 28.28%, Ireland 27.95%, Guyana 21.34%, and Kiribati 21.10%. Palau, Tonga, and Kiribati are 2024 values, while Ireland and Guyana are 2025.
That timing difference matters. The 199-economy latest-value view maximizes coverage, but it should not be labeled a complete 2025 ranking. Every value belongs with its observation year.
| Rank | Country or territory | Observation year | Industry value-added growth |
|---|---|---|---|
| 1 | Palau | 2024 | 37.23% |
| 2 | Tonga | 2024 | 28.28% |
| 3 | Ireland | 2025 | 27.95% |
| 4 | Guyana | 2025 | 21.34% |
| 5 | Kiribati | 2024 | 21.10% |
| 6 | Micronesia, Fed. Sts. | 2025 | 19.10% |
| 7 | Libya | 2025 | 17.43% |
| 8 | Senegal | 2025 | 16.68% |
| 9 | Djibouti | 2025 | 15.27% |
| 10 | Kyrgyz Republic | 2025 | 13.96% |
| 11 | Ethiopia | 2025 | 13.01% |
| 12 | Seychelles | 2025 | 12.99% |
| 13 | Bahamas, The | 2024 | 12.48% |
| 14 | Bhutan | 2025 | 11.33% |
| 15 | Rwanda | 2025 | 11.15% |
The 2025 same-year subset covers 161 economies
Restricting the data to 2025 leaves 161 economies. Ireland leads at 27.95%, followed by Guyana at 21.34%, Micronesia at 19.10%, Libya at 17.43%, and Senegal at 16.68%.
| 2025 rank | Country or territory | Growth rate |
|---|---|---|
| 1 | Ireland | 27.95% |
| 2 | Guyana | 21.34% |
| 3 | Micronesia, Fed. Sts. | 19.10% |
| 4 | Libya | 17.43% |
| 5 | Senegal | 16.68% |
| 6 | Djibouti | 15.27% |
| 7 | Kyrgyz Republic | 13.96% |
| 8 | Ethiopia | 13.01% |
| 9 | Seychelles | 12.99% |
| 10 | Bhutan | 11.33% |
| 11 | Rwanda | 11.15% |
| 12 | Mongolia | 10.98% |
| 13 | Grenada | 10.85% |
| 14 | Liberia | 10.77% |
| 15 | Guinea | 10.77% |
The 2025 subset has an unweighted mean of 3.68% and a median of 2.64%. 17 economies record growth of at least 10%, while 28 have negative growth. Same-year comparison removes most of the timing ambiguity in the full latest-value table.
Negative growth means real industry value added fell
Across the 199 latest observations, 44 values are negative. Timor-Leste is lowest at -64.61%, followed by South Sudan at -36.78%, Equatorial Guinea at -13.62%, and the Syrian Arab Republic at -13.39%. Some of those observations are older than 2025.
A negative rate means the constant-price industry value-added measure declined from the previous year. It does not by itself establish a long-term deindustrialization trend. Mining cycles, construction activity, manufacturing output, utilities, base effects, and one-off disruptions can all move the aggregate.
| Low-end rank | Country or territory | Observation year | Industry value-added growth |
|---|---|---|---|
| 1 | Timor-Leste | 2024 | -64.61% |
| 2 | South Sudan | 2015 | -36.78% |
| 3 | Equatorial Guinea | 2025 | -13.62% |
| 4 | Syrian Arab Republic | 2022 | -13.39% |
| 5 | Botswana | 2025 | -7.78% |
| 6 | Iraq | 2025 | -6.48% |
| 7 | Macao SAR, China | 2024 | -6.04% |
| 8 | Lebanon | 2024 | -5.85% |
| 9 | Venezuela, RB | 2014 | -5.84% |
| 10 | Haiti | 2025 | -5.11% |
| 11 | Hong Kong SAR, China | 2025 | -4.98% |
| 12 | Luxembourg | 2025 | -4.81% |
| 13 | Iran, Islamic Rep. | 2025 | -4.78% |
| 14 | New Zealand | 2024 | -4.66% |
| 15 | Japan | 2024 | -4.58% |
The distribution runs from -64.61% to 37.23%
The first quartile is 0.29%, the median 2.50%, and the third quartile 6.23%. 10 observations are below -5%, 34 are from -5% to under zero, 97 are from zero to under 5%, 36 are from 5% to under 10%, and 22 are at least 10%.
The mean of 3.05% sits above the median because a relatively small number of high-growth observations pull the upper tail upward. For volatile annual growth data, the median and distribution bands are more informative than the mean alone.
Industry is broader than manufacturing
In this World Bank series, industry includes mining and quarrying, manufacturing, utilities, and construction. A high industry growth rate therefore does not prove that manufacturing alone is booming.
A resource-producing economy can be driven by mining, while another economy’s result may reflect construction or electricity. Manufacturing-specific growth requires a separate manufacturing value-added indicator.
Industry growth is not the same as GDP growth
Industry including construction is only one component of the economy. Services, agriculture, taxes, and other national-account components can move differently, so a 10% industry growth rate does not imply 10% GDP growth.
Industry can contract while services expand enough to keep GDP growing, or industry can surge while weakness elsewhere limits total GDP growth. Sector growth and economy-wide growth should remain separate concepts.
A high rate does not mean a large industrial sector
Growth is a change rate, not a size measure. A small industrial base can post a very high percentage after a rebound, while a very large industrial economy may grow slowly in percentage terms.
Industrial scale is better measured with constant-price or current-price industry value added, or with industry value added as a share of GDP. Growth and level answer different questions.
Base effects can create extreme rates
If industry output was unusually weak in the prior year, a normalization can produce a very high growth rate. Conversely, a one-off boom in the previous year can be followed by a negative rate even if the longer-run level remains elevated.
That is why one annual rate should not be treated as a structural trend. Multi-year series are needed to distinguish temporary rebounds from sustained expansion or contraction.
Most observations are recent, but not all
187 of the 199 observations are from 2024–2025, while 12 are from 2023 or earlier. The oldest latest observation is from 2009. The dataset is therefore relatively current overall, but the older rows should not be described as present-day growth rates.
For current-period comparison, the 2025 subset is cleaner. For wider country coverage, the full latest-observation view is useful as long as the year remains visible.
The country mean is not a world industry-weighted growth rate
The 3.05% full-sample mean and the 3.68% 2025 mean give each economy equal weight. A small economy and a large industrial economy each count once.
A true global industry growth rate would require value-added weights from the previous period. The means and medians here summarize country growth-rate distributions rather than world industrial output.
Source and calculation notes
The source is World Bank World Development Indicators series NV.IND.TOTL.KD.ZG. The analysis uses the latest non-empty observation for 199 economies and separately analyzes the 161 observations from 2025. The official World Bank API provides the series.
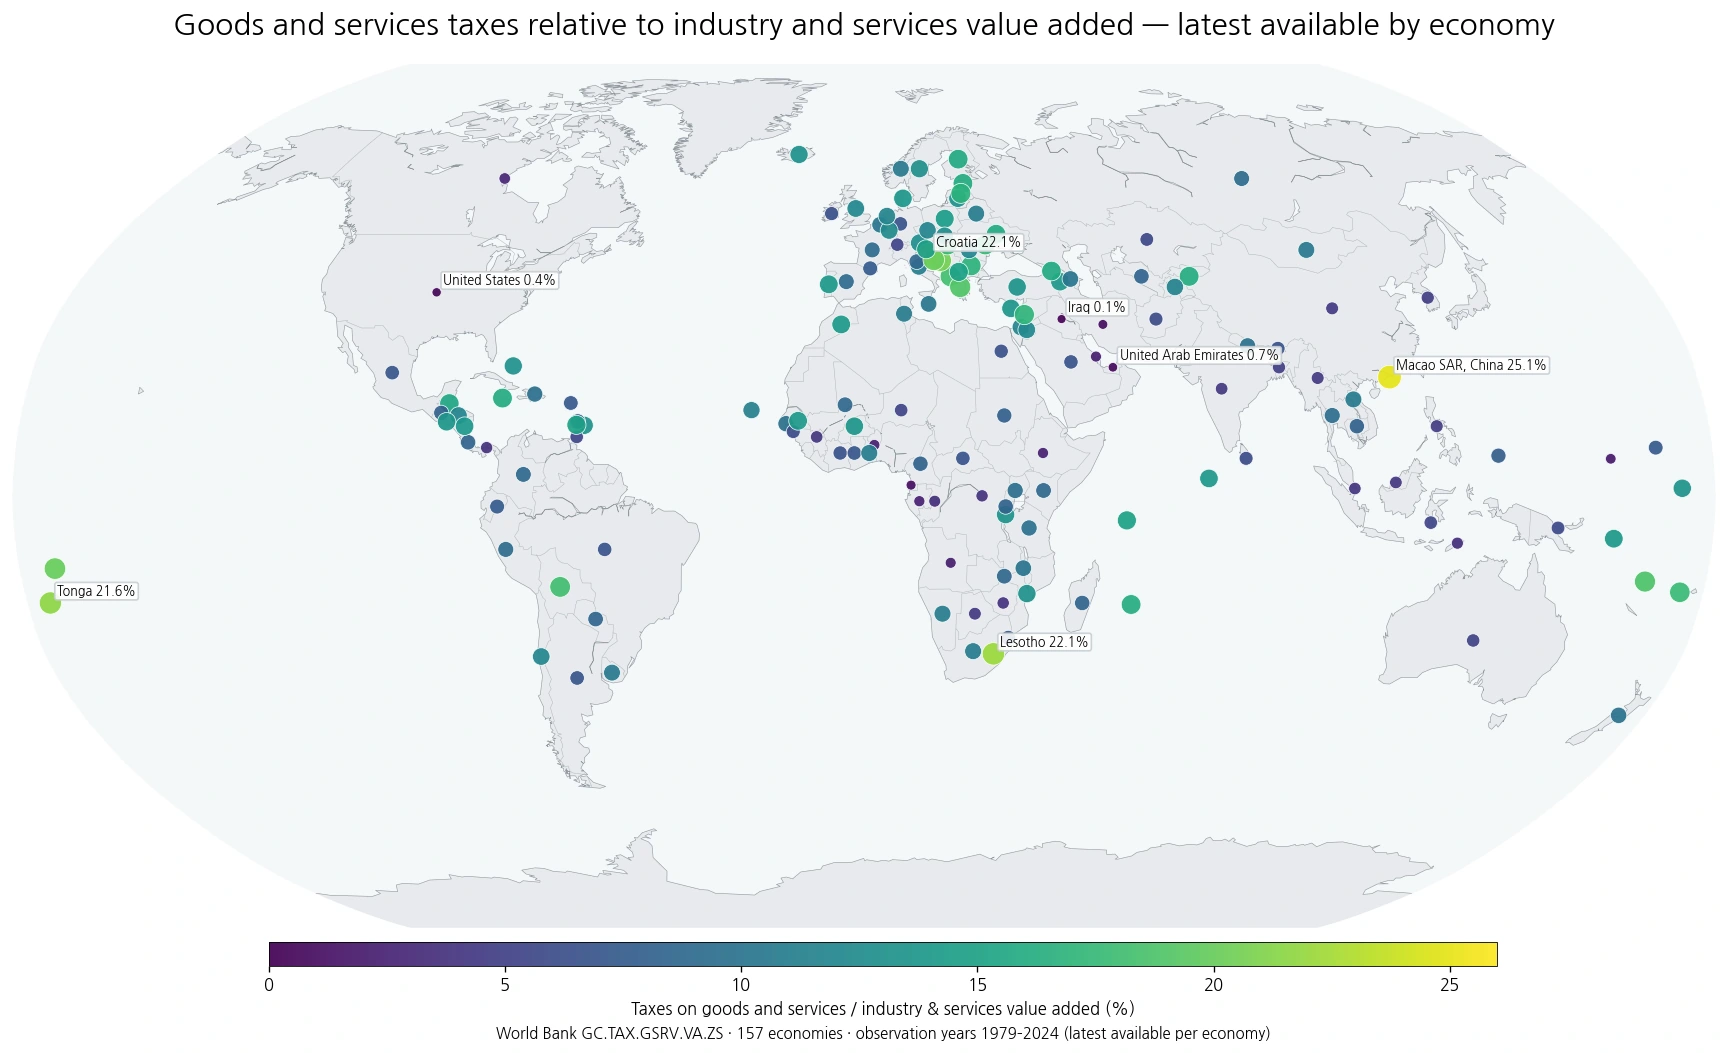
All 199 reported country codes are joined to geographic centroids for the map, producing a 100% match. Larger points denote 2025 and smaller points earlier observations. Missing economies are not converted to zero.
Frequently Asked Questions
Is industry value-added growth the same as industry’s share of GDP?
No. It is the annual real growth rate of value added from mining, manufacturing, construction, electricity, water, and gas.
Are all 199 observations from 2025?
No. 161 are from 2025, 26 from 2024, and the remainder are older.
What does a negative growth rate mean?
It means constant-price industry value added fell from the previous year; one negative year does not by itself establish a long-term decline.
Related Articles
Green Map creates custom-edited map images using open geographic data sources such as geoBoundaries, Natural Earth, OpenStreetMap, and government open data. These maps are edited visual materials, not raw data files, and are provided for education, documents, presentations, and graphic reference.