In 2024, renewable fuel consumption for useful thermal output was highly concentrated across the 50 states and the District of Columbia. The 51 reported observations sum to 795.08 million MMBtu. Georgia led with 115.71 million MMBtu, followed by Alabama at 103.46 and Louisiana at 67.43. Eleven states have an official value of zero. The mean was 15.59 million MMBtu, but the median was only 2.15, showing that a relatively small group of high-consumption states pulled the average upward.
The measure comes from the U.S. Energy Information Administration field `consumption-uto-btu`, with fuel type fixed to renewable and annual frequency for 2024. The unit is million MMBtu. It should therefore be read as the heat-content amount of renewable fuel consumed for useful thermal output, not as electricity generation, renewable capacity, or total renewable energy use across every purpose. That scope is essential because several EIA series use similar words while measuring different activities.
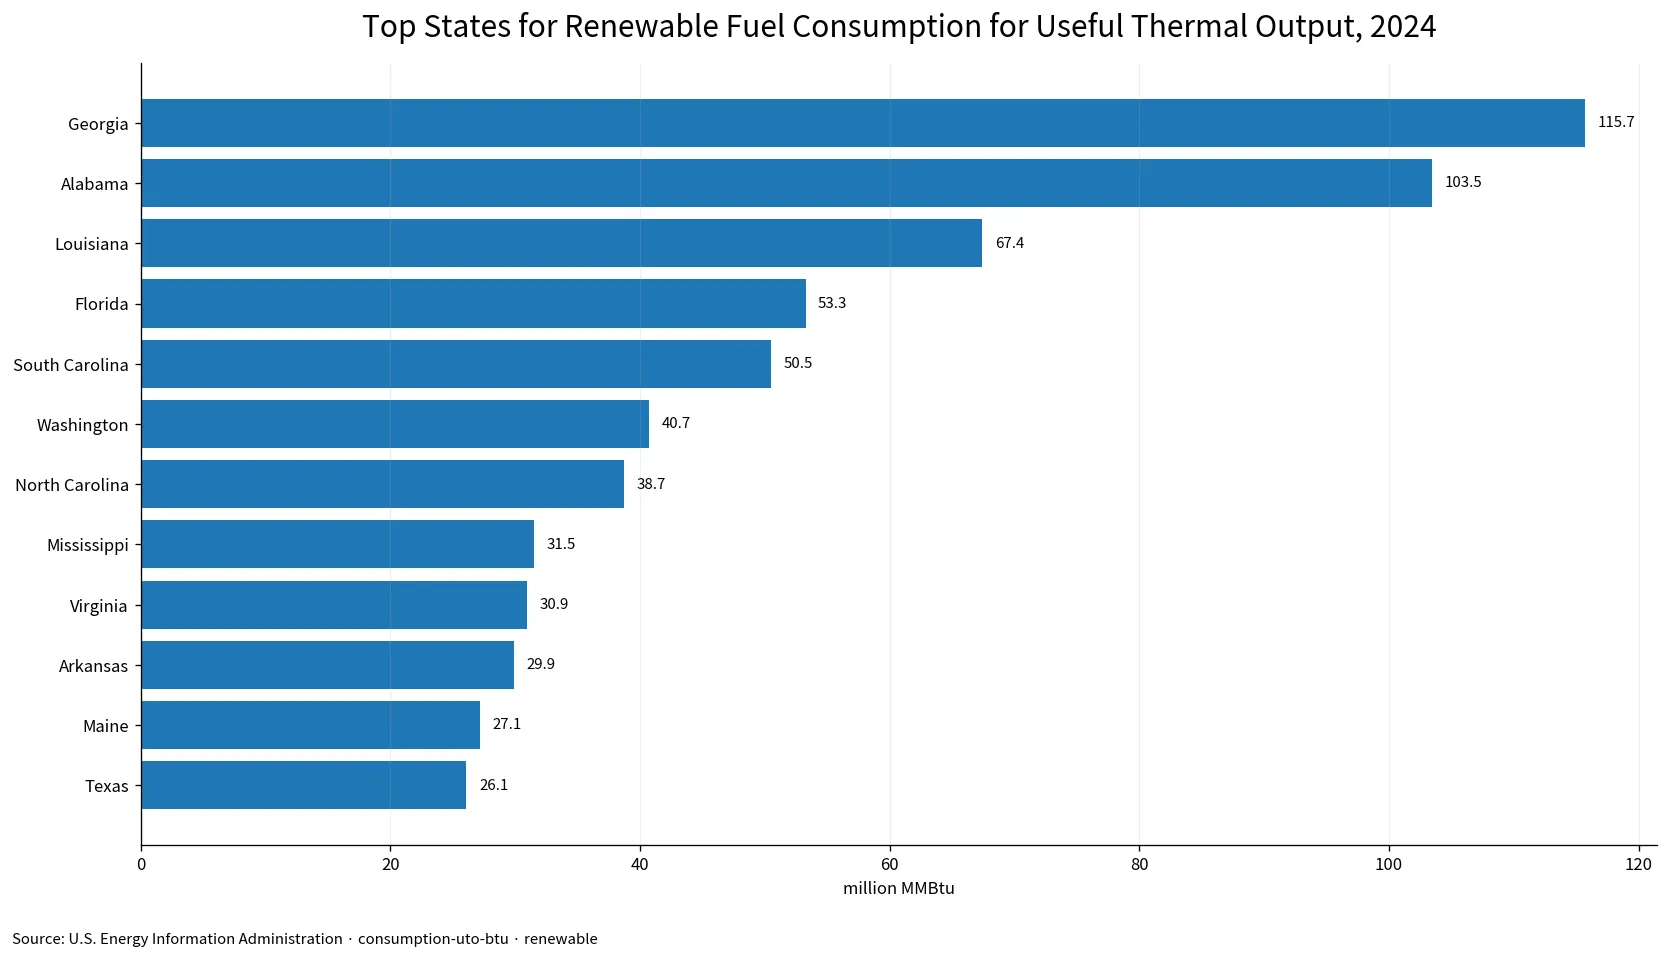
Table of Contents
Georgia and Alabama alone accounted for 27.6% of the total
Georgia represented 14.6% of the 795.08 million MMBtu total and Alabama another 13.0%. Together they accounted for 27.6%. Adding Louisiana, Florida, and South Carolina raises the top-five share to 49.1%. The top ten states together accounted for 70.7%. In other words, only ten of the 51 geographic observations represented more than seven-tenths of the reported national state-level sum.
The concentration also explains why the mean and median are so different. The mean was 15.59 million MMBtu, while the median was 2.15. The first quartile was 0.04 and the third quartile 20.84. Most states are therefore far below Georgia and Alabama, and the upper tail extends well beyond the range that contains the middle half of observations. A single national average would hide this strongly skewed shape.
The top group was dominated by several southeastern states
Georgia, Alabama, Louisiana, Florida, South Carolina, North Carolina, Mississippi, Virginia, and Arkansas all appear near the top of the ranking. Washington and Maine provide notable high values outside that southeastern and southern cluster. The geographic pattern is clear in the ranking, but the dataset does not identify which renewable fuels or industrial processes created each state’s total. Explaining the cluster would require more detailed EIA fuel and facility data.
| State | 2024 consumption (million MMBtu) | Share of total |
|---|---|---|
| Georgia | 115.71 | 14.6% |
| Alabama | 103.46 | 13.0% |
| Louisiana | 67.43 | 8.5% |
| Florida | 53.26 | 6.7% |
| South Carolina | 50.47 | 6.3% |
| Washington | 40.72 | 5.1% |
| North Carolina | 38.74 | 4.9% |
| Mississippi | 31.54 | 4.0% |
| Virginia | 30.95 | 3.9% |
| Arkansas | 29.90 | 3.8% |
| Maine | 27.14 | 3.4% |
| Texas | 26.10 | 3.3% |
The gaps between ranks are substantial. Georgia and Alabama both exceed 100 million MMBtu, but Louisiana falls to 67.43. Florida and South Carolina remain just above 50, while Washington is at 40.72 and North Carolina at 38.74. By Arkansas, the value is below 30. This stepped pattern means rank alone is not enough; grouping the values by scale better conveys how quickly consumption declines after the first two states.
Eleven states had an official zero value
Exactly 11 states are recorded as 0.00000 in the verified 2024 data: Alaska, Arizona, Connecticut, Hawaii, Kansas, Nevada, New Mexico, Rhode Island, Utah, West Virginia, and Wyoming. These are reported numerical zeros, not missing observations. Treating them as no-data entries would alter the distribution and would incorrectly change the meaning of the EIA series.
If values below 1 million MMBtu are included, 23 states or districts fall into that very low range. At the other end, only 14 observations reach at least 20 million MMBtu, and only 5 reach 50 million MMBtu or more. The contrast between these counts is another way to see how concentrated the series is.
Useful thermal output is narrower than total renewable consumption
The central distinction in this dataset is the activity being measured. It covers renewable fuels consumed for useful thermal output. It does not automatically include all renewable fuel used to generate electricity, and it is not the combined electricity-plus-useful-thermal-output series. A state may rank differently when the measure changes because the underlying activities, facilities, and fuel uses are different.
The unit also matters. Million MMBtu measures energy input by heat content. It is not the same as megawatthours of electricity output. Converting between fuel input and electric or thermal output would require information about conversion efficiency and technology. The present comparison therefore stays with the published heat-content consumption values rather than attempting to infer output that the dataset does not provide.
The top-five and top-ten shares change how the total should be read
The national state-level sum of 795.08 million MMBtu might sound like a broadly distributed quantity, but the concentration statistics show otherwise. The top five states account for 49.1% and the top ten for 70.7%. The remaining 41 observations share only about 29.3% of the total. That distribution makes state-level composition much more informative than the sum alone.
The median of 2.15 million MMBtu reinforces the same point. A typical middle-ranked observation is far below the mean of 15.59 because the largest values pull the average up. For skewed energy data, reporting the mean without the median can give the impression that many states are near the average even when most are not.
A 2024 snapshot cannot establish an upward or downward trend
Every observation in the file is from 2024. That makes the cross-state comparison consistent, but it does not show whether Georgia increased from 2023 or whether Alabama has been declining over a longer period. Trend analysis would require the same EIA field, fuel facet, sector facet, unit, and geography for multiple years. Mixing a nearby but different EIA series would create an invalid growth comparison.
The strength of a one-year snapshot is different. It can show the 2024 ranking, the spread between high and low values, the number of official zeros, the median, and the degree of concentration. In this case, those statistics clearly show a distribution with a small high-consuming group and many states at low levels.
The dataset does not identify why Georgia or Alabama were high
It would be tempting to attribute the leading values to a particular industry or renewable fuel, but those explanatory dimensions are not present in the four-column dataset. The file contains state code, state name, year, and value. A causal explanation would need additional EIA data on fuel type detail, plants, sectors, or processes and possibly other official sources.
The same limitation applies to zero-valued states. A zero in this series does not mean that the state had no renewable energy activity. It only means that the specific renewable-fuel consumption measure for useful thermal output is zero in this EIA slice. Renewable electricity generation or other renewable uses can exist in a state with a zero here.
The District of Columbia is included in the 51 observations
Although the article describes a state-level comparison, the source coverage is 50 states plus the District of Columbia. D.C. is reported at 0.34151 million MMBtu. Calculations of the total, average, median, and shares in this article therefore use all 51 rows, matching the verified source coverage.
The representative graphic uses a bar chart rather than forcing a state boundary map. It is created directly from the verified top values, so every plotted bar corresponds to an observed number in the source file. That avoids introducing boundary-join errors when a map is not necessary to answer the main question about scale and concentration.
The 2024 distribution can be summarized by three numbers
Three concentration measures capture much of the pattern: the top two states accounted for 27.6%, the top five for 49.1%, and the top ten for 70.7%. These figures show that concentration remains strong even after the two leaders are separated from the rest. The ranking is not simply one extreme outlier followed by an even distribution; the next several states also contribute substantial shares.
At the same time, 11 states have zero and 23 observations are below 1 million MMBtu. The combination of a long low-value group and a short high-value group is why the median stays near 2.15 while the mean is above 15. This is the defining statistical feature of the 2024 state comparison.
Summary: renewable fuel use for useful heat was concentrated in a small group of states
In 2024, the 51 state and district observations summed to 795.08 million MMBtu. Georgia led at 115.71, Alabama followed at 103.46, and Louisiana ranked third at 67.43. The top five states accounted for 49.1% of the total and the top ten for 70.7%. The median was 2.15 million MMBtu, much lower than the 15.59 mean, and eleven states had official zero values.
The most important interpretation rule is to keep the metric narrow: renewable fuel consumption for useful thermal output, measured in million MMBtu. It should not be substituted for renewable generation, capacity, or combined electricity-and-heat consumption. Within that scope, the 2024 EIA data show a distinctly concentrated state pattern rather than a broadly even distribution.
Frequently Asked Questions
Which state had the highest renewable fuel consumption for useful thermal output in 2024?
Georgia led at 115.71 million MMBtu, followed by Alabama at 103.46 and Louisiana at 67.43.
How concentrated was the 2024 state distribution?
The top five states accounted for 49.1% of the total and the top ten for 70.7%.
Do zero values mean the data are missing?
No. Eleven states have official numerical zero observations in this EIA series, which are distinct from missing data.
Related Articles
Green Map creates custom-edited map images using open geographic data sources such as geoBoundaries, Natural Earth, OpenStreetMap, and government open data. These maps are edited visual materials, not raw data files, and are provided for education, documents, presentations, and graphic reference.