Applied tariff rates differ sharply across reporting countries and economies in 2022. In the World Bank series TM.TAX.MRCH.SM.AR.ZS, The Bahamas has the highest reported simple mean at 26.31%, followed by Bermuda at 22.29%, Equatorial Guinea at 19.97%, and the Central African Republic at 19.34%. At the low end, Hong Kong SAR, China and Macao SAR, China both report 0%, while Singapore records 0.05%. Across the 143 observations with values, the median is 5.36% and the mean is about 7.06%.
The key phrase is “simple mean.” Each tariff line receives equal weight, so the calculation does not give more influence to products with larger import values. The series also concerns applied tariffs rather than being a pure statutory MFN measure. It is therefore best used to compare the broad level of tariff schedules, not as a direct measure of tariff revenue, consumer prices, trade openness, or the rate paid on a particular shipment. Seventy-four of the 217 World Bank country-and-economy entries have no 2022 value and remain missing rather than being treated as zero.
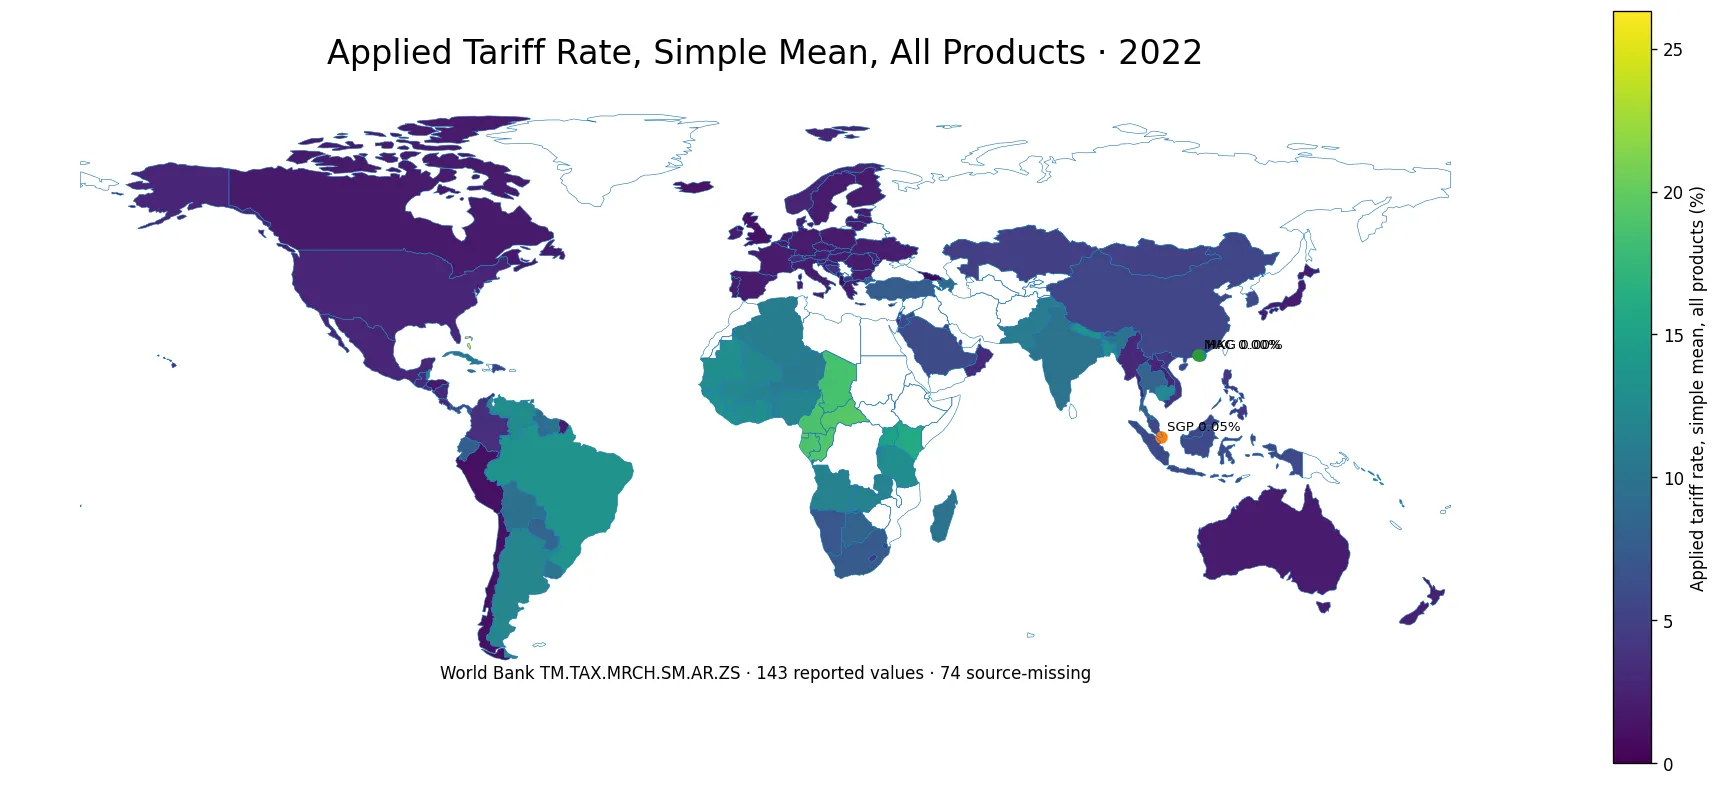
Table of Contents
The upper tail reaches well above 15 percent
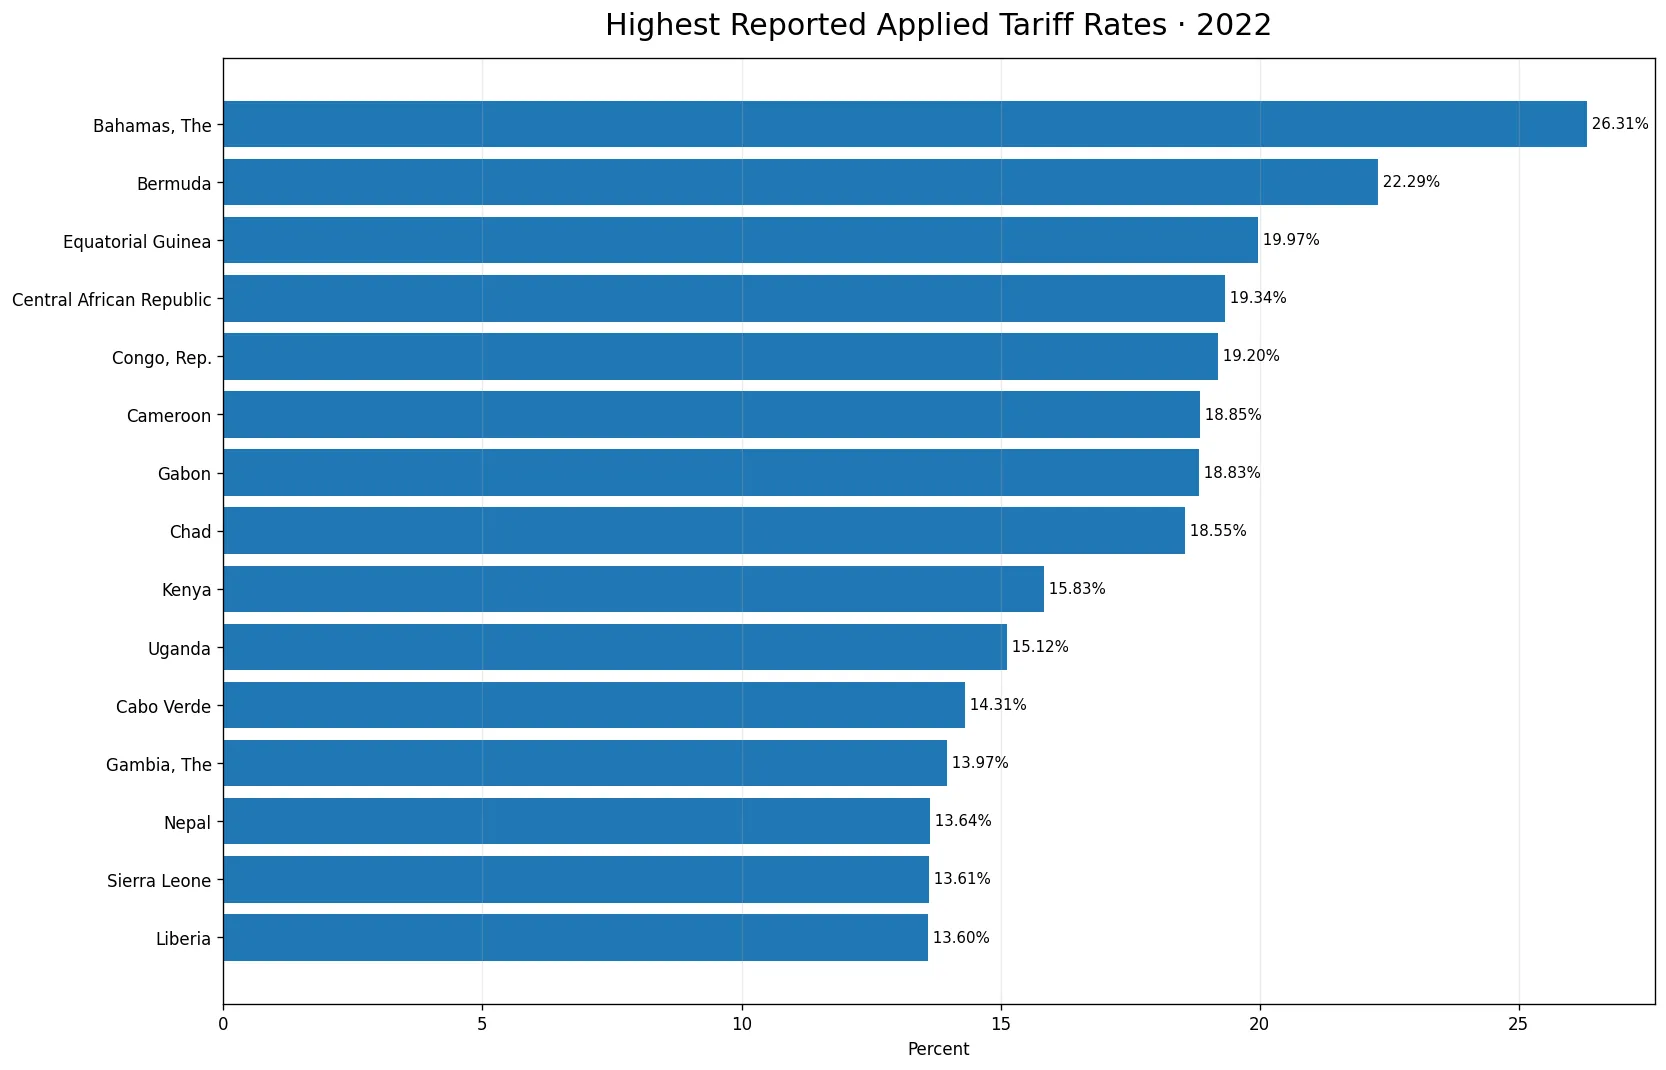
The Bahamas records the highest 2022 value at 26.31%, followed by Bermuda at 22.29%. Equatorial Guinea is at 19.97%, the Central African Republic at 19.34%, the Republic of the Congo at 19.20%, Cameroon at 18.85%, Gabon at 18.83%, and Chad at 18.55%. Kenya and Uganda are also above 15%. These figures show a substantial upper tail, but they should not be read as the average tariff paid on every imported shipment. A simple mean gives the same weight to each tariff line regardless of how much of that product is imported.
Ten reporting economies are at or above 15%, while 47 are at or above 10%. The high-rate group is therefore broader than one or two exceptional observations, yet it remains a minority of the 143 reported values. The economies near the top also differ greatly in market size and trade structure. Their position in this comparison is a statement about the average of tariff lines, not about the size of imports, tariff revenue, or the dollar value of trade exposed to those rates.
The median of 5.36% is more representative than the maximum
The median across the 143 reported observations is 5.36%, while the arithmetic mean is about 7.06%. The higher mean reflects the influence of the observations in the mid-teens and above. The first quartile is 1.95% and the third quartile is 11.73%, placing the middle half of reporting economies inside a fairly wide interval. Looking only at the mean would hide how dispersed the national and territorial values are.
Seventy-three reported economies are at or above 5%, and 70 are below 5%. Forty-two are below 2%, including six below 1%. That spread is one of the main messages of the series: tariff schedules summarized by this method differ sharply across reporting economies. The indicator does not identify the policy, sectoral, or institutional reasons behind those differences, so explanations require additional evidence rather than inference from rank alone.
Reported zeros are different from missing observations
Hong Kong SAR, China and Macao SAR, China both have a reported value of exactly 0% in 2022. Singapore is at 0.05%, Brunei Darussalam at 0.18%, Georgia at 0.40%, and Albania at 0.57%. These are genuine numeric observations in the World Bank series. By contrast, 74 countries and economies have no 2022 observation and remain missing. Treating those missing entries as zero would materially distort the lower end of the distribution.
A low simple mean also does not imply that every product enters duty free. Tariff lines can vary widely within an economy. A schedule may contain some higher rates and many zero or low rates, producing a small average. The reverse can occur when a limited set of high tariff lines raises the unweighted mean. Product-level data are needed to understand the pattern hidden behind the single national value.
The top 15 chart shows how broad the high-rate group is
Beyond the first ten observations, Cabo Verde records 14.31%, The Gambia 13.97%, Nepal 13.64%, Sierra Leone 13.61%, and Liberia 13.60%. The top 15 therefore span more than twelve percentage points, from 13.60% to 26.31%. This variation within the upper group is another reason to avoid treating “high tariff economies” as one uniform category.
The ranking is also not a measure of protection weighted by actual trade. A tariff line for a product that is barely imported counts just as much as a line for a product with very large import flows. If the objective is to estimate the tariff exposure embedded in current imports, a trade-weighted tariff measure is more appropriate. The simple mean is useful for describing the schedule, but it intentionally ignores import weights.
Simple means and trade-weighted means answer different questions
A simple mean asks what the average tariff rate is when each tariff line receives equal weight. A trade-weighted mean asks what the average looks like after giving more weight to products that account for larger import values. The two measures can diverge substantially. High tariffs on products with little trade can raise the simple mean while having little effect on a trade-weighted measure. Conversely, a moderate tariff on a very large import category can matter much more in a trade-weighted calculation.
This distinction matters for cross-country comparisons. Two economies can both report a 7% simple mean while exposing actual import flows to very different tariff structures. Businesses evaluating a specific export market should therefore move from the national summary to the relevant HS product code, any preferential agreement, and the rules of origin that determine eligibility. The national average is a screening indicator, not a quotation for an individual transaction.
Applied tariffs are not identical to MFN tariffs
The World Bank description of this series uses effectively applied tariff rates when available. When an effectively applied rate is unavailable, the most-favored-nation rate may be used instead. That makes this indicator conceptually different from a series that is explicitly limited to statutory MFN rates. It is also broader than a manufactured-products tariff indicator because “all products” covers the full set of included traded goods.
That distinction is important when comparing this article with other tariff measures. A 2022 MFN simple mean for manufactured products may resemble the value here for some economies, but similarity does not make the indicators interchangeable. The tariff concept, product scope, and fallback rules differ. Trade analysis is more reliable when those dimensions are kept explicit rather than reduced to a generic “average tariff” label.
The 2022 reference year should remain visible in any interpretation
This comparison uses a single common year, 2022. Tariff schedules can change as agreements enter into force, governments revise rates, product classifications are updated, or temporary measures expire. The 2022 values should therefore be treated as a historical cross-section rather than as a guarantee of current tariff conditions in 2026. A current commercial decision requires a more recent official schedule for the specific product and trading relationship.
For trend analysis, a movement in the simple mean is only the starting point. An economy can make large changes in a few strategic product categories while the overall average moves only slightly. Conversely, a broad set of small tariff-line adjustments can shift the mean without indicating a dramatic change in every major import category. Time-series interpretation benefits from combining the summary indicator with more detailed tariff-line evidence.
Seventy-four missing observations limit global coverage
The World Bank country-and-economy master used here contains 217 entries, but only 143 have a 2022 value for this indicator. The remaining 74 are source-missing. A blank area on the map therefore means that no 2022 value is available in this comparison, not that the tariff rate is low. Missingness is especially important when calculating regional or global summaries because replacing missing values with zero would bias the result downward.
The reported mean of 7.06% and median of 5.36% summarize the 143 observations with values. They should not be described as statistics for all 217 entries. The World Bank list also includes separately reported economies and territories, so the count is best described as reporting countries and economies rather than as a count of sovereign states.
Large trading economies do not necessarily have high simple means
China reports 5.36% in 2022, the United States 2.72%, Japan 1.99%, Germany 1.95%, and Brazil 13.29%. Their ordering bears little resemblance to rankings by merchandise trade value or economic size, which is expected because the indicator does not measure market scale. It summarizes the tariff schedule rather than the volume of goods moving through it.
This point is practical for market research. A large market with a relatively low national simple mean can still impose high tariffs on a specific product. A smaller market with a high national simple mean can have low or zero rates for the product a business actually sells. The relevant tariff line, preferential regime, and origin conditions determine the transaction-level rate.
The map is a screening tool, not a comprehensive openness index
The world map makes geographic differences easy to see, but darker shading should not be translated directly into “more closed” trade policy. Tariffs are only one part of the trading environment. Non-tariff measures, logistics costs, customs procedures, taxes, exchange rates, services restrictions, and preferential agreements can all matter. A one-number tariff summary cannot capture those dimensions.
Even within tariff policy, two economies with the same simple mean can have very different distributions across products. One may cluster many lines near the average, while another may combine many zero-rate lines with a smaller set of very high rates. The same national mean can therefore describe different schedules. Product-level analysis is necessary when the distribution of tariff rates matters.
Choose companion indicators according to the question
If the question is about the statutory baseline facing most partners, an MFN measure may be appropriate. If the question is about the tariff exposure of actual imports, a trade-weighted measure is useful. If the question concerns one industry, product-group averages or tariff-line data are more informative. If the goal is to study government revenue, tariff receipts and import values are needed rather than a rate alone.
The 2022 simple mean applied tariff rate is strongest as a broad comparative starting point. It makes the range across reporting economies visible and provides a consistent label for one aspect of trade policy. The next analytical step should be chosen based on the decision being made, with “applied,” “MFN,” “simple mean,” “trade-weighted,” “all products,” and “manufactures” kept distinct.
The main result is the breadth of the distribution
The most useful summary of the 2022 comparison is not a single winner or a single world average. The reported values extend from 0% to 26.31%, the median is 5.36%, only two economies are above 20%, ten are at or above 15%, and 42 are below 2%. These groups reveal a broad range of tariff-schedule averages across the 143 reporting observations.
That range must be read alongside the 74 missing observations and the unweighted calculation method. The indicator tells us how tariff-line rates average within each reporting economy in 2022. It does not directly tell us how much tariff revenue was collected, how much each economy imported, what rate a specific product faced, or how tariffs affected final prices. Keeping those limits visible makes the map and ranking substantially more useful.
Frequently Asked Questions
What does the simple mean applied tariff rate measure?
It averages applied tariff rates across tariff lines with equal weight for each line rather than weighting them by import value.
Is this the tariff rate actually paid on the average import shipment?
No. The simple mean ignores trade volumes, so it can differ from a trade-weighted average and from the tariff on a specific product.
Are the 74 economies without a 2022 value treated as 0%?
No. Missing observations remain no data and are separate from the two genuine reported 0% values.
Is this the same as an MFN tariff on manufactured products?
No. This series covers applied tariffs across all products, while an MFN manufactures series uses a different tariff concept and product scope.
Related Articles
Green Map creates custom-edited map images using open geographic data sources such as geoBoundaries, Natural Earth, OpenStreetMap, and government open data. These maps are edited visual materials, not raw data files, and are provided for education, documents, presentations, and graphic reference.