Kandiyohi County occupies a lake-rich part of west-central Minnesota, with Willmar as the strongest urban reference and smaller communities spread toward Green Lake, the eastern countryside, and the southwest. Spicer and New London sit northeast of Willmar near major lakes, Atwater lies to the east, and Raymond and Prinsburg provide southern and southwestern reference points. Higher terrain is concentrated mostly in the north, while central lake basins and much of the south are lower.
This page uses the supplied county, city, water, and elevation maps to explain those relationships with the actual roads, towns, lakes, streams, and relief shown in the package. Original high-resolution JPG versions are also available together in one ZIP download for printing, classroom projects, presentations, or image editing.
Table of Contents
Willmar and the Highway 12–71 road framework
Willmar is the easiest place to begin on the general county map. Highway 12 crosses the city and continues east through Kandiyohi toward Atwater, while Highway 71 runs north and south through the county’s central corridor. Willmar’s larger mapped urban footprint makes it a practical anchor for locating nearly every other community in Kandiyohi County.
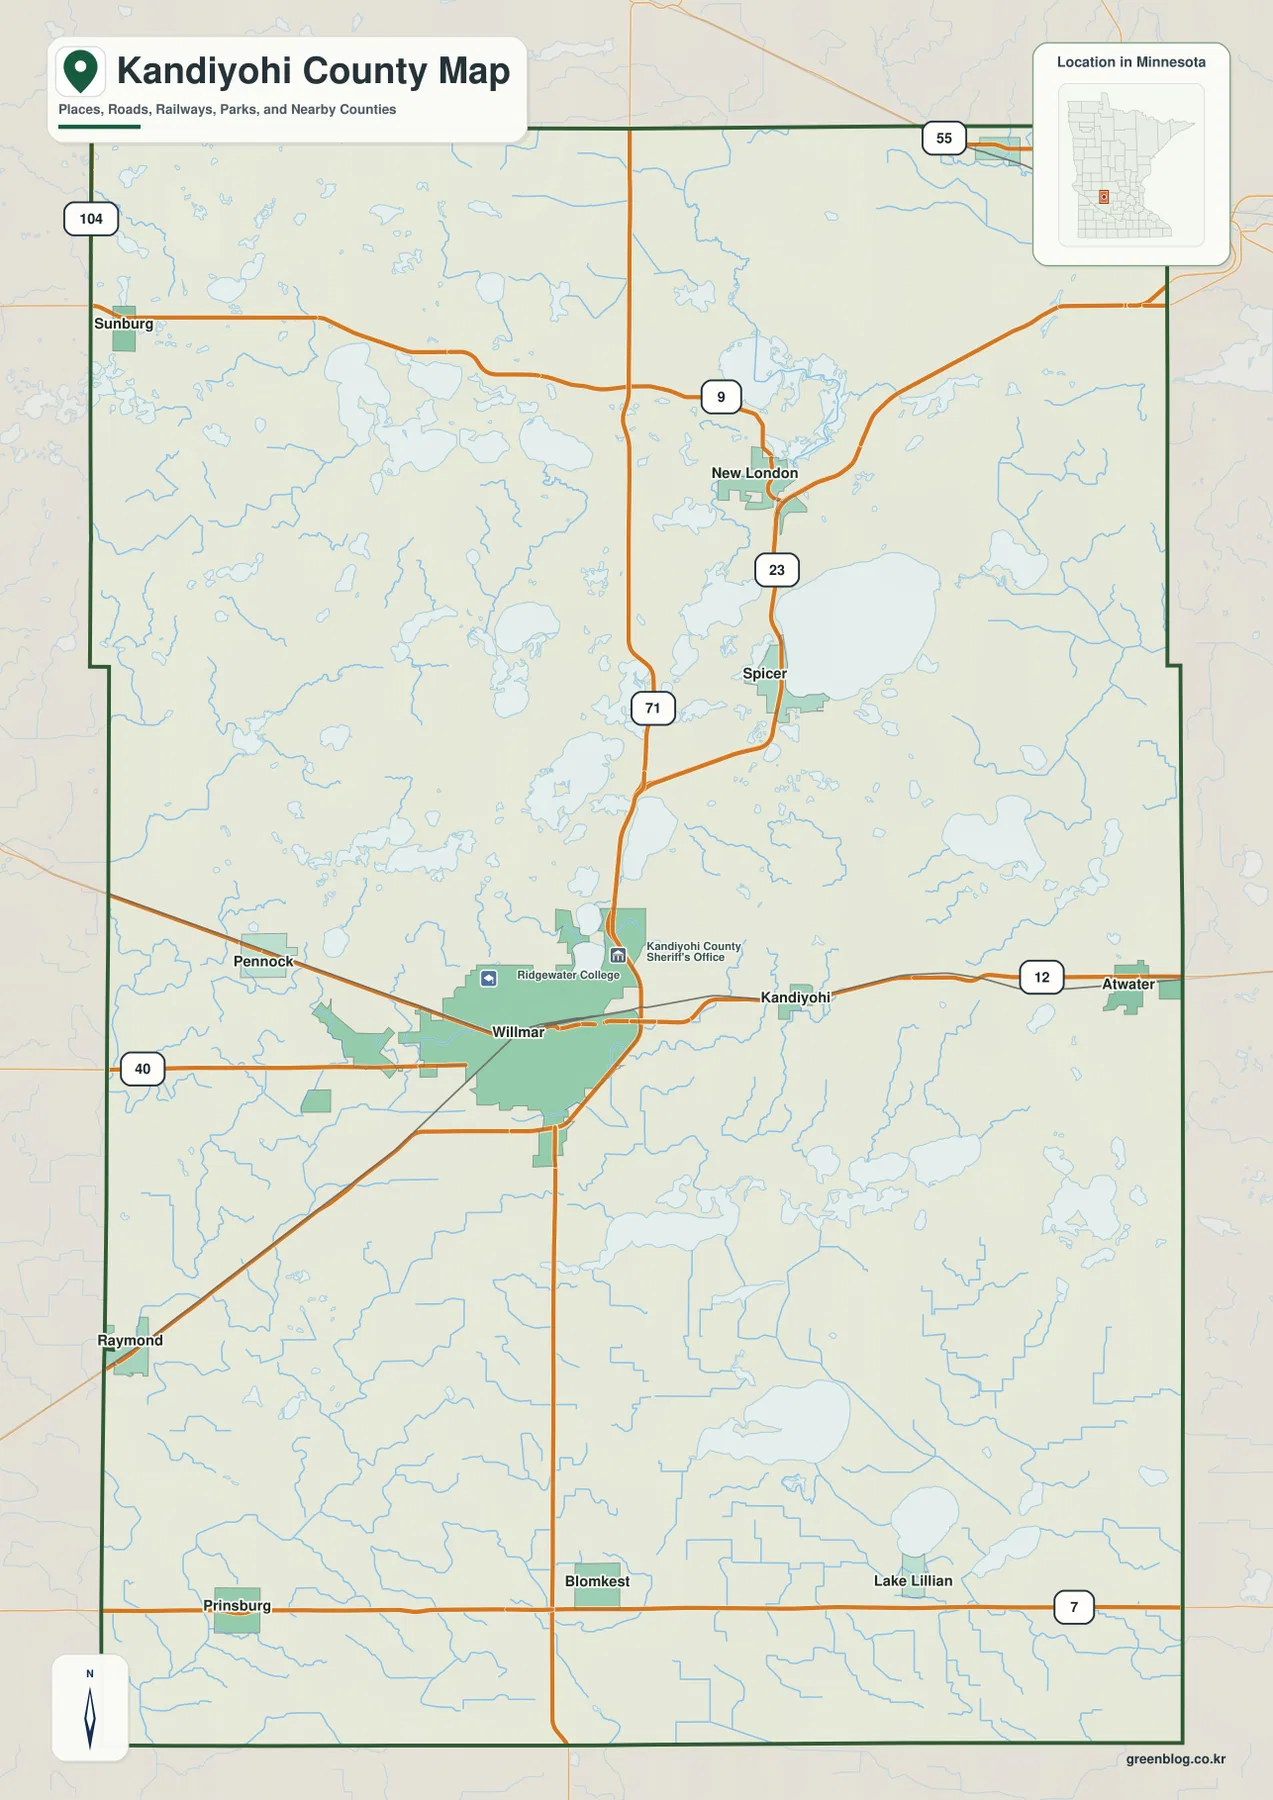
North of Willmar, Highway 71 continues through the middle of the county, while Highway 23 serves the Spicer-New London side near the large lake district. Highway 9 crosses farther north near New London, and Highway 55 appears along the northern edge. The routes frequently curve around lakes and low ground rather than forming a perfectly regular grid.
West of Willmar, Pennock and Raymond provide useful place references, and Highway 40 enters from the west. Highway 7 crosses the southern part of the county near Prinsburg, Blomkest, and Lake Lillian. Sunburg and Highway 104 sit toward the northwest, giving the outer county a road pattern that is much less urban than the Willmar area.
The map also marks the Kandiyohi County Sheriff’s Office and Ridgewater College near Willmar, which makes the city even easier to locate. This is a geographic road overview rather than a traffic service, so current construction, closures, winter conditions, and travel times should be checked with up-to-date transportation tools.
Willmar and five smaller city references across the county
The city map highlights Willmar, Spicer, Atwater, New London, Raymond, and Prinsburg. Willmar occupies the south-central interior, while Spicer and New London sit northeast near the Green Lake district. Atwater is farther east, and Raymond and Prinsburg give the southwest two separate settlement references. The six locations are spread broadly enough that one compact urban cluster does not explain the entire county.
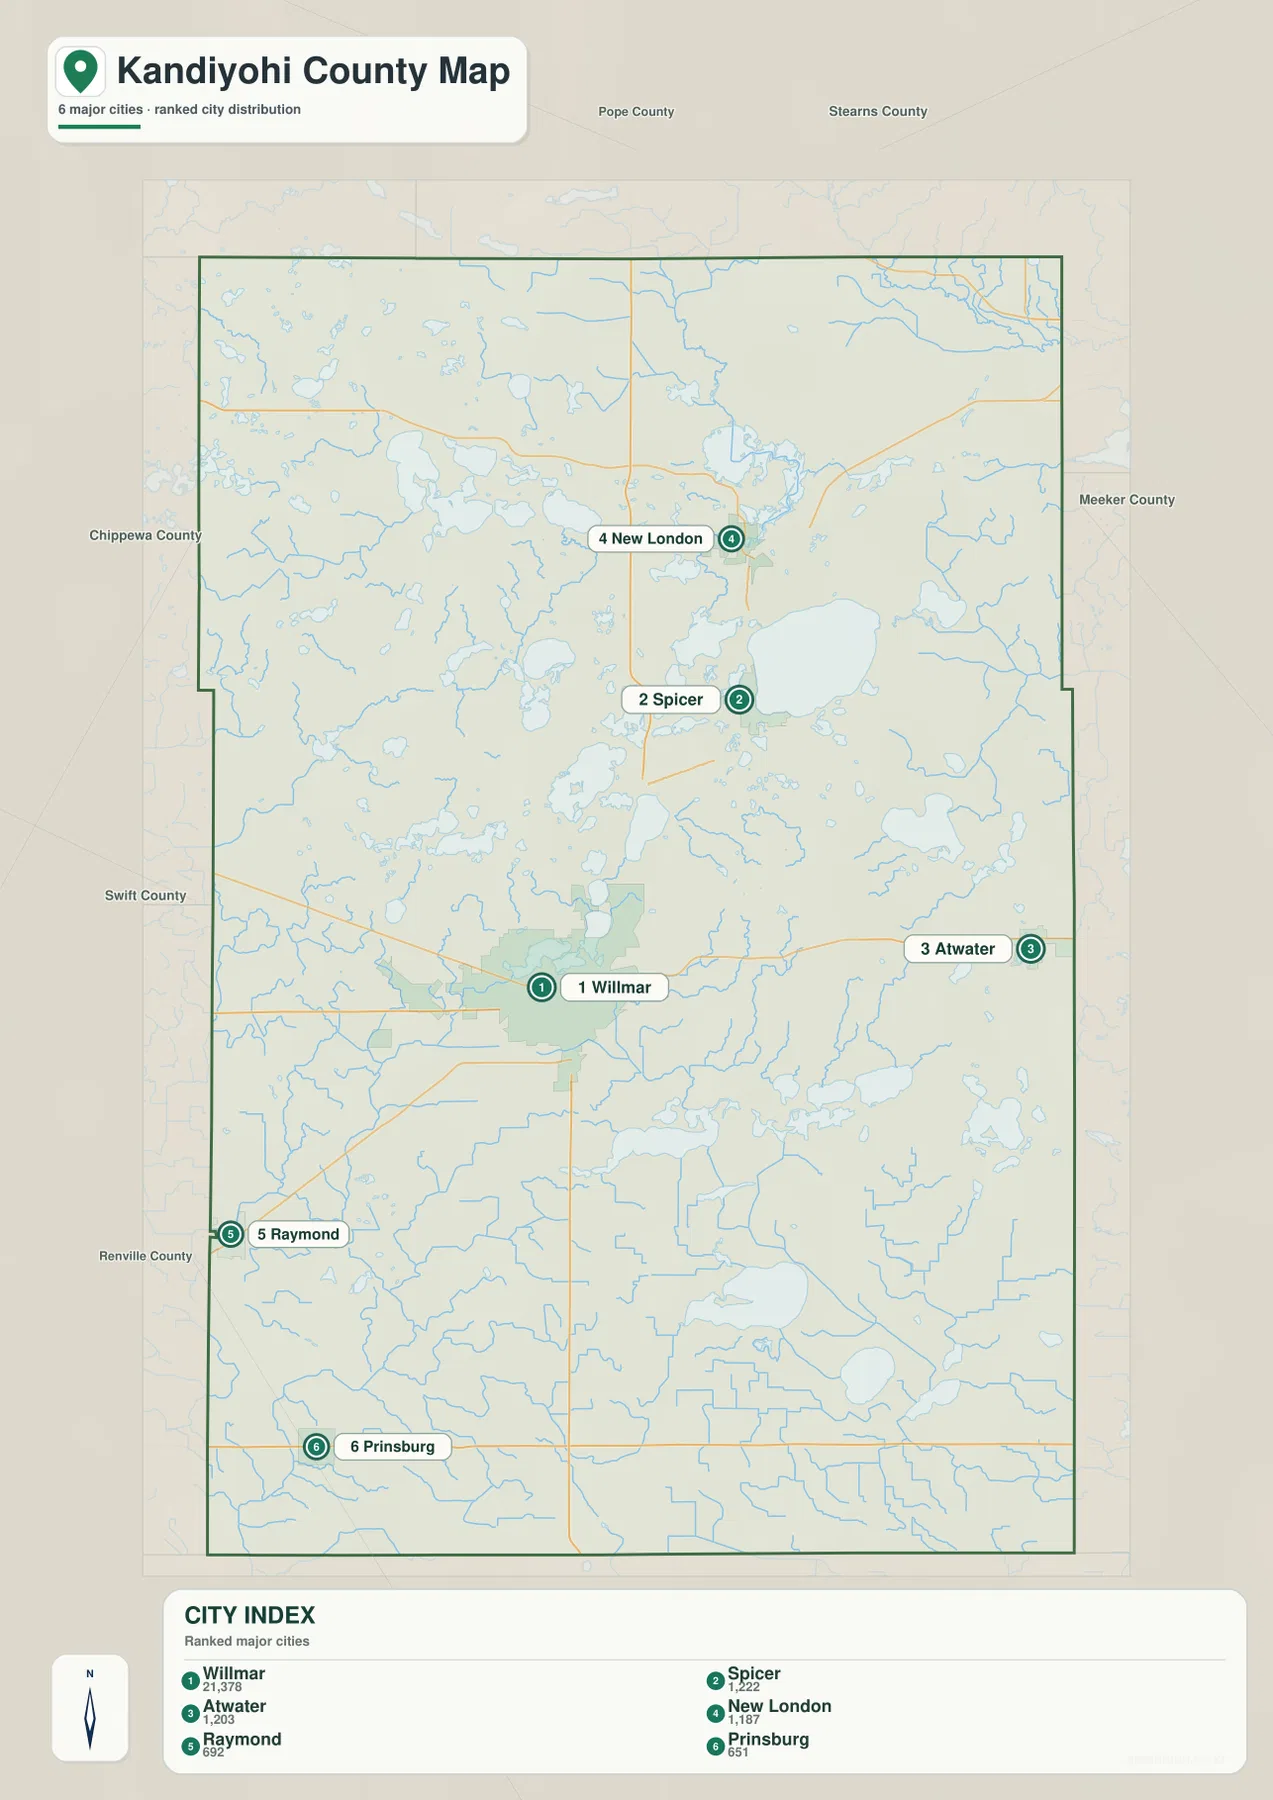
The CITY INDEX printed on the supplied map lists Willmar at 21,378, Spicer at 1,222, Atwater at 1,203, New London at 1,187, Raymond at 692, and Prinsburg at 651. These should be treated as values embedded in the map rather than as claims about the latest official population estimates. Their most useful message is comparative: Willmar is represented as much larger than the other five selected communities.
Spicer, Atwater, and New London have similar index values, but their geography is quite different. Spicer and New London sit among larger lakes and branching waterways, while Atwater lies farther east in a more open rural setting. Raymond and Prinsburg are smaller southwestern communities and provide useful reference points for the lower half of the county.
This city view is not a mileage map. The visual separation between Willmar and Spicer or New London does not account for the exact road route around lakes and intersections. Use it for relative position, then return to the general map or a current navigation service when driving distance matters.
Green Lake and the northern Crow River branches
Green Lake is the most prominent named lake in the northeastern interior. North and northeast of it, Middle Fork Crow River and North Fork Crow River form separate major waterways, while New London sits near a particularly dense mixture of streams and lakes. The water map makes this part of Kandiyohi County look much more complex than the road map alone suggests.
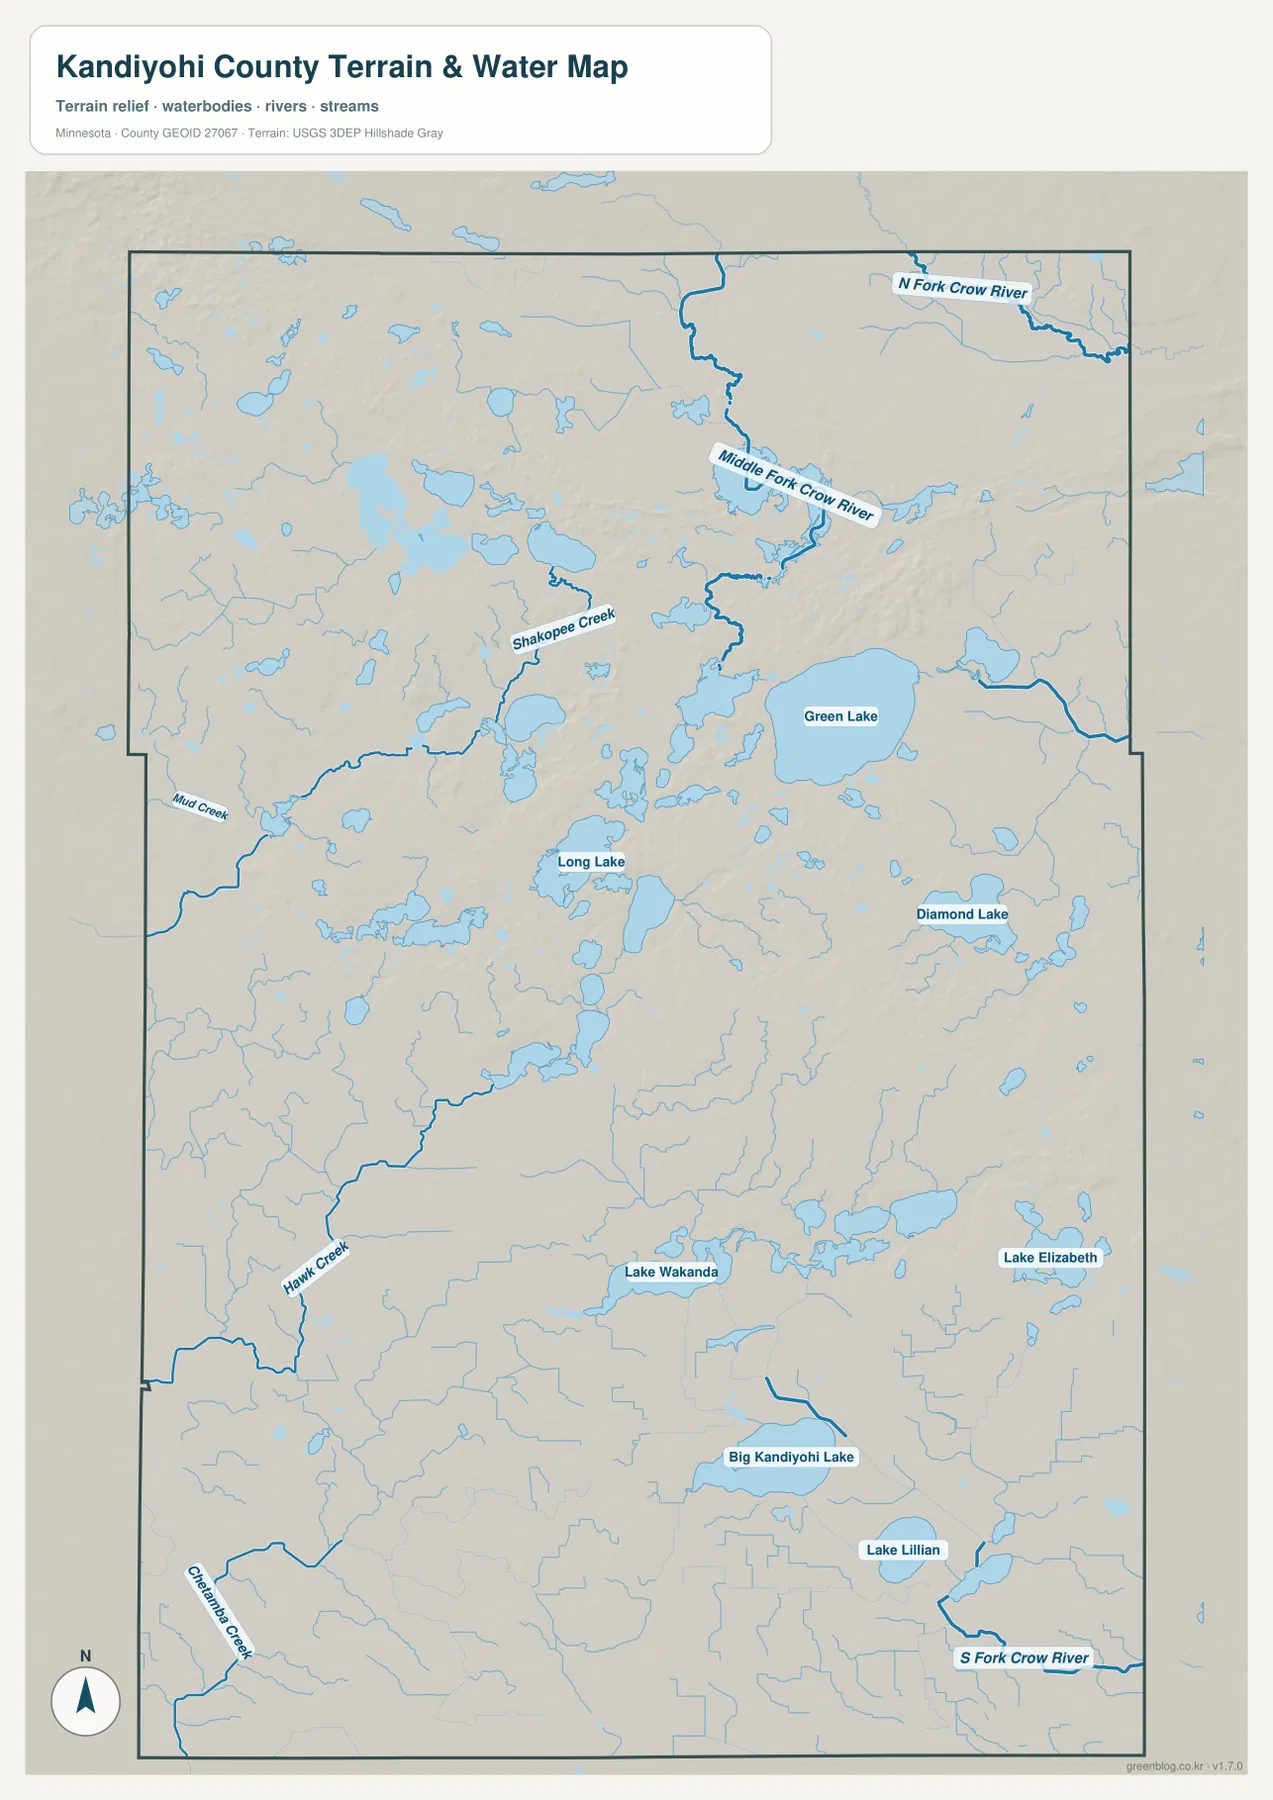
A chain of smaller lakes spreads west and southwest from Green Lake, and Long Lake is labeled closer to the county center. Diamond Lake lies farther east-central with additional small waters around it. Rather than one dominant river valley, the north-central part of the county is shaped by multiple lakes, short channels, and branching streams.
Shakopee Creek crosses the west-central interior, while Mud Creek appears farther west. Their locations help explain why the county’s road network bends around low areas and water features. Comparing the water layer with Highways 9, 23, and 71 shows how transportation routes thread through a landscape where water is rarely far away.
Big Kandiyohi Lake and the southern drainage landscape
The southern half has a different group of important waters. Big Kandiyohi Lake stands out in the southeast-central area, with Lake Lillian farther east. Lake Wakanda appears in the south-central interior, and Lake Elizabeth is labeled farther east. These lakes break up otherwise broad agricultural areas and provide useful landmarks away from the Willmar-Green Lake corridor.
Hawk Creek is a prominent waterway in the southwest, and Chippewa Creek appears near the southwestern boundary. South Fork Crow River leaves the county along the southeastern side. Together with the northern forks of the Crow River, these features show that Kandiyohi County contains several distinct drainage directions rather than one single river system.
The water map is intended for geographic orientation, not flood-hazard, navigation, parcel, or fishing decisions. It does not provide water depth, legal access, shoreline ownership, or current water conditions. County GIS and current state or federal sources should be used when those details matter.
A 323–427 meter range from northern uplands to southern lowlands
The supplied elevation map reports an actual range of about 323 to 427 meters, with a mean near 355 meters. The strongest brown high ground occupies much of the north and northwest, with additional elevated patches toward the northeast and east. Central lake basins and large parts of the south and southwest are greener and lower.
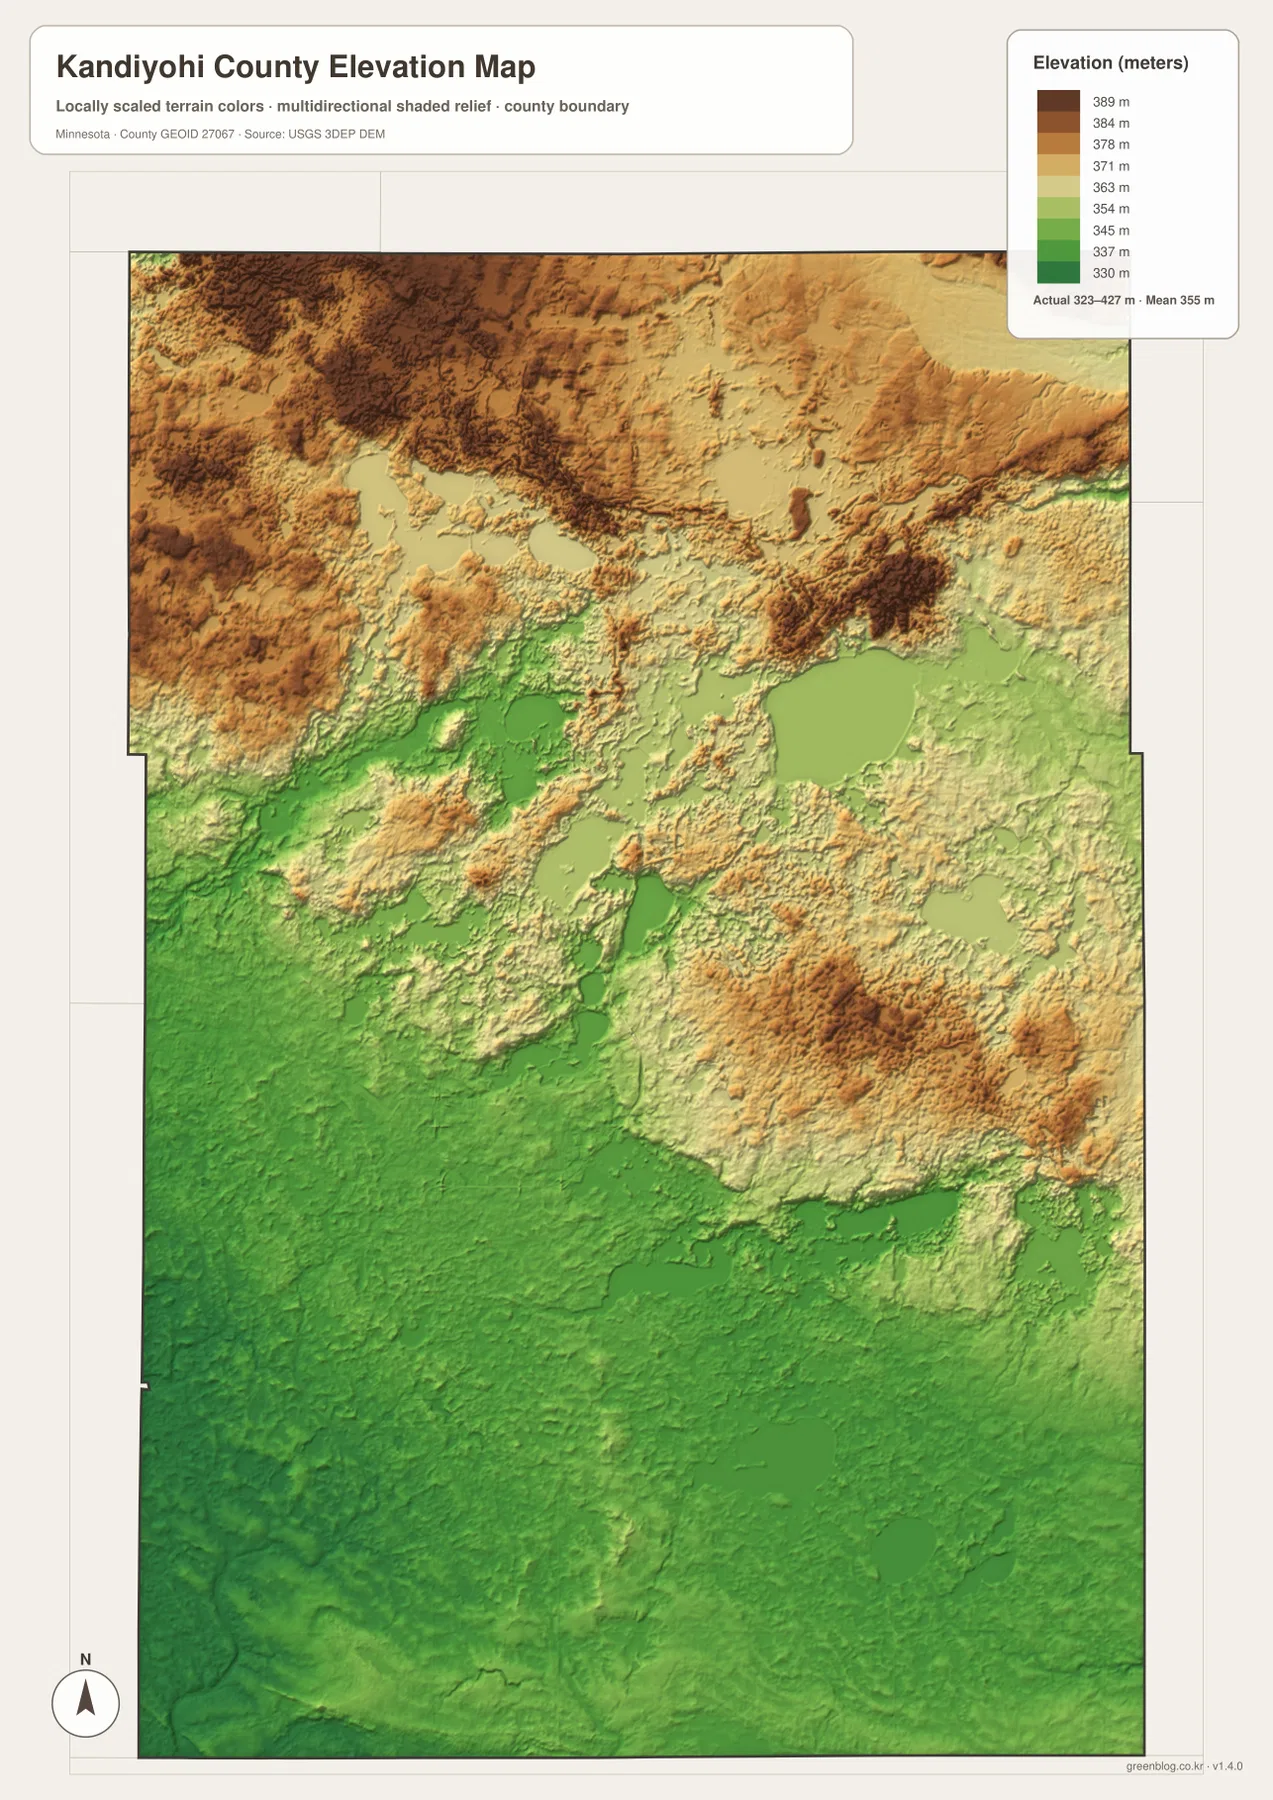
The northwest high area is broad but not flat. Rolling ridges and shallow depressions break up the brown surface, and elevation generally steps downward toward the county center. The northern half remains higher overall, yet lake basins around New London and Green Lake appear as lower green areas enclosed by higher ground.
A particularly useful comparison appears north of Willmar and around Spicer. Long Lake and nearby smaller lakes occupy visibly lower terrain, while Green Lake forms a much larger basin farther northeast. The water and elevation maps align closely here, showing why broad lake surfaces appear within otherwise rolling uplands.
South of Willmar toward Raymond, Prinsburg, Big Kandiyohi Lake, and Lake Lillian, green lower terrain becomes much more widespread. Small hills still interrupt the landscape, but the broad pattern is lower than the northern county. Kandiyohi County is therefore better understood as a transition from higher northern glacial terrain into lower southern agricultural and lake basins rather than as one uniform plain.
This elevation surface is appropriate for county-scale comparison, not surveying or engineering. It should not be used for exact building elevations, road grades, drainage design, or parcel-level contour decisions. Detailed USGS 3D Elevation Program products or professional survey information are the better sources when precision matters.
How the Willmar area changes toward Spicer and New London
Willmar combines the county’s largest city footprint with major road access, but the landscape changes quickly to the northeast. Approaching Spicer and New London, lakes become more numerous, Green Lake dominates the east, and branches of the Crow River add more water corridors. On the elevation view, those lake basins sit below higher terrain around them.
Atwater provides a different eastern comparison. It lies along Highway 12 and is farther from the dense Green Lake cluster, although Diamond Lake and smaller waters remain nearby. Raymond and Prinsburg, by contrast, occupy lower southwestern terrain where broad green areas dominate the elevation map. The selected cities therefore sit in noticeably different physical settings even within one county.
New London is especially useful for connecting roads and natural features. Highways 9 and 23 are nearby, Middle Fork Crow River passes through the broader area, and the surrounding landscape is filled with lakes and rolling uplands. It provides a northern counterpart to the more urban and lower Willmar side of the county.
Choosing between the road, city, water, and elevation views
Use the general county map when Willmar, Spicer, New London, Atwater, Raymond, Prinsburg, and the major numbered roads need to appear together. The city view is cleaner when the goal is to compare the six selected communities and their map index values without all of the road and water detail.
The water map is the stronger choice for Green Lake, the Crow River forks, Big Kandiyohi Lake, Shakopee Creek, Hawk Creek, and other named waters. Pair it with the elevation view when the goal is to show why the north is higher, why central lake basins are lower, and how the landscape changes toward the southern half.
For printing or image editing, the original JPG files in the ZIP provide more resolution than the WebP previews embedded in this article. Each JPG measures 2572 by 3638 pixels, and the archive contains the county, city, water, and elevation maps.
Official Kandiyohi County GIS and federal reference sources
Kandiyohi County’s official website lists its main county offices in Willmar, and the county GIS system provides map services for parcels, municipal boundaries, transportation, drainage, environmental information, and other local datasets. Parcel, tax, permit, legal-boundary, and official road questions should rely on those current county systems rather than on a general-purpose overview map.
U.S. Census Bureau TIGER/Line files are appropriate for boundary, road, and place data; USGS National Hydrography supports river and stream work; and the USGS 3D Elevation Program provides detailed elevation products. The maps on this page are intended to make Kandiyohi County’s settlement, water, and relief relationships easy to understand and reuse.
Frequently Asked Questions
How are Willmar, Spicer, and New London positioned relative to one another?
Willmar is the largest south-central city, while Spicer and New London are northeast in the Green Lake district. Highways 71, 23, and 9 provide useful road references for understanding the transition from Willmar toward the northeastern lake country.
Which major lakes and rivers are labeled in Kandiyohi County?
Green Lake is the largest labeled lake in the northeastern interior, while Big Kandiyohi Lake and Lake Lillian stand out farther south. North, Middle, and South Fork Crow River are shown in different parts of the county, along with Shakopee Creek and Hawk Creek.
Where are the highest and lowest parts of the county?
The supplied elevation map shows a range of about 323–427 meters and a mean near 355 meters. Higher terrain is concentrated mostly in the north and northwest, while central lake basins and much of the south and southwest are lower. Exact site elevations require detailed USGS or survey data.
Map File Information
Download the original high-resolution JPG versions of the Kandiyohi County maps shown on this page in one ZIP file.
- Included Files: county map, city map, water map, elevation map
- Printable Size: each JPG is 2572 × 3638 px
- File Type: ZIP containing 4 JPG files
Related Maps
Sources and references
- Kandiyohi County official website – county government and Willmar office information
- Kandiyohi County GIS – official county GIS and mapping services
- U.S. Census Bureau TIGER/Line Shapefiles – boundary, road, and place data
- USGS National Hydrography – river, stream, and water data
- USGS 3D Elevation Program – elevation data and products
Green Map creates custom-edited map images using open geographic data sources such as geoBoundaries, Natural Earth, OpenStreetMap, and government open data. These maps are edited visual materials, not raw data files, and are provided for education, documents, presentations, and graphic reference.