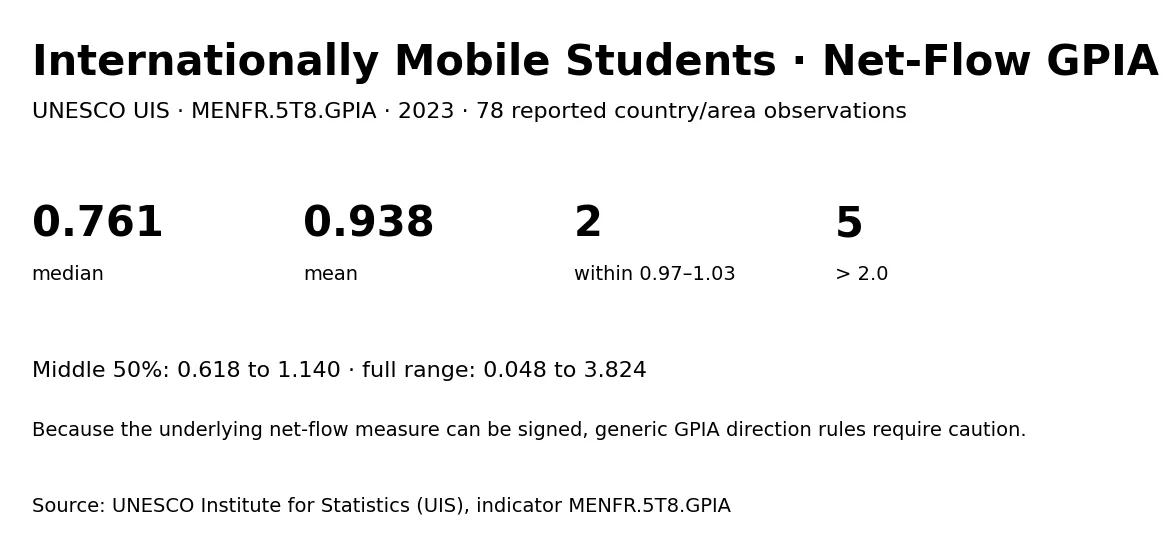
UNESCO Institute for Statistics (UIS) indicator MENFR.5T8.GPIA reports an adjusted gender parity index for the net-flow ratio of internationally mobile students, defined around the inbound-minus-outbound concept. The 2023 data used here contain 78 reported country and area observations. The median is 0.76142 and the mean is 0.93848. Unlike many familiar education GPIA series, the observed values extend from 0.04838 to 3.82418 and include values above 2.
That unusually wide range matters for interpretation. Generic adjusted gender parity indices are normally explained as comparisons centered on 1, often with 0.97–1.03 used as a practical parity band. But the underlying indicator here is a net-flow ratio, not a simple positive enrolment rate. A net-flow measure can change sign when outbound mobility exceeds inbound mobility. When the sex-specific underlying values can be signed, the usual intuition that a GPIA should remain between 0 and 2 can break down.
Table of Contents
The median is 0.76142 and the distribution is unusually broad
Ordering the 78 published values produces a median of 0.76142. The first quartile is 0.61833 and the third quartile is 1.14014, so even the middle half spans about 0.522. The mean of 0.93848 is higher than the median because several large observations sit in the upper tail, led by Chile at 3.82418 and Jordan above 2.3.
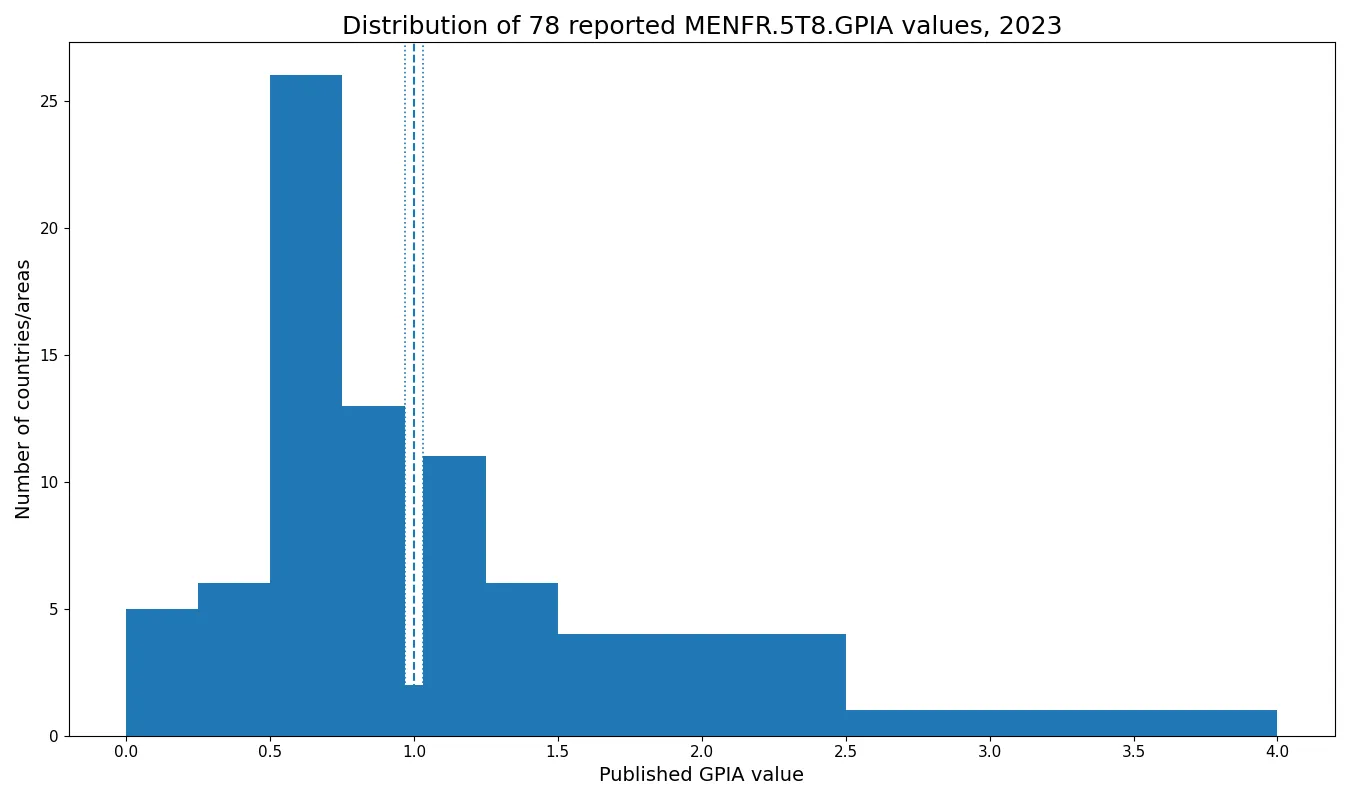
Only 2 observations fall inside the commonly cited 0.97–1.03 band. Another 50 are below 0.97 and 26 are above 1.03, including 5 observations above 2. These counts are useful as a description of the published values, but they should not be converted mechanically into counts of countries where one sex is advantaged. The underlying female and male net-flow ratios are needed for that directional interpretation.
Using simple numeric bands, 11 observations are below 0.5, 40 are from 0.5 to under 1, 18 are from 1 to under 1.5, and 4 are from 1.5 through 2. This banding does not redefine the indicator. It simply shows where the reported values are concentrated and how much of the distribution lies far from the reference value of 1.
Values near 1 need context before they are called parity
Brunei Darussalam is closest to 1 at 1.02038, followed by Spain at 0.97944, Austria at 0.96448, and Cameroon at 1.03597. Numerically, these observations are close to the standard parity reference. Yet the signed nature of the underlying net-flow ratio means that the female and male base values should be checked before drawing a strong substantive conclusion.
| Country or area | 2023 value | Distance from 1 |
|---|---|---|
| Brunei Darussalam | 1.02038 | 0.02038 |
| Spain | 0.97944 | 0.02056 |
| Austria | 0.96448 | 0.03552 |
| Cameroon | 1.03597 | 0.03597 |
| China, Macao Special Administrative Region | 1.07670 | 0.07670 |
| Argentina | 0.91653 | 0.08347 |
| Switzerland | 0.90360 | 0.09640 |
| Slovenia | 0.89574 | 0.10426 |
| Andorra | 1.11111 | 0.11111 |
| Portugal | 0.88238 | 0.11762 |
UIS explains parity indices as comparisons between the indicator values of two groups, with 1 indicating equality between those values. Adjusted GPIA is designed to make distances around 1 easier to compare for ordinary positive education indicators. The present series deserves additional caution because the source itself publishes observations beyond the usual adjusted-GPIA range, signaling that the signed net-flow context affects the numerical behavior.
For that reason, distance from 1 is treated here as a descriptive feature rather than a performance score. International student mobility depends on inbound and outbound flows, the size and structure of tertiary education, destination choices, scholarships, visa rules, degree structures, and many other factors. A single parity-index value cannot isolate those mechanisms.
Chile has the highest published value at 3.82418
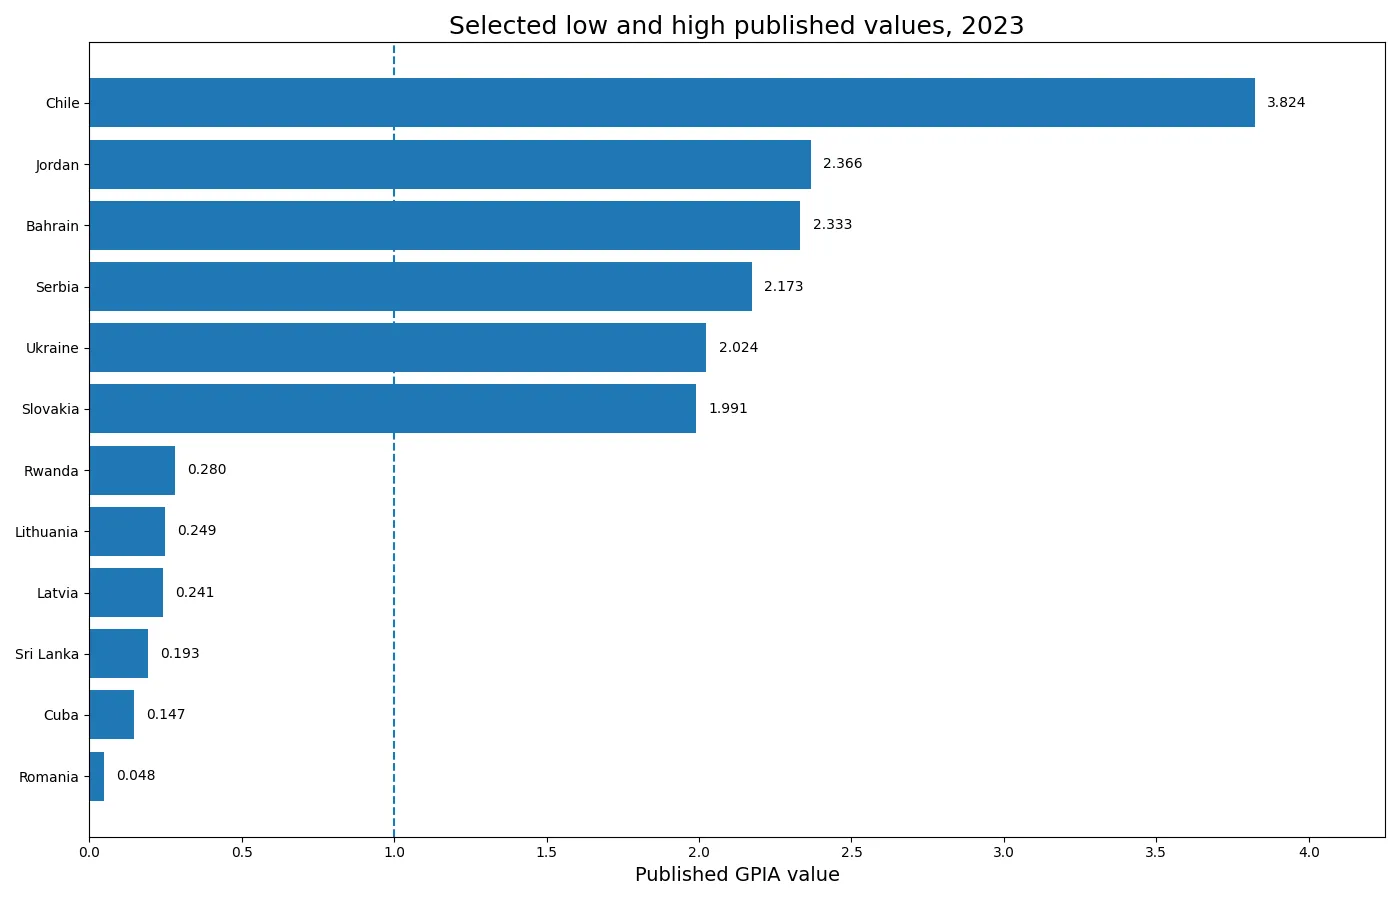
The highest 2023 observation is Chile at 3.82418. Jordan follows at 2.36630, Bahrain at 2.33280, Serbia at 2.17265, Ukraine at 2.02413, and Slovakia at 1.99095. Several values approach or exceed 2, making the upper tail visibly different from a conventional bounded parity-index distribution.
| Country or area | 2023 value |
|---|---|
| Chile | 3.82418 |
| Jordan | 2.36630 |
| Bahrain | 2.33280 |
| Serbia | 2.17265 |
| Ukraine | 2.02413 |
| Slovakia | 1.99095 |
| Croatia | 1.83146 |
| Senegal | 1.68573 |
Chile’s 3.82418 should not be read as saying that women are “3.8 times better” or that female international mobility is 3.8 times male mobility. Adjusted parity values are not simple performance multiples, and a signed underlying net-flow measure can produce unintuitive results. Correct directional interpretation requires the sex-specific net-flow values from which the parity measure was derived.
A high value also does not mean that the country has the largest net inflow of internationally mobile students. The indicator is a gender comparison of a net-flow ratio. Total inbound student numbers, total outbound student numbers, inbound mobility rates, and outbound mobility ratios are separate measures.
Romania has the lowest published value at 0.04838
The lowest observation is Romania at 0.04838. Cuba follows at 0.14745, Sri Lanka at 0.19253, Latvia at 0.24114, Lithuania at 0.24899, and Rwanda at 0.27982. These observations form the lower tail and contribute to the very broad overall range.
| Country or area | 2023 value |
|---|---|
| Romania | 0.04838 |
| Cuba | 0.14745 |
| Sri Lanka | 0.19253 |
| Latvia | 0.24114 |
| Lithuania | 0.24899 |
| Rwanda | 0.27982 |
| Estonia | 0.32079 |
| Burundi | 0.34878 |
A low value should not automatically be translated into a statement that men or women face a particular mobility disadvantage. Because the base measure is inbound minus outbound in ratio form, the sign and magnitude of the female and male values matter. If one sex has a net inflow and the other a net outflow, a simple ratio-based intuition can be especially misleading.
The indicator also should not be confused with the gender composition of total tertiary enrolment. A country can have one pattern in domestic higher education and a different pattern among internationally mobile students. Understanding why requires additional information on origins, destinations, programme levels, scholarships, and migration or visa conditions.
The sorted profile highlights the influence of the upper tail
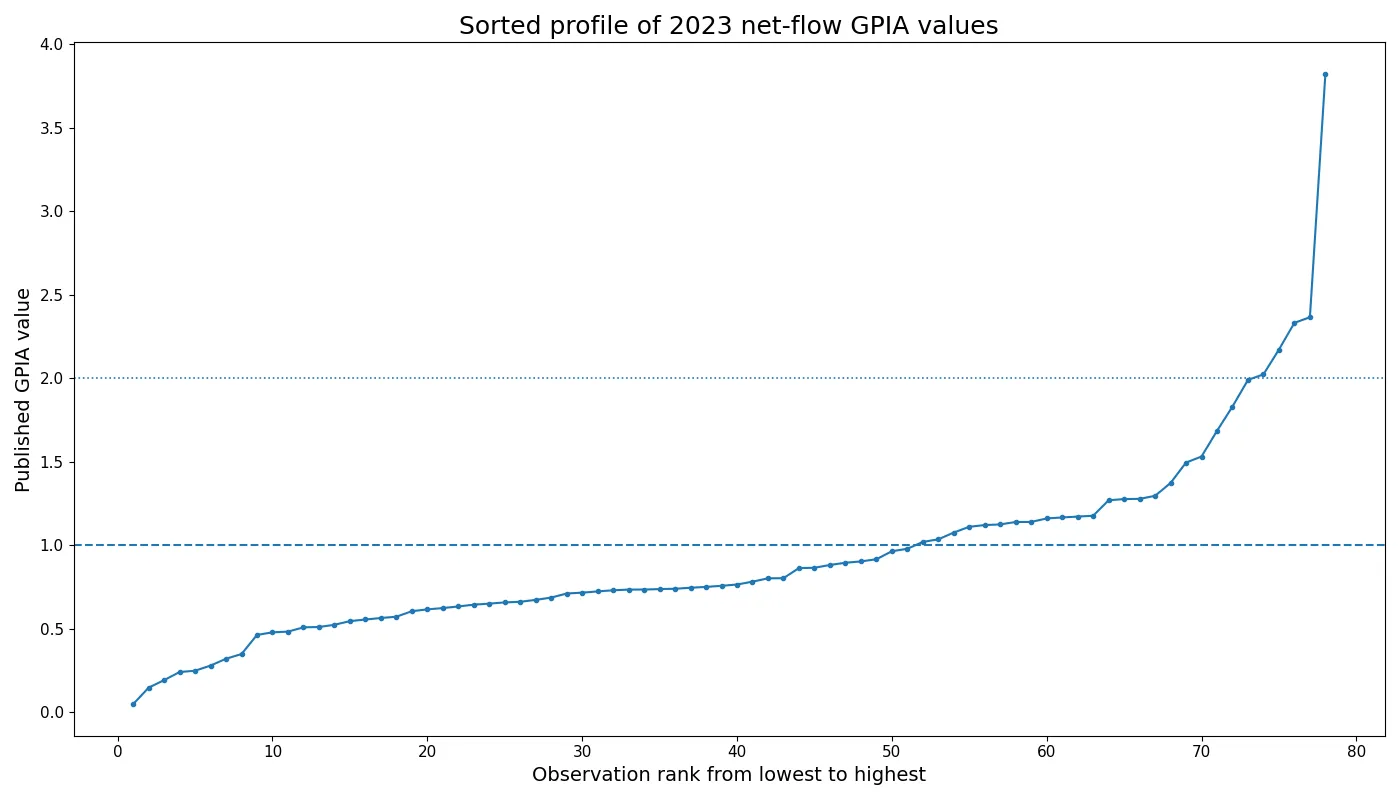
The sorted curve moves gradually through a long central section and then steepens near the upper end. A few values above 2 have a large effect on the mean, which helps explain why the mean of 0.93848 sits above the median of 0.76142. A single average therefore conceals the contrast between the central cluster and the exceptional upper observations.
Ranking also has limited substantive meaning in the dense middle of the distribution. Two countries separated by a few hundredths can occupy different positions without that difference necessarily reflecting a meaningful policy or mobility gap. At the extremes, the numeric separation is obvious, but the cause still cannot be inferred without the underlying sex-specific mobility measures.
Countries without a reported 2023 value are not zeros
All 78 rows in the dataset contain numeric observations, and there are no official zero values. However, many country and territory units in the UIS catalogue do not have a reported 2023 value in this extract. Those units remain unreported. Assigning zero would manufacture extreme observations and distort the median, mean, and ranking.
Coverage also limits statements about global extremes. It is accurate to describe Chile and Romania as the highest and lowest among the 78 reported 2023 observations, not necessarily the highest and lowest across every country and territory in the world.
A one-year cross-section cannot show whether the gender pattern is changing
The comparison is fixed to 2023. It does not establish whether the gender difference in internationally mobile student net flows is widening or narrowing over time. A trend analysis would require several years of the same MENFR.5T8.GPIA series and, ideally, the corresponding female and male base indicators.
A parity value moving closer to 1 does not necessarily mean that international mobility improved for either sex. The two underlying net-flow ratios could both fall, both rise, or move in opposite directions. The index and the base values answer different questions and should be examined together in time-series work.
Source and interpretation
The country values come from the UNESCO UIS Data API series MENFR.5T8.GPIA for 2023. The UIS Data Browser glossary explains the general concept of parity indices, and an official UIS fact sheet describes the adjusted GPIA method used for ordinary positive education indicators.
The safest conclusion is therefore descriptive: the 2023 published values are widely dispersed, only two fall within 0.97–1.03, and several extend beyond 2. Because the underlying net-flow indicator can be signed, the familiar GPIA direction rules should not be applied mechanically. A full gender interpretation requires the female and male net-flow ratios themselves.
Frequently Asked Questions
What does MENFR.5T8.GPIA measure?
It is the UNESCO UIS adjusted gender parity index for the net-flow ratio of internationally mobile students, based on the inbound-minus-outbound concept.
Does a value above 1 automatically mean women have a mobility advantage?
No. The underlying net-flow ratio can be signed, so the female and male base values should be checked before interpreting direction.
Why are some published values above 2?
This series is based on a signed net-flow indicator rather than an ordinary positive rate, so the usual 0–2 intuition for adjusted GPIA should not be applied mechanically.
Should countries without a reported 2023 value be treated as zero?
No. Unreported country and territory units must remain missing rather than being assigned a zero.
Related Articles
Green Map creates custom-edited map images using open geographic data sources such as geoBoundaries, Natural Earth, OpenStreetMap, and government open data. These maps are edited visual materials, not raw data files, and are provided for education, documents, presentations, and graphic reference.