Gender patterns in tertiary student mobility to the Arab States look very different once the comparison is normalized rather than based on raw student counts. The UNESCO Institute for Statistics reports 187 country and territory observations for 2023 under indicator MOGER.5T8.40525.GPIA. The series is an adjusted gender parity index for the mobile outbound gross enrolment ratio of tertiary students studying in the Arab States. A value near 1 means the female and male mobility ratios are similar.
The underlying mobile outbound gross enrolment ratio expresses internationally mobile tertiary enrolment in a host country or region as a percentage of the population in the five-year age group immediately following upper-secondary education. In this indicator, the destination region is the Arab States. GPIA then compares the female and male versions of that ratio. It is therefore not the female percentage of Arab-State-bound students and it is not a general tertiary enrolment rate.
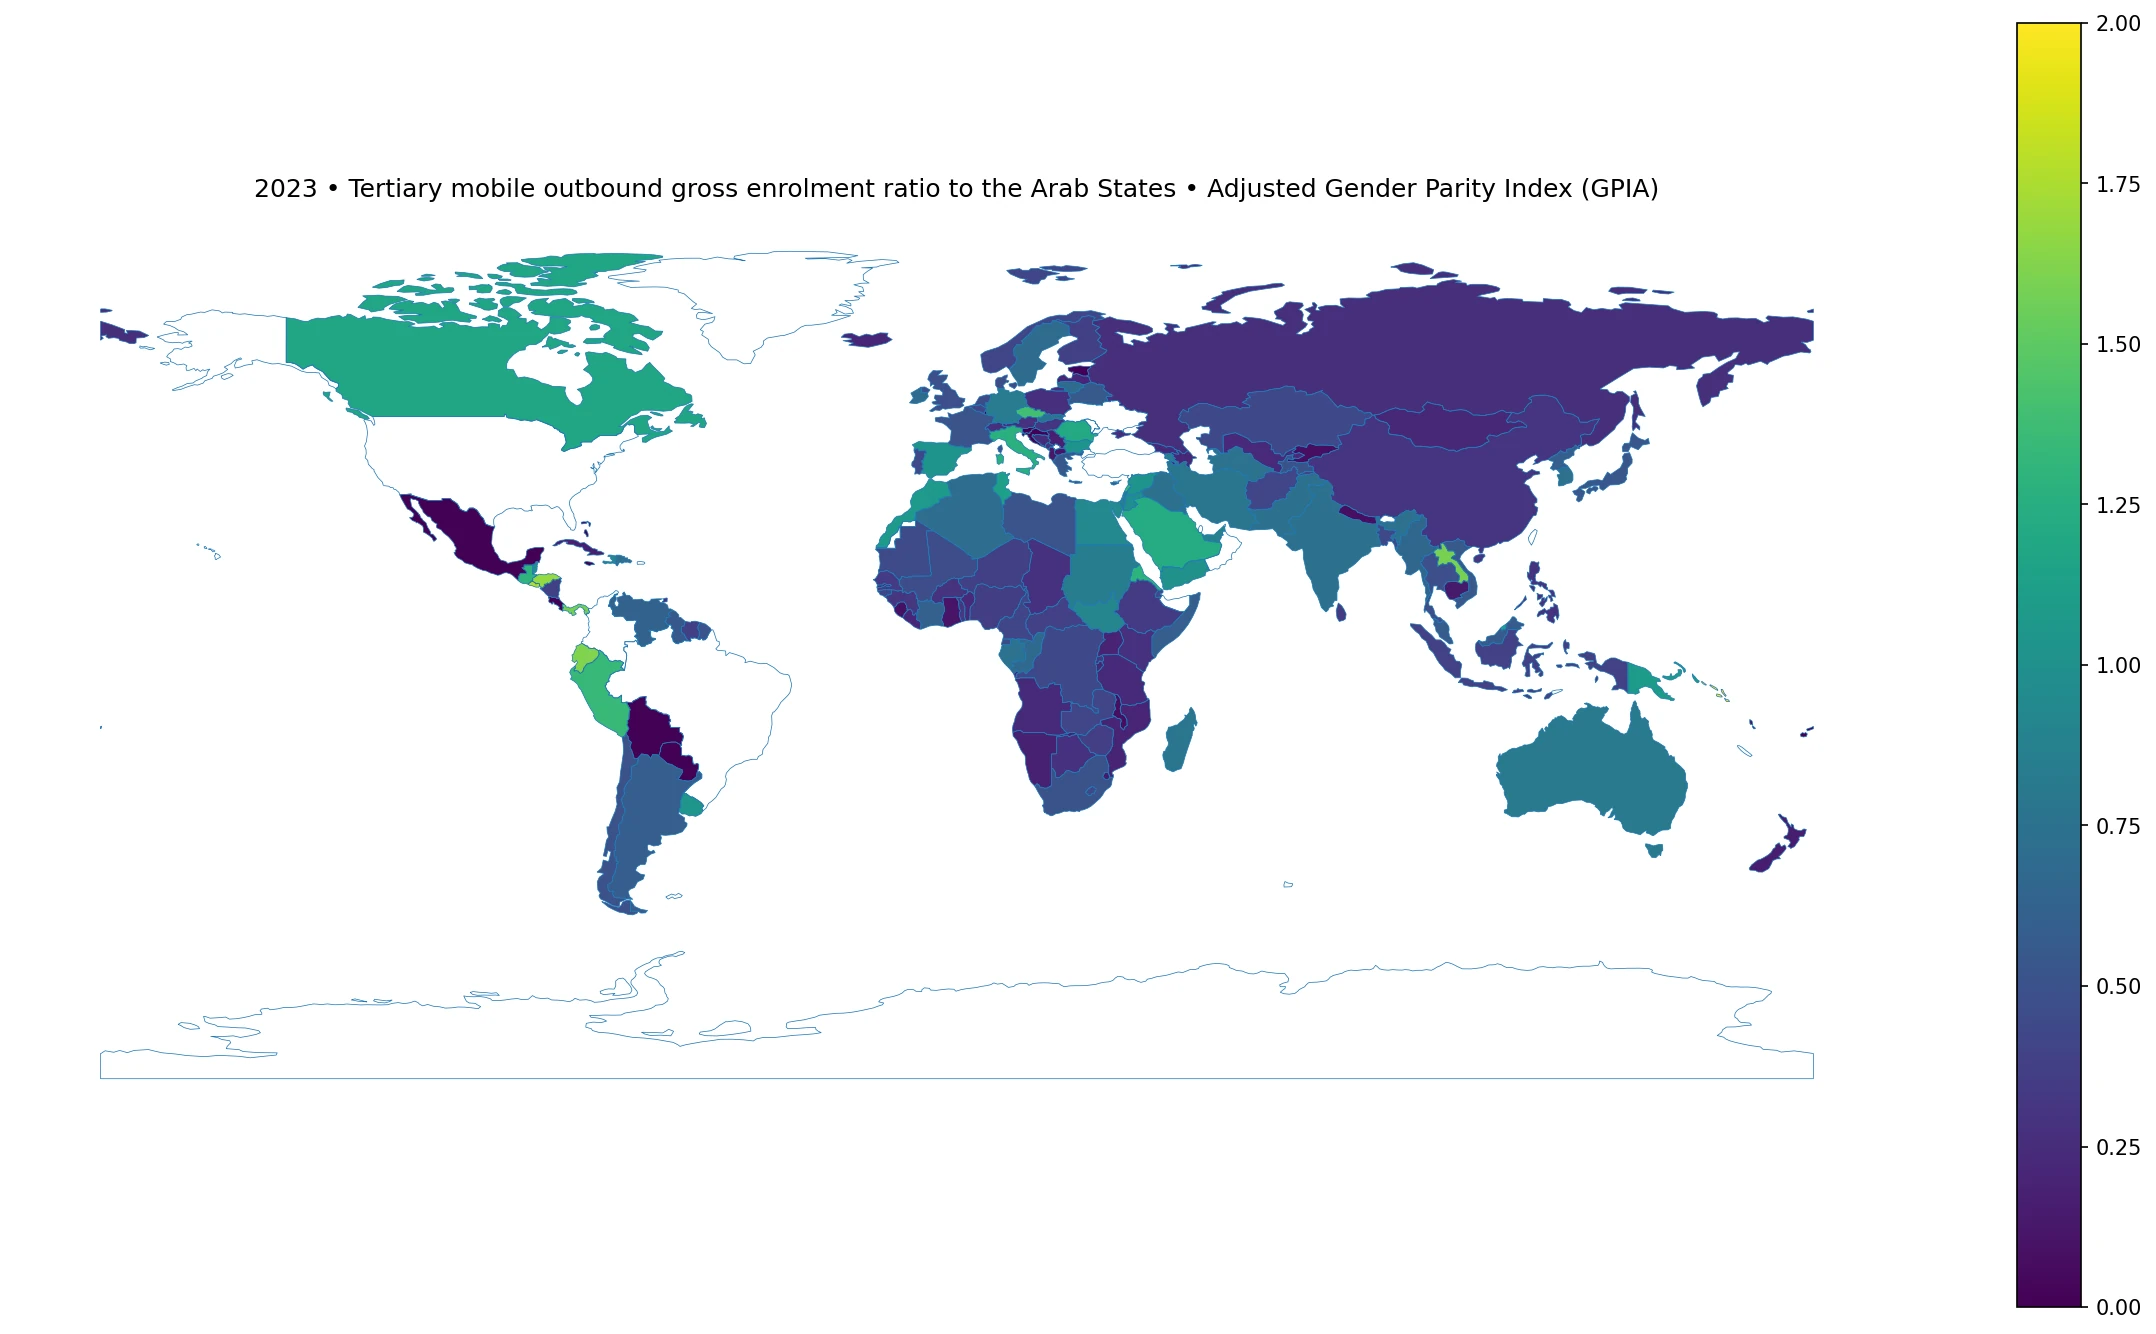
Table of Contents
The adjusted parity index is read around 1
The ordinary gender parity index compares the female value of an indicator with the male value. The adjusted version keeps values at or below 1 as the female-to-male ratio, but when the female value is higher it transforms the ratio by subtracting the male-to-female ratio from 2. The result is bounded between 0 and 2 and is more symmetric around 1. A value of 0.8 and a value of 1.2 are therefore the same distance from parity, although they point in opposite directions.
UNESCO commonly uses 0.97 to 1.03 as the range associated with gender parity. Only four of the 187 observations in this 2023 dataset fall inside that band. Another 149 are below 0.97 and 34 are above 1.03. Because the underlying indicator is a destination-specific mobility ratio, however, values below or above 1 should not be translated into broad claims about gender equality in education.
Most observations lie below the parity point
The median is 0.43999 and the mean is 0.57568. The first quartile is 0.23821 and the third quartile is 0.82834, meaning the middle half of country observations lies roughly between 0.24 and 0.83. The combination of a low median and 149 values below 0.97 shows that, in the observed data, female Arab-State-bound mobile outbound gross enrolment ratios are more often below the corresponding male ratios.
That pattern describes destination-specific mobility, not educational participation as a whole. International study choices can reflect geography, language, scholarships, tuition, programme availability, immigration rules, family decisions and university networks. The index measures the size and direction of the gender difference, but it does not identify which of those mechanisms produces the gap.
Eighteen official observations are exactly zero
The source reports a GPIA of exactly 0 for 18 countries and territories: Aruba, Bahamas, Bermuda, Bolivia (Plurinational State of), Cook Islands, Costa Rica, Cayman Islands, Estonia, Fiji, Gibraltar, Croatia, Jamaica, Luxembourg, Mexico, Niue, Paraguay, Slovenia, Tonga. These are official numeric observations, not missing values that were filled with zero. Zero is the lower endpoint of the adjusted index and therefore represents an extreme position on the parity scale.
The adjusted index alone is not enough to reconstruct the original female and male mobility ratios. That limitation matters particularly at the endpoints. A very small number of internationally mobile students can also make ratios sensitive to small changes in student counts. The safest interpretation is therefore that the official index is extremely far from parity, while the underlying female and male rates should be checked before drawing conclusions about the magnitude in student numbers.
The lowest nonzero adjusted indices
| Country or territory | 2023 GPIA |
|---|---|
| Nepal | 0.07497 |
| Malawi | 0.07570 |
| Kyrgyzstan | 0.07571 |
| Sierra Leone | 0.08224 |
| Vanuatu | 0.09027 |
| North Macedonia | 0.10301 |
| Ghana | 0.10920 |
| Albania | 0.13132 |
| Cambodia | 0.13534 |
| Cabo Verde | 0.13565 |
Nepal has the lowest nonzero value at 0.07497, closely followed by Malawi at 0.07570. Niger is at 0.09206, Bosnia and Herzegovina at 0.09610, and Cambodia at 0.09976. Values near 0.1 are very far from the parity point. On the below-1 side of the adjusted scale, the index is the ordinary female-to-male ratio, so the direction indicates a lower female mobility ratio.
The number should still not be applied directly to student counts. The underlying ratio uses the relevant five-year post-secondary-school-age population as its denominator, not the number of male students. Differences in population size and internationally mobile student counts are already combined in the rate. Student-number comparisons require the underlying mobility counts rather than GPIA alone.
The highest values are on the opposite side of parity
| Country or territory | 2023 GPIA |
|---|---|
| Solomon Islands | 2.00000 |
| British Virgin Islands | 1.94640 |
| Kiribati | 1.80345 |
| El Salvador | 1.76238 |
| Tuvalu | 1.76174 |
| Honduras | 1.68139 |
| Ecuador | 1.61367 |
| Lao People's Democratic Republic | 1.58716 |
| Panama | 1.58573 |
| Saint Lucia | 1.55734 |
Solomon Islands reaches 2.00000, the upper endpoint of the adjusted index. British Virgin Islands follows at 1.94640, Kiribati at 1.80345, El Salvador at 1.76238 and Tuvalu at 1.76174. Honduras records 1.68139, Ecuador 1.61367, Lao People’s Democratic Republic 1.58716, Panama 1.58573 and Saint Lucia 1.55734.
A value above 1 means the female underlying mobility ratio is higher than the male ratio, but the adjusted value is not a direct percentage difference. For example, 1.50 does not mean that the female ratio is simply 50% higher. The transformation used above 1 is designed to make the two sides of the scale comparable. Direction and distance from 1 are the clearest ways to read the index.
Only four observations fall inside the usual parity band
| Country or territory | 2023 GPIA |
|---|---|
| Yemen | 1.00245 |
| Belize | 0.99743 |
| Montserrat | 1.00820 |
| Jordan | 0.97859 |
| Syrian Arab Republic | 1.03149 |
| Bulgaria | 1.03405 |
| Spain | 1.03654 |
| Uruguay | 1.04006 |
| Haiti | 0.93500 |
| Egypt | 0.93458 |
Yemen at 1.00245, Belize at 0.99743, Montserrat at 1.00820 and Jordan at 0.97859 fall inside the commonly used 0.97 to 1.03 parity interval. Syrian Arab Republic is just outside at 1.03149. Bulgaria at 1.03405, Spain at 1.03654 and Uruguay at 1.04006 are also close to the center.
A near-1 value does not indicate a large flow of students to the Arab States. Both female and male outbound gross enrolment ratios could be very low and still be almost equal, or both could be relatively high. GPIA answers the parity question only. The level of mobility requires the underlying female and male ratios or student counts.
Regional medians differ, but every region is internally diverse
Using the 187 observed countries and territories and grouping them geographically, the simple median GPIA is 0.735 in North America, 0.596 in Asia, 0.590 in Oceania, 0.560 in South America, 0.415 in Europe and 0.368 in Africa. These are descriptive medians of the available country observations, not official UIS regional estimates weighted by population or mobile-student totals.
Every regional group spans a broad range. Asia contains observations below 0.1 as well as Lao People’s Democratic Republic above 1.5. Europe includes several official zeros but also Czechia at 1.39336. Oceania contains the upper endpoint in Solomon Islands and multiple zero values. These examples show why a regional average or median cannot substitute for country-level interpretation.
The destination restriction to the Arab States is essential
This series does not summarize all international tertiary study destinations. The indicator explicitly restricts the host region to the Arab States. A country can therefore have a low female-to-male parity value for study mobility to this destination while showing a very different gender pattern for Europe, North America, East Asia or all destinations combined.
That restriction is analytically useful because it isolates one destination region, but it also sets a clear boundary on interpretation. A low value does not establish that women from the country are less internationally mobile overall. Destination preferences can differ by sex, and the complete outbound mobility pattern would require parallel indicators for other host regions or the total across destinations.
Endpoint values need extra caution
The adjusted GPIA is bounded between 0 and 2, making those two values the most extreme possible observations. This dataset contains 18 official zeros and one value of 2. Extreme points attract attention on the map, but they can occur in settings with very small mobile-student flows where a change of only a few students may move the ratio substantially.
A stronger follow-up analysis would pair GPIA with the female and male mobile outbound gross enrolment ratios, the number of internationally mobile tertiary students, and the distribution of destination regions. That would help distinguish persistent structural differences from small-number effects or a one-year fluctuation.
What the indicator does not measure
GPIA is not a measure of the quality of universities in the Arab States, the success of international students, household affordability, scholarship access, or the overall gender balance of tertiary education at home. It also does not indicate whether more international mobility is inherently desirable. The series is a narrowly defined comparison of female and male destination-specific mobility ratios.
This distinction matters when comparing countries with very different population sizes and education systems. Two countries can have the same GPIA while sending vastly different numbers of students abroad. Conversely, two countries with similar student counts can have different GPIA values if their relevant female and male population denominators differ.
Data source and calculation method
The source is UNESCO Institute for Statistics indicator MOGER.5T8.40525.GPIA, officially titled ‘Mobile outbound gross enrolment ratio, tertiary students studying in the Arab States, adjusted gender parity index (GPIA) (UIS estimate).’ The reference year is 2023 and the supplied official dataset contains 187 country and territory observations. The 18 published zeros are preserved as official values and no missing catalogue unit is converted to zero.
The world map joins ISO3 country codes to a low-resolution global boundary layer. Of the 187 observed units, 156 match directly to polygons and 31 mostly small states and territories do not have separate matching polygons in that layer. All distribution statistics and tables use the full 187 official observations regardless of map visibility.
Frequently Asked Questions
What does a GPIA of 1 mean?
It means the female and male mobile outbound gross enrolment ratios to the Arab States are equal. Values from 0.97 to 1.03 are commonly treated as the parity range.
Are GPIA values of zero missing data?
No. The zero values in this dataset are official UNESCO UIS numeric observations. Missing catalogue units were not filled with zero.
Does this index describe all international study destinations?
No. The indicator is restricted to tertiary students studying in the Arab States. Other destination regions require separate mobility indicators.
Related Articles
Green Map creates custom-edited map images using open geographic data sources such as geoBoundaries, Natural Earth, OpenStreetMap, and government open data. These maps are edited visual materials, not raw data files, and are provided for education, documents, presentations, and graphic reference.