World Bank data for 2023 show a very wide range in the female tertiary gross enrollment ratio. Among 127 countries and economies with reported values, the simple mean is 61.50% and the median is 63.15%. Greece records the highest value at 171.11%, followed by Argentina at 140.19%, Macao SAR, China at 134.41%, Cyprus at 127.65% and Australia at 125.17%. Tanzania has the lowest reported value at 4.66%.
Values above 100% are possible because this is a gross enrollment ratio, not a percentage restricted to women of one official age. The numerator includes all female students enrolled at the tertiary level regardless of age, while the denominator is the female population of the age group officially corresponding to that level. In 2023, 18 reported observations are above 100% and 6 are above 120%.
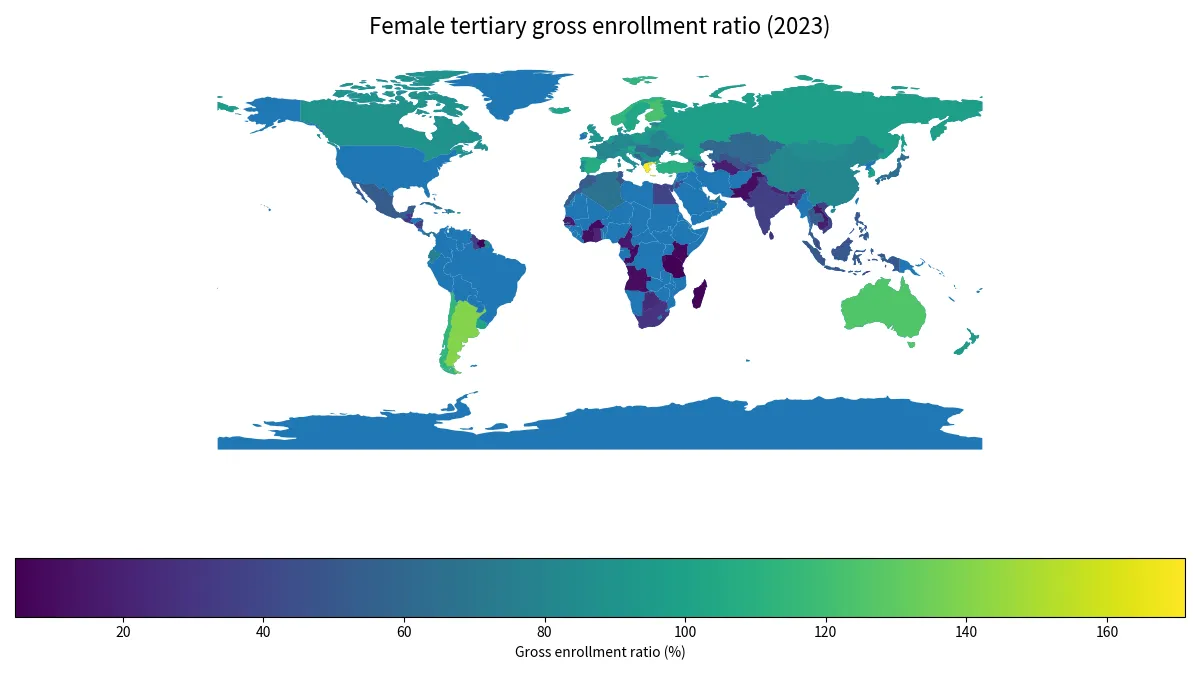
Table of Contents
Why a tertiary gross enrollment ratio can exceed 100%
Gross enrollment ratio and net enrollment concepts are different. The gross numerator can include students younger or older than the official age range. Tertiary education often includes delayed entry, return to study, adult learners and programs of different lengths, so enrollment outside a narrow age band can be substantial. A value of 120% does not mean 120% of one fixed group of women is enrolled at the same time; it reflects a numerator and denominator with different age coverage.
Greece at 171.11%, Argentina at 140.19%, Macao SAR at 134.41%, Cyprus at 127.65%, Australia at 125.17% and Finland at 123.14% illustrate the upper end. These numbers describe enrollment scale relative to the official-age female population, but they are not direct measures of teaching quality, graduation, research performance or employment outcomes.
The median is 63.15%, with the middle half between about 31.04% and 89.08%
The first quartile is 31.04% and the third quartile is 89.08%. The middle half of reported observations therefore lies roughly between those two points. 26 observations are below 25%, including 9 below 10%. The distance from the maximum to the minimum is 166.45 percentage points, showing a very large international spread.
The mean of 61.50% is close to the median of 63.15%, so the distribution is not dominated entirely by a small upper tail. Even so, the range is wide: countries above 100% coexist with countries below 10%. The median is useful as a central reference because half of the reported economies lie below it and half above it.
Europe and South America contain many high values, with large variation inside regions
Among observations matched to the map boundary, Europe has 37 reported values with a median of 89.55%, while South America has 6 with a median of 88.82%. Asia’s median is 48.18% and Africa’s 12.85%. These are unweighted descriptive medians, not population-weighted regional enrollment rates.
Regional patterns do not establish causes. Tertiary institution capacity, tuition and financial aid, completion of secondary education, opportunities for women, labor-market incentives, adult education and the structure of degree programs can all affect enrollment. The country-level ratio identifies where participation is high or low but does not isolate the contribution of each factor.
Large economies also differ substantially
China records 80.78%, India 35.24%, Japan 63.63%, Germany 82.20%, France 80.53% and the United Kingdom 93.50%. These are ratios relative to each country’s official-age female population, not counts of women enrolled in tertiary education.
A populous country can have a moderate ratio and still have a very large number of female tertiary students. A small economy can have a very high ratio but far fewer students in absolute terms. Comparing student numbers therefore requires enrollment counts, not only gross enrollment ratios.
Low values show limited enrollment relative to the target-age population, not a single cause
At the lower end, Tanzania records 4.66%, Burundi 5.27%, Suriname 6.07%, Madagascar 6.22%, Kenya 7.30%, Rwanda 7.74% and Burkina Faso 8.13%. Values around or below 10% indicate much smaller female tertiary enrollment relative to the official-age population.
The explanation cannot be reduced to one factor such as income or university capacity. Secondary completion, direct and indirect costs, distance, labor-market conditions, family constraints, program availability and national education structures can all matter. Additional evidence is needed before assigning a cause to a low ratio.
All 127 reported observations for 2023
The table lists the 127 countries and economies with a reported 2023 value, ordered from highest to lowest. The 90 source-missing rows remain missing rather than being replaced with zero. A missing observation is therefore not ranked as if it represented low enrollment.
| Rank | Country or economy | Female tertiary gross enrollment ratio |
|---|---|---|
| 1 | Greece | 171.11% |
| 2 | Argentina | 140.19% |
| 3 | Macao SAR China | 134.41% |
| 4 | Cyprus | 127.65% |
| 5 | Australia | 125.17% |
| 6 | Finland | 123.14% |
| 7 | Norway | 114.61% |
| 8 | Chile | 114.00% |
| 9 | Hong Kong SAR China | 110.14% |
| 10 | Türkiye | 110.00% |
| 11 | Spain | 106.62% |
| 12 | Iceland | 104.20% |
| 13 | Sweden | 104.13% |
| 14 | Austria | 103.99% |
| 15 | Singapore | 102.13% |
| 16 | Uruguay | 101.56% |
| 17 | Latvia | 101.50% |
| 18 | Malta | 101.42% |
| 19 | South Korea | 99.22% |
| 20 | Russia | 98.13% |
| 21 | Slovenia | 97.77% |
| 22 | Croatia | 97.72% |
| 23 | Puerto Rico | 95.93% |
| 24 | Belgium | 95.59% |
| 25 | New Zealand | 95.57% |
| 26 | Denmark | 94.86% |
| 27 | Netherlands | 94.44% |
| 28 | United Kingdom | 93.50% |
| 29 | Poland | 93.49% |
| 30 | Bulgaria | 91.77% |
| 31 | Lithuania | 91.76% |
| 32 | Italy | 89.55% |
| 33 | Canada | 88.61% |
| 34 | Serbia | 87.74% |
| 35 | Mongolia | 85.67% |
| 36 | Portugal | 85.41% |
| 37 | Bahrain | 84.33% |
| 38 | Georgia | 84.10% |
| 39 | Germany | 82.20% |
| 40 | Ukraine | 82.02% |
| 41 | Moldova | 81.72% |
| 42 | Estonia | 81.38% |
| 43 | China | 80.78% |
| 44 | France | 80.53% |
| 45 | Switzerland | 78.75% |
| 46 | Belarus | 78.45% |
| 47 | Dominican Republic | 77.18% |
| 48 | Albania | 77.03% |
| 49 | Czechia | 76.86% |
| 50 | Ecuador | 76.07% |
| 51 | Barbados | 73.90% |
| 52 | Qatar | 72.16% |
| 53 | Fiji | 70.94% |
| 54 | United Arab Emirates | 70.18% |
| 55 | Andorra | 68.00% |
| 56 | Algeria | 67.26% |
| 57 | Israel | 67.19% |
| 58 | Montenegro | 66.92% |
| 59 | Panama | 66.32% |
| 60 | Cuba | 65.25% |
| 61 | North Macedonia | 64.97% |
| 62 | Armenia | 63.83% |
| 63 | Japan | 63.63% |
| 64 | Hungary | 63.15% |
| 65 | Slovakia | 63.11% |
| 66 | Romania | 62.96% |
| 67 | Kazakhstan | 59.93% |
| 68 | Tonga | 58.61% |
| 69 | Kyrgyzstan | 58.48% |
| 70 | Bosnia & Herzegovina | 57.65% |
| 71 | Palestinian Territories | 54.78% |
| 72 | Mauritius | 52.31% |
| 73 | Thailand | 52.24% |
| 74 | Morocco | 51.82% |
| 75 | Mexico | 51.61% |
| 76 | Philippines | 50.95% |
| 77 | Indonesia | 49.89% |
| 78 | Palau | 49.70% |
| 79 | Tunisia | 49.40% |
| 80 | San Marino | 48.19% |
| 81 | Uzbekistan | 46.47% |
| 82 | Azerbaijan | 46.15% |
| 83 | Brunei | 44.52% |
| 84 | Malaysia | 44.30% |
| 85 | Jordan | 40.41% |
| 86 | Egypt | 37.96% |
| 87 | El Salvador | 37.28% |
| 88 | Vietnam | 36.08% |
| 89 | Nicaragua | 35.66% |
| 90 | Guyana | 35.27% |
| 91 | India | 35.24% |
| 92 | Tajikistan | 34.02% |
| 93 | Turks & Caicos Islands | 32.91% |
| 94 | British Virgin Islands | 32.21% |
| 95 | Timor-Leste | 31.55% |
| 96 | Guatemala | 30.53% |
| 97 | South Africa | 29.84% |
| 98 | Belize | 29.08% |
| 99 | Tuvalu | 27.83% |
| 100 | Sri Lanka | 26.05% |
| 101 | Botswana | 25.40% |
| 102 | Luxembourg | 23.45% |
| 103 | Samoa | 21.83% |
| 104 | Ghana | 21.68% |
| 105 | Bermuda | 20.94% |
| 106 | Bangladesh | 20.81% |
| 107 | Nepal | 20.79% |
| 108 | St. Lucia | 20.59% |
| 109 | Turkmenistan | 18.93% |
| 110 | Cambodia | 18.79% |
| 111 | Seychelles | 18.56% |
| 112 | Senegal | 16.46% |
| 113 | Bhutan | 15.16% |
| 114 | Cameroon | 14.54% |
| 115 | Laos | 12.69% |
| 116 | Sint Maarten | 12.55% |
| 117 | Côte d’Ivoire | 11.16% |
| 118 | Pakistan | 10.32% |
| 119 | Angola | 9.93% |
| 120 | Congo – Brazzaville | 8.32% |
| 121 | Burkina Faso | 8.13% |
| 122 | Rwanda | 7.74% |
| 123 | Kenya | 7.30% |
| 124 | Madagascar | 6.22% |
| 125 | Suriname | 6.07% |
| 126 | Burundi | 5.27% |
| 127 | Tanzania | 4.66% |
Gross enrollment is not education quality or graduation
The indicator measures the scale of participation relative to the official-age population. It does not show whether students complete their programs, how strong teaching and research are, or whether graduates find employment. High gross enrollment can coexist with long study durations or substantial enrollment outside the official age range.
Because this is a female-specific indicator, it also does not by itself show the gender gap. Comparing women and men requires the corresponding male indicator or a gender parity measure. A female rate near 100% does not automatically mean access is equal between sexes.
One year cannot establish a long-run trend
The comparison is a 2023 cross-section. It does not show which countries are increasing female tertiary participation fastest or whether a current level is rising or falling. Trend analysis requires multiple years under the same definition.
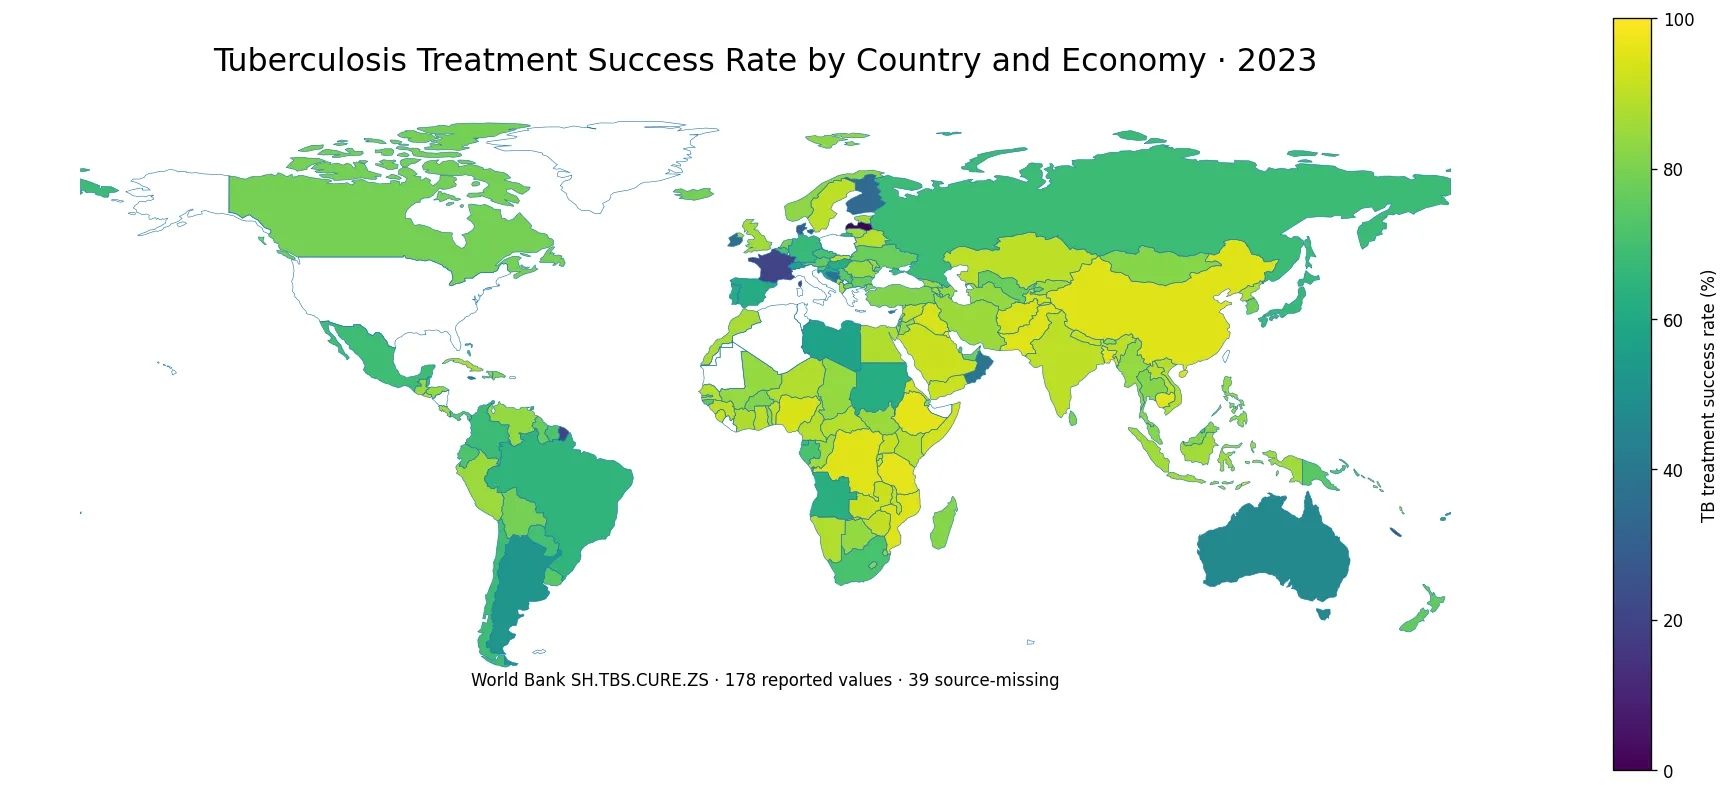
The map displays 108 of the 127 reported observations. The other 19 values are retained in the complete table and summary statistics because the low-resolution boundary does not include every small island or territory. Blank map areas should not be interpreted as zero.
Source and indicator definition
The source is the World Bank indicator SE.TER.ENRR.FE for 2023. The unit is percent. The World Bank defines gross enrollment as total enrollment at the education level regardless of age, divided by the population of the age group officially corresponding to that level. The mean, median, quartiles and ranking here are calculated from the 127 reported observations.
Frequently Asked Questions
Why can female tertiary gross enrollment exceed 100%?
Gross enrollment includes all female students enrolled at the tertiary level regardless of age, while the denominator is the female population of the official age group. Enrollment outside that range can push the ratio above 100%.
What is the 2023 median female tertiary gross enrollment ratio?
Across the 127 reported observations, the median is 63.15% and the simple mean is 61.50%.
Are missing values treated as zero?
No. The 90 source-missing rows remain missing and are excluded from the mean and ranking.
Does a high gross enrollment ratio mean better education quality or graduation?
No. The ratio measures participation relative to the official-age population and does not directly measure quality, graduation or employment outcomes.
Related Articles
Green Map creates custom-edited map images using open geographic data sources such as geoBoundaries, Natural Earth, OpenStreetMap, and government open data. These maps are edited visual materials, not raw data files, and are provided for education, documents, presentations, and graphic reference.