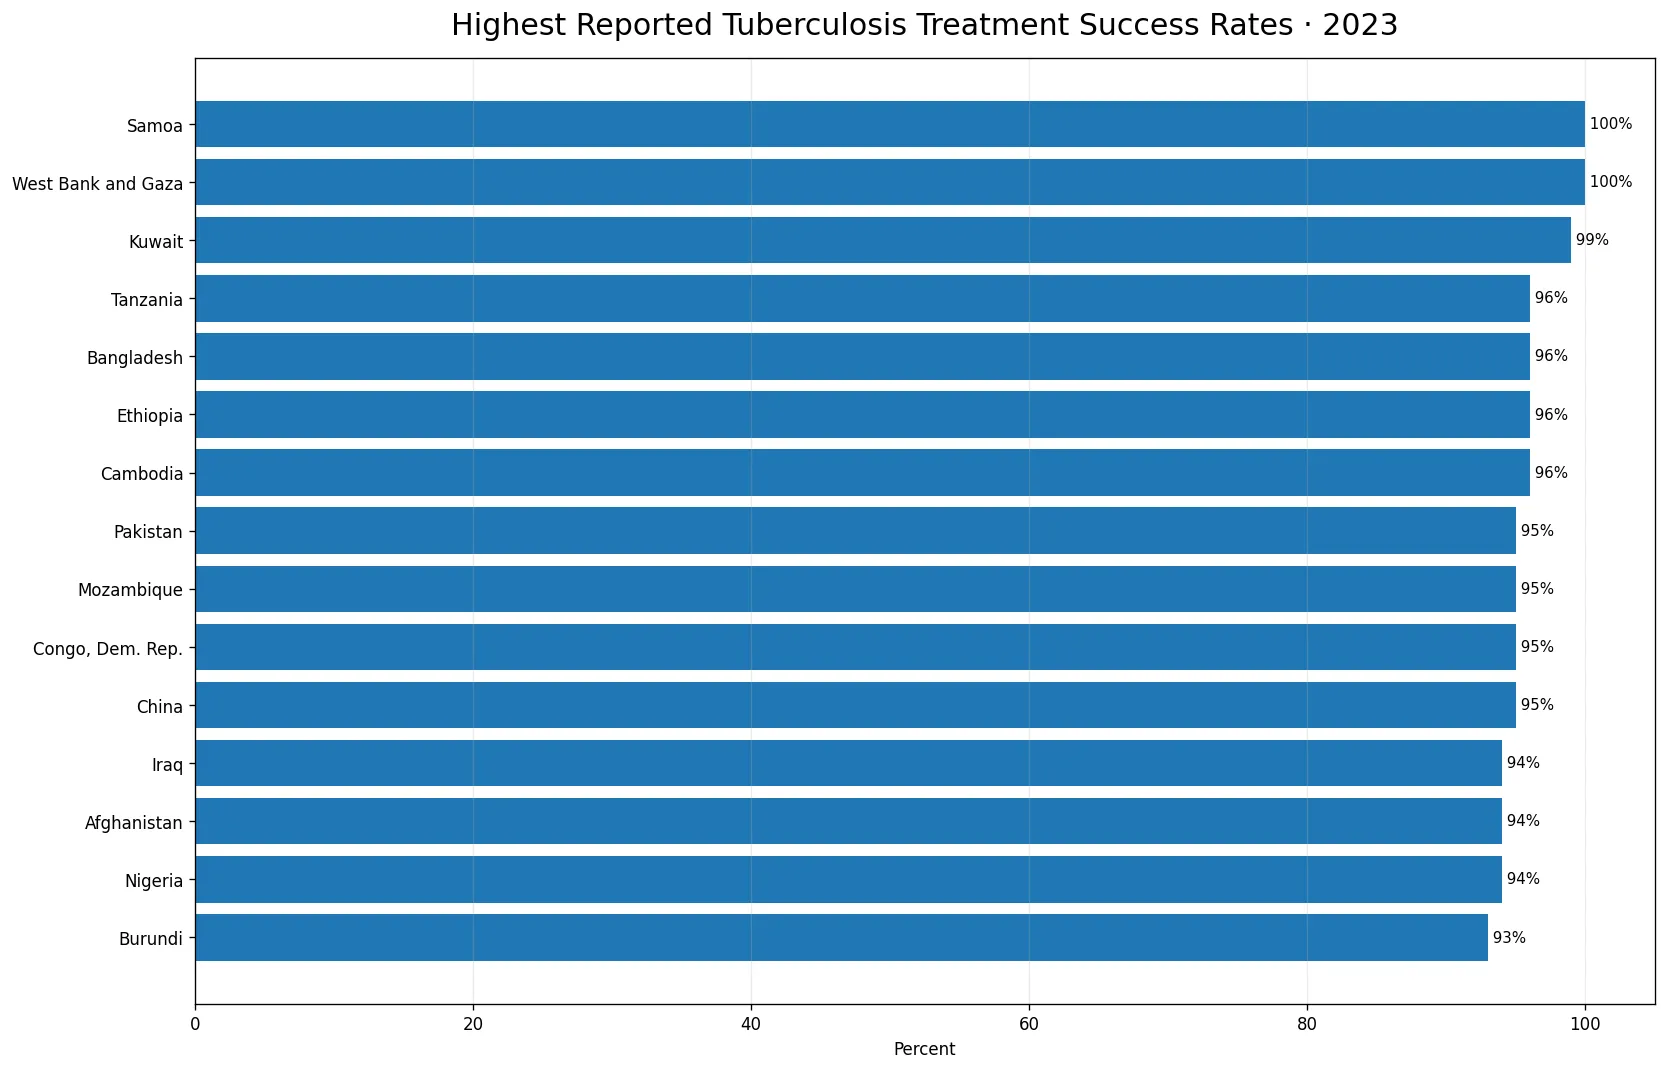
World Bank data for 2023 show a wide spread in tuberculosis treatment success rates across the 178 reporting countries and economies. West Bank and Gaza and Samoa report 100%, Kuwait 99%, and Bangladesh, Ethiopia, Cambodia, and Tanzania 96%. At the other end, France reports 20%, New Caledonia 26%, Denmark 30%, and Finland 34%, while Antigua and Barbuda, Grenada, and Latvia report 0%. The indicator is not a measure of tuberculosis incidence or the number of people with TB. It measures the share of registered new TB cases that successfully completed treatment.
The World Bank indicator code is SH.TBS.CURE.ZS and the unit is percent. Treatment success combines patients classified as cured with those who completed treatment. In some settings, the denominator can include new and relapse cases rather than new cases alone. That detail matters when comparing countries. A reported 100% does not mean TB has been eliminated, and a low percentage does not by itself describe the performance of an entire health system. The metric is specifically about treatment outcomes among patients included in the reporting program.
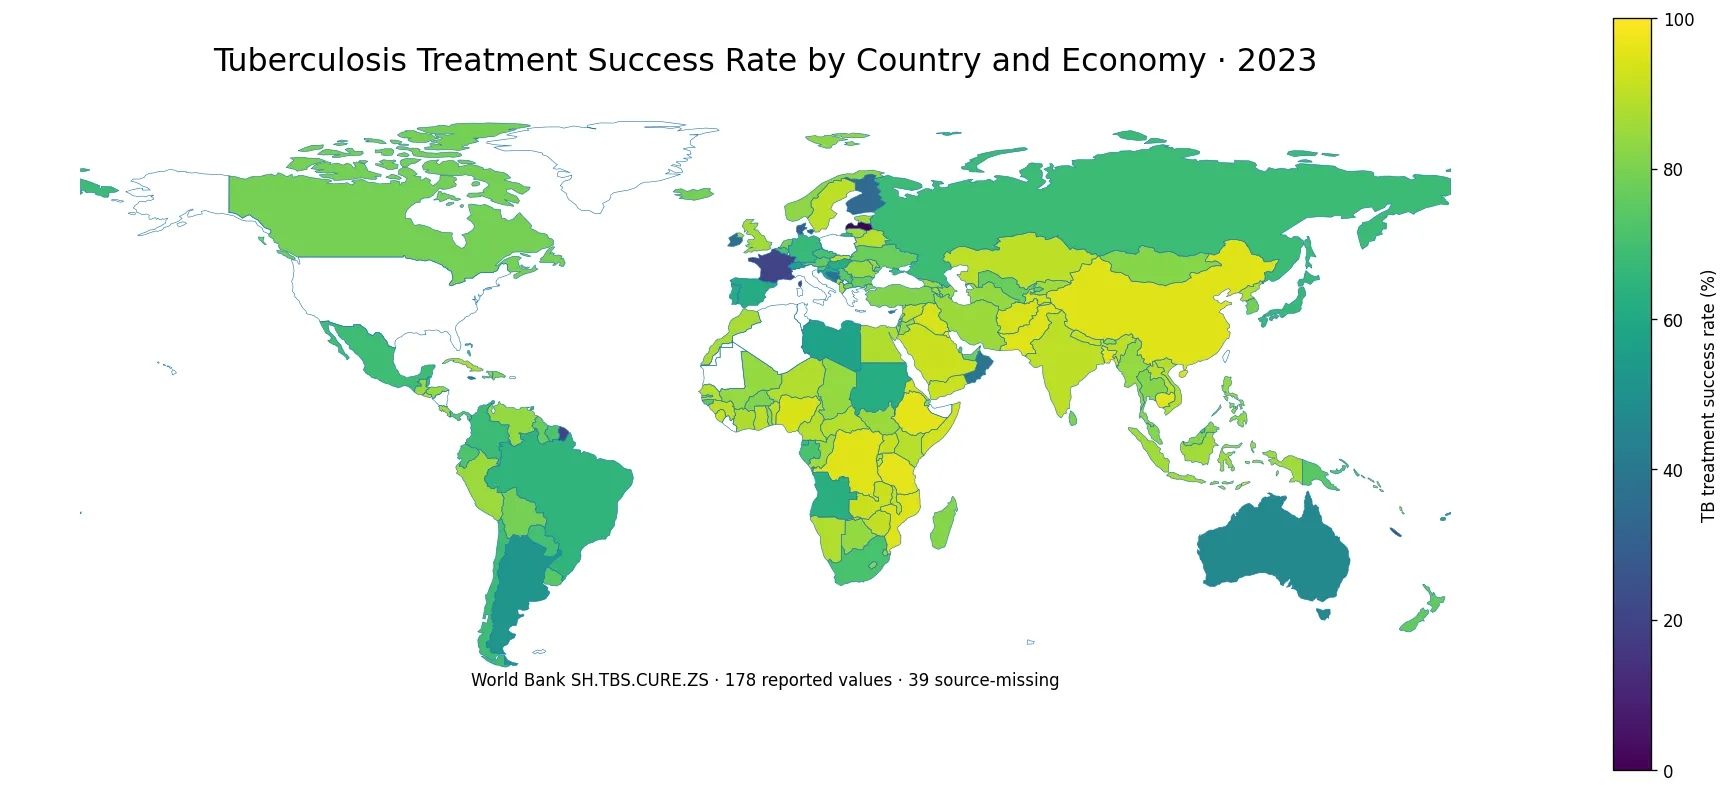
Table of Contents
The median reported success rate is 84%
Across the 178 reported observations, the median is 84% and the mean is 77.9%. The first quartile is 72% and the third quartile is 89%, so half of the reporting countries and economies fall roughly between those two values. There are 44 observations at 90% or above, 63 between 80% and 89%, and 34 between 70% and 79%. Another 24 fall between 50% and 69%, while 13 are below 50%. These distribution counts are more informative than focusing only on the very highest and lowest observations.
Many countries in South and East Asia report high values
Bangladesh and Cambodia each report 96%, China and Pakistan 95%, Afghanistan 94%, Tajikistan 93%, India 90%, and Indonesia 86%. The region is not uniform, however. Japan reports 67% and Cyprus 40%. This contrast shows why continental labels are too broad for this indicator. The map is useful because it reveals both clusters of high values and sharp differences between countries in the same broad region. The current series does not identify the specific reasons for those differences, so causal explanations require other official TB program measures.
African countries also span a wide range
Ethiopia and Tanzania report 96%, the Democratic Republic of the Congo and Mozambique 95%, Nigeria 94%, and Burundi and Eritrea 93%. South Africa reports 71%, substantially below those high values. The contrast within Africa is another reminder that treatment success is shaped by the outcomes of registered patients rather than by geography alone. Treatment completion, cure, death, treatment failure, loss to follow-up, and unassessed outcomes can all affect the final rate, but the single indicator does not show how much each component contributed in a particular country.
Reported values of 100% and 0% need context
The 2023 series contains 2 observations at 100% and 3 at 0%. A 100% value means every case included in the indicator denominator was classified as successfully treated. A 0% value means the reported indicator itself was zero. Neither extreme tells us how many patients were involved. Small denominators, differences in case composition, or reporting arrangements can matter greatly when interpreting an extreme percentage. The data support describing the reported rate, but they do not support broader conclusions about the entire national health system without additional evidence.
| Country/economy | Treatment success rate |
|---|---|
| West Bank and Gaza | 100% |
| Samoa | 100% |
| Kuwait | 99% |
| Bangladesh | 96% |
| Ethiopia | 96% |
| Cambodia | 96% |
| Tanzania | 96% |
| China | 95% |
| Congo, Dem. Rep. | 95% |
| Mozambique | 95% |
Low reported values appear in several different regions
Low values are not confined to one part of the world. France reports 20%, Denmark 30%, Finland 34%, Ireland 36%, and Bosnia and Herzegovina 37%. New Caledonia reports 26%, Australia 47%, Jamaica 38%, and Saint Lucia 50%. This geographic mix makes it difficult to explain the lower tail with a single regional story. To understand why a country has a low treatment success rate, analysts would need information on registered case numbers, treatment outcome categories, drug resistance, follow-up, and other program conditions that are not contained in this one series.
| Country/economy with a low reported value | Treatment success rate |
|---|---|
| Antigua and Barbuda | 0% |
| Grenada | 0% |
| Latvia | 0% |
| France | 20% |
| New Caledonia | 26% |
| Denmark | 30% |
| Finland | 34% |
| Ireland | 36% |
| Bosnia and Herzegovina | 37% |
| Jamaica | 38% |
Treatment success is different from TB incidence and prevalence
A country can have a high treatment success rate and still face a large tuberculosis burden. Incidence measures the number of new disease episodes relative to population, while prevalence concerns the number of people living with disease at a given time or period. Treatment success begins with a different population: patients who were registered for treatment and included in the outcome reporting system. Because the denominators are different, these indicators should not be substituted for one another. A complete picture of TB control requires several measures, not one percentage.
A high success rate does not automatically prove broad access to care
Patients who were never diagnosed, never registered, or never linked to treatment may not enter the denominator of this indicator. That means treatment success and treatment access answer different questions. A high success rate among registered patients can coexist with gaps in case detection or access, while a lower rate can reflect a mix of treatment failure, death, loss to follow-up, or other outcomes. The current data do not separate those pathways. For that reason, the rate is best treated as a focused outcome measure rather than a complete score for TB services.
Thirty-nine source-missing observations remain no data
The World Bank country/economy master contains 217 rows for this comparison, with 178 reported 2023 values and 39 missing observations. Missing does not mean 0%. The three economies with a reported 0% are different from the economies that have no 2023 value. Converting missing observations to zero would artificially enlarge the lower tail and distort the map. All summary statistics here therefore use only reported values, while source-missing areas remain no data.
Rankings are less important than the distribution and definition
Because the indicator is bounded between 0% and 100%, it is tempting to turn it into a simple league table. That can hide important context. A difference between 95% and 94% is only one percentage point, while the gap between the 84% median and a 20% observation is much larger. The number of registered cases can also differ enormously across countries, so identical percentages can represent very different patient counts. Maps and tables are useful for locating contrasts, but the indicator definition and denominator should remain central to interpretation.
What stands out in the 2023 cross-section
The 2023 distribution combines many high values with a substantial lower tail. The median is 84%, 44 reporting countries and economies are at 90% or above, and 37 are below 70%. The observed range stretches from 0% to 100%. These facts show that treatment outcomes vary widely across reporting settings. They do not tell us whether an individual country is improving or worsening over time. Trend analysis requires the same indicator for multiple years and attention to changes in case definitions and reporting coverage.
Source and calculation method
The source is the World Bank indicator SH.TBS.CURE.ZS for 2023, measured in percent. The mean (77.9%), median (84%), quartiles, and distribution counts are calculated from the 178 reported observations. The geographic list includes countries and separately reported economies or territories, so it should not be read as a count of sovereign states. Missing observations are not imputed or converted to zero. Historical values can be revised by the underlying source, so a later refresh of the same year may not be identical.
Frequently Asked Questions
What does the TB treatment success rate measure?
It measures the percentage of registered new TB cases classified as cured or as having completed treatment successfully. Some countries may include new and relapse cases in the denominator.
Does a high treatment success rate mean low TB incidence?
No. Treatment success describes outcomes among registered patients, while incidence measures new TB episodes relative to population.
Are missing countries treated as 0%?
No. The 39 source-missing observations remain no data and are kept separate from the three reported 0% values.
Does a 100% success rate mean tuberculosis is no longer a problem?
No. It only means all cases included in the indicator denominator were classified as successfully treated. It does not measure the size of the TB burden.
Related Articles
Green Map creates custom-edited map images using open geographic data sources such as geoBoundaries, Natural Earth, OpenStreetMap, and government open data. These maps are edited visual materials, not raw data files, and are provided for education, documents, presentations, and graphic reference.