World Bank data for 2020 show a very wide range in the female preprimary gross enrollment ratio. Among 140 countries and economies with reported values, the median is 78.95% and the simple mean is 72.74%. Australia records the highest value at 156.92%, followed by Liberia at 133.95%. At the lower end, the Federated States of Micronesia is at 5.87%, Burkina Faso at 6.39% and the Democratic Republic of the Congo at 7.12%. The source contains 217 rows for 2020, but 77 have no reported value and are excluded from the calculations.
This indicator is not the same as the percentage of girls of official preprimary age who are enrolled. A gross enrollment ratio places all female enrollment at the preprimary level in the numerator, regardless of age, and divides it by the female population of the age group officially associated with that level. That is why 24 reported values exceed 100%. A figure above 100% is not automatically an error; it can reflect enrollment of children outside the official age range.
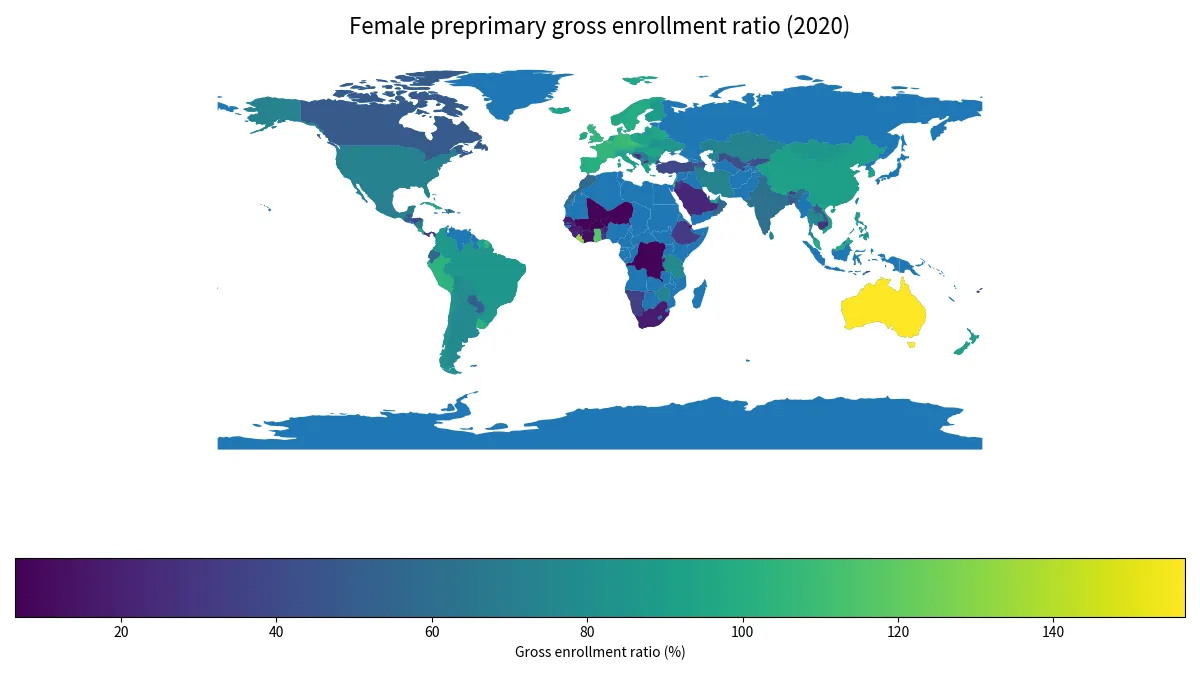
Table of Contents
Why a gross enrollment ratio can be above 100%
Gross enrollment ratio and net enrollment rate answer different questions. The numerator of the gross ratio includes children enrolled at the education level even when they are younger or older than the official age for that level. The denominator is the population of the official age group. Early entry, late entry, repetition or other age mismatches can therefore push the ratio above 100%. A value of 120% should not be read as 100% of eligible girls enrolled plus another 20% of the same eligible population.
In the 2020 observations, 24 values are above 100% and 5 are above 120%. Australia at 156.92%, Liberia at 133.95%, the British Virgin Islands at 128.85%, Grenada at 127.77% and Gibraltar at 125.12% are above 120%. These values describe the relationship between enrollment and the official-age population, but they are not direct scores of education quality or learning outcomes.
The median is 78.95%, with the middle half between about 47.76% and 96.06%
The mean across the 140 reported observations is 72.74% and the median is 78.95%. The first quartile is 47.76% and the third quartile is 96.06%, placing the middle half roughly between those two points. 38 observations are below 50%, including 14 below 25%. The gap between the maximum and minimum is 151.05 percentage points, showing how broad the cross-country distribution is.
Large economies also span a substantial range. China reports 90.73%, Brazil 85.73%, the United States 72.57%, Mexico 71.50% and India 61.34%. These are national ratios compared with equal weight, not an enrollment-weighted global average. National definitions of official preprimary age and the organization of early childhood programs can also differ, so the ratio is most useful when its definition remains explicit.
The map shows relatively high values across much of Europe and South America
Among countries that match the map boundary, the median is 93.89% for 36 European observations and 84.74% for 10 South American observations. The corresponding medians are 62.37% for 32 Asian observations, 64.36% for 12 North American observations and 21.89% for 21 African observations. These are descriptive medians of the map-matched sample, not weighted regional estimates.
Africa also contains some of the largest internal contrasts. Liberia is at 133.95% and Ghana at 117.21%, while Burkina Faso is at 6.39%, the Democratic Republic of the Congo at 7.12%, Niger at 7.60% and Mali at 7.79%. Geography alone therefore does not determine the rate. Explaining the differences would require additional evidence on education systems, official age definitions, capacity, participation and statistical practice.
High and low values should not be treated as a simple education ranking
The upper group includes Australia at 156.92%, Liberia at 133.95%, the British Virgin Islands at 128.85%, Grenada at 127.77%, Gibraltar at 125.12%, Ghana at 117.21%, Belgium at 113.20% and Czechia at 112.00%. The lower group includes the Federated States of Micronesia at 5.87%, Burkina Faso at 6.39%, the Democratic Republic of the Congo at 7.12%, Niger at 7.60% and Mali at 7.79%. Because gross enrollment includes students outside the official age group, the ranking is not a direct measure of education quality or learning.
The reference year also matters. The comparison is specifically for 2020, when the COVID-19 pandemic affected schooling and administrative systems in many places. A single cross-section should not be treated as a long-run trend. Measuring improvement or deterioration requires multiple years under the same indicator definition.
All 140 reported observations for 2020
The table lists the 140 countries and economies with a reported 2020 value, ordered from highest to lowest. The 77 source-missing rows are not replaced with zero. The ranking therefore applies only to places with reported observations and does not place missing economies at the bottom.
| Rank | Country or economy | Female gross enrollment ratio |
|---|---|---|
| 1 | Australia | 156.92% |
| 2 | Liberia | 133.95% |
| 3 | British Virgin Islands | 128.85% |
| 4 | Grenada | 127.77% |
| 5 | Gibraltar | 125.12% |
| 6 | Ghana | 117.21% |
| 7 | Belgium | 113.20% |
| 8 | St. Vincent & Grenadines | 113.18% |
| 9 | Malta | 112.49% |
| 10 | Czechia | 112.00% |
| 11 | Israel | 110.44% |
| 12 | San Marino | 108.44% |
| 13 | Germany | 107.66% |
| 14 | France | 106.01% |
| 15 | United Kingdom | 105.84% |
| 16 | Uruguay | 103.46% |
| 17 | Peru | 103.32% |
| 18 | Liechtenstein | 102.97% |
| 19 | Austria | 102.61% |
| 20 | Switzerland | 102.30% |
| 21 | Vanuatu | 102.15% |
| 22 | Denmark | 101.89% |
| 23 | Spain | 101.70% |
| 24 | Slovakia | 100.51% |
| 25 | Sweden | 99.78% |
| 26 | Mauritius | 99.61% |
| 27 | Portugal | 99.06% |
| 28 | Seychelles | 98.15% |
| 29 | Malaysia | 98.00% |
| 30 | Cuba | 97.57% |
| 31 | Costa Rica | 97.18% |
| 32 | Nepal | 96.75% |
| 33 | Turks & Caicos Islands | 96.51% |
| 34 | Belarus | 96.29% |
| 35 | Norway | 96.22% |
| 36 | Hong Kong SAR China | 96.01% |
| 37 | Ireland | 95.31% |
| 38 | Romania | 94.98% |
| 39 | Latvia | 94.49% |
| 40 | United Arab Emirates | 94.27% |
| 41 | Curaçao | 94.23% |
| 42 | Vietnam | 94.14% |
| 43 | Iceland | 93.96% |
| 44 | Poland | 93.83% |
| 45 | Greece | 93.66% |
| 46 | Moldova | 93.60% |
| 47 | Slovenia | 93.12% |
| 48 | Kiribati | 93.02% |
| 49 | Netherlands | 92.83% |
| 50 | Luxembourg | 91.98% |
| 51 | South Korea | 91.88% |
| 52 | Italy | 91.83% |
| 53 | Suriname | 91.74% |
| 54 | New Zealand | 91.26% |
| 55 | China | 90.73% |
| 56 | Hungary | 89.75% |
| 57 | Macao SAR China | 89.03% |
| 58 | Lithuania | 88.80% |
| 59 | Finland | 88.30% |
| 60 | Philippines | 87.02% |
| 61 | Colombia | 86.67% |
| 62 | Barbados | 86.37% |
| 63 | Brazil | 85.73% |
| 64 | Cyprus | 85.52% |
| 65 | Mongolia | 85.19% |
| 66 | Ukraine | 85.14% |
| 67 | Bulgaria | 83.85% |
| 68 | Chile | 83.75% |
| 69 | Dominica | 79.19% |
| 70 | Bolivia | 79.06% |
| 71 | St. Lucia | 78.85% |
| 72 | Tanzania | 77.97% |
| 73 | Maldives | 77.95% |
| 74 | Montenegro | 77.02% |
| 75 | Argentina | 76.71% |
| 76 | Thailand | 75.30% |
| 77 | Albania | 75.14% |
| 78 | Sri Lanka | 73.86% |
| 79 | Iran | 73.70% |
| 80 | Tuvalu | 73.68% |
| 81 | Palau | 73.56% |
| 82 | Kazakhstan | 73.56% |
| 83 | Zimbabwe | 72.63% |
| 84 | United States | 72.57% |
| 85 | Mexico | 71.50% |
| 86 | Trinidad & Tobago | 71.10% |
| 87 | Croatia | 70.81% |
| 88 | Nicaragua | 70.43% |
| 89 | Serbia | 65.48% |
| 90 | Brunei | 63.11% |
| 91 | Qatar | 62.60% |
| 92 | Marshall Islands | 62.52% |
| 93 | Kuwait | 62.14% |
| 94 | India | 61.34% |
| 95 | Dominican Republic | 58.30% |
| 96 | Palestinian Territories | 58.20% |
| 97 | Morocco | 57.64% |
| 98 | Ecuador | 57.39% |
| 99 | Oman | 56.30% |
| 100 | Bahrain | 55.74% |
| 101 | Paraguay | 51.32% |
| 102 | Tonga | 50.58% |
| 103 | Laos | 49.87% |
| 104 | Canada | 48.56% |
| 105 | Guatemala | 48.07% |
| 106 | Bangladesh | 46.83% |
| 107 | Armenia | 46.76% |
| 108 | Belize | 46.65% |
| 109 | Gambia | 45.06% |
| 110 | Azerbaijan | 44.41% |
| 111 | Kyrgyzstan | 40.90% |
| 112 | Uzbekistan | 40.67% |
| 113 | Honduras | 40.12% |
| 114 | Türkiye | 39.12% |
| 115 | Namibia | 34.89% |
| 116 | Nauru | 33.58% |
| 117 | Fiji | 32.91% |
| 118 | Bhutan | 32.62% |
| 119 | Ethiopia | 32.30% |
| 120 | North Macedonia | 31.68% |
| 121 | Jordan | 31.47% |
| 122 | Togo | 30.27% |
| 123 | Timor-Leste | 28.54% |
| 124 | Cambodia | 27.70% |
| 125 | Panama | 27.43% |
| 126 | Bosnia & Herzegovina | 26.99% |
| 127 | Benin | 22.40% |
| 128 | Saudi Arabia | 22.35% |
| 129 | Sierra Leone | 21.89% |
| 130 | Senegal | 17.93% |
| 131 | South Africa | 17.70% |
| 132 | Guinea | 17.37% |
| 133 | Burundi | 16.75% |
| 134 | Côte d’Ivoire | 10.96% |
| 135 | Djibouti | 9.66% |
| 136 | Mali | 7.79% |
| 137 | Niger | 7.60% |
| 138 | Congo – Kinshasa | 7.12% |
| 139 | Burkina Faso | 6.39% |
| 140 | Micronesia | 5.87% |
What to keep in mind when using the comparison
The most important distinction is between gross and net enrollment concepts. Gross enrollment compares all enrollment at the level with the official-age population, so values above 100% are possible. Net measures restrict the numerator to children in the official age group and therefore answer a different question. Countries may also organize preprimary education and define official age ranges differently. The gross ratio is useful for describing the scale of enrollment relative to the target-age population, but it does not by itself measure quality, learning or equity.
The map displays 115 of the 140 reported observations. The other 25 values, mostly small islands or territories absent from the low-resolution boundary, remain in the full table and summary statistics. Missing source values and unmatched map geometries are not treated as zero, so a blank area on the map should not be read as a low enrollment ratio.
Source and indicator definition
The source is the World Bank indicator SE.PRE.ENRR.FE, “School enrollment, preprimary, female (% gross).” The reference year is 2020 and the unit is percent. The World Bank defines gross enrollment as total enrollment at the level, regardless of age, divided by the population of the age group officially corresponding to that education level. The mean, median, quartiles and ranking here are calculated from the 140 reported 2020 observations.
Frequently Asked Questions
Why can the female preprimary gross enrollment ratio exceed 100%?
Gross enrollment includes all female students enrolled at the level regardless of age, while the denominator is the female population of the official age group. Enrollment outside that age range can push the ratio above 100%.
What is the median female preprimary gross enrollment ratio in 2020?
Across the 140 reported observations, the median is 78.95% and the simple mean is 72.74%.
Are missing 2020 values treated as zero?
No. The 77 source-missing rows remain missing and are excluded from the mean, median and ranking.
Does a higher gross enrollment ratio mean better preprimary education quality?
No. The ratio measures enrollment relative to the official-age population and does not directly measure teaching quality, learning outcomes or equity.
Related Articles
Green Map creates custom-edited map images using open geographic data sources such as geoBoundaries, Natural Earth, OpenStreetMap, and government open data. These maps are edited visual materials, not raw data files, and are provided for education, documents, presentations, and graphic reference.