Eurostat’s 2025 business digitalisation data show that AI used to enable the physical movement of machines through autonomous decisions remains uncommon across the 30 reporting countries. Denmark records the highest share at 4.38%, followed by Belgium at 2.95%, Lithuania at 2.75%, Finland at 2.73% and the Netherlands at 2.36%. Serbia has the lowest reported value at 0.17%.
The simple mean is 1.47% and the median is 1.35%. The first quartile is 0.83% and the third quartile 1.71%, placing the middle half of observations between roughly 0.83% and 1.71%. Even the maximum remains below 5%, which makes this a narrow and specialised form of enterprise AI adoption.
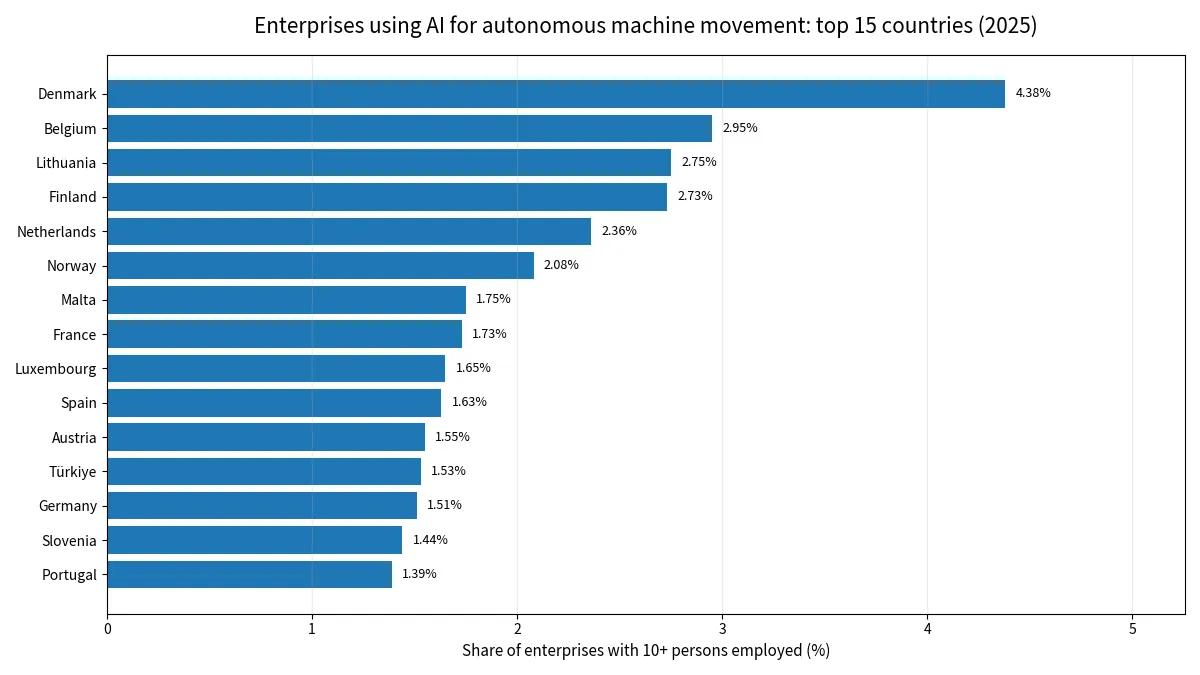
Table of Contents
This is physical machine movement, not general workflow automation
E_AI_TAR is narrower than a general automation indicator. The defining feature is that AI enables the physical movement of machines through autonomous decisions. It is therefore closer to robotics and autonomous equipment than to software-only workflow automation, document processing or decision-support tools that do not cause machines to move.
The distinction matters because enterprises can use several AI categories at the same time. A business can use language generation, image recognition and workflow automation without using autonomous machine movement. Another business can combine autonomous equipment with those same tools. Separate Eurostat technology percentages overlap at enterprise level and should not be added together to produce a total AI-use rate.
Denmark leads at 4.38%, but even the highest rates are low
Denmark is highest at 4.38%, followed by Belgium at 2.95%, Lithuania at 2.75% and Finland at 2.73%. The Netherlands records 2.36% and Norway 2.08%. The top five observations average 3.03%, showing that even the upper end remains a small share of eligible enterprises.
At the other end, Serbia is at 0.17%, Cyprus 0.51%, Romania 0.68%, Bulgaria 0.69% and Poland 0.70%. The bottom five average 0.55%. The gap between the extremes is notable in relative terms, but the absolute percentages remain low throughout the distribution.
The distribution is compressed around 1% to 2%
The mean of 1.47% is only slightly above the median of 1.35%. That small difference suggests that higher observations lift the average without creating an extremely skewed distribution. The interquartile range from 0.83% to 1.71% contains half of the reporting countries and shows where the typical values are concentrated.
By bands, 1 countries are at 3% or above, 5 are from 2% to below 3%, 13 are from 1% to below 2%, 10 are from 0.5% to below 1%, and 1 are below 0.5%. The largest group sits between 1% and 2%. In a distribution this low, a one-percentage-point difference can represent a substantial relative difference.
Nordic and Benelux averages are higher, but variation inside regions is substantial
The simple average for Denmark, Finland, Norway and Sweden is 2.58%. The Benelux average is 2.32% and the Baltic average 1.62%. Denmark’s 4.38% is far above Sweden’s 1.14%, while Lithuania’s 2.75% is well above Estonia’s 0.79%. Geographic proximity therefore does not produce a common adoption level.
Industrial structure may be relevant because autonomous machine movement is more applicable in manufacturing, warehousing, logistics, transport and other equipment-intensive activities than in many office-based services. Investment capacity, safety rules, installed automation and the availability of suitable processes may also matter. Those factors are not measured in this country-level rate, so they should remain possible explanations rather than conclusions.
Large economies are mostly in the same low range
Germany records 1.51%, France 1.73%, Italy 0.97% and Spain 1.63%. Their simple average is 1.46%. This is not an enterprise-weighted combined rate; each country percentage receives the same weight.
The unit is a percentage of enterprises, not workers, robots or capital expenditure. A manufacturer employing thousands of people and a smaller firm just above the ten-person threshold each count as one enterprise. The indicator therefore measures prevalence across businesses rather than the physical scale of automation.
Autonomous machine AI applies directly to only some business processes
Physical movement sets this technology apart from many other forms of enterprise AI. Factories may use autonomous mobile robots, warehouses may use self-moving equipment, and other sectors can deploy machines that change position or act physically based on AI decisions. Many service businesses have fewer opportunities for this kind of application, even if they use AI extensively for language, analytics or customer service.
The country percentage also does not reveal whether enterprises own autonomous machines, rent them, or rely on an external provider. It does not show how many machines are deployed, how often autonomous functions are active, or whether the AI makes fully independent decisions or operates under human supervision. Adoption and intensity remain different concepts.
A low rate should not be generalised into low AI use
Serbia’s 0.17% indicates that this specific technology is rare among eligible enterprises, not that AI use overall is rare. Enterprises can use image recognition, natural-language tools, predictive analytics or workflow automation without deploying AI that physically moves machines.
Similarly, Denmark’s leading value should not be treated as a comprehensive AI competitiveness score. It shows wider use of one specialised technology category. A broader assessment would need multiple AI indicators together with sector, investment, skills and outcome data.
All 30 comparable observations for 2025
The table orders all 30 country observations from highest to lowest using the same year, size class, sector aggregate, indicator and unit. The ranking is a navigation aid rather than a composite ranking of national AI capability.
| Rank | Country | Share of enterprises |
|---|---|---|
| 1 | Denmark | 4.38% |
| 2 | Belgium | 2.95% |
| 3 | Lithuania | 2.75% |
| 4 | Finland | 2.73% |
| 5 | Netherlands | 2.36% |
| 6 | Norway | 2.08% |
| 7 | Malta | 1.75% |
| 8 | France | 1.73% |
| 9 | Luxembourg | 1.65% |
| 10 | Spain | 1.63% |
| 11 | Austria | 1.55% |
| 12 | Türkiye | 1.53% |
| 13 | Germany | 1.51% |
| 14 | Slovenia | 1.44% |
| 15 | Portugal | 1.39% |
| 16 | Latvia | 1.32% |
| 17 | Albania | 1.28% |
| 18 | Sweden | 1.14% |
| 19 | Czechia | 1.10% |
| 20 | Italy | 0.97% |
| 21 | Slovakia | 0.94% |
| 22 | Hungary | 0.87% |
| 23 | Ireland | 0.82% |
| 24 | Estonia | 0.79% |
| 25 | Croatia | 0.72% |
| 26 | Poland | 0.70% |
| 27 | Bulgaria | 0.69% |
| 28 | Romania | 0.68% |
| 29 | Cyprus | 0.51% |
| 30 | Serbia | 0.17% |
A single year cannot show adoption speed
This comparison is a 2025 cross-section. A high current level does not necessarily mean the fastest recent growth, and a low level does not imply decline. Measuring adoption speed requires earlier observations under the same definition.
Time-series comparisons also need a consistent indicator, enterprise-size class, industry coverage and unit. Changes in survey design can create apparent movements that are not caused by technology adoption itself. This article therefore keeps the interpretation limited to a like-for-like 2025 comparison.
Source and indicator definition
The source is Eurostat isoc_eb_ai for 2025. The indicator is E_AI_TAR, the enterprise-size class is GE10, the sector aggregate is C10-S951_X_K and the unit is PC_ENT. It measures the percentage of enterprises with ten or more persons employed using AI that enables physical movement of machines through autonomous decisions. The mean, median and quartiles are calculated from the 30 country observations.
Frequently Asked Questions
Which country had the highest share of enterprises using AI for autonomous machine movement in 2025?
Denmark had the highest share among the 30 reporting countries at 4.38%, followed by Belgium, Lithuania and Finland.
Is E_AI_TAR a general workflow automation indicator?
No. It measures enterprises using AI that enables physical movement of machines through autonomous decisions.
What are the mean and median across the 30 countries?
The simple mean is 1.47% and the median is 1.35%.
Does a low rate mean overall AI use is low?
No. Enterprises can use language, image, predictive or workflow AI without using autonomous machine movement.
Related Articles
Green Map creates custom-edited map images using open geographic data sources such as geoBoundaries, Natural Earth, OpenStreetMap, and government open data. These maps are edited visual materials, not raw data files, and are provided for education, documents, presentations, and graphic reference.