Rockcastle County in Kentucky is crossed by a major interstate corridor and surrounded by a landscape of creek valleys and narrow ridges. Mount Vernon is the main reference point, Brodhead lies to the west, and Livingston is tucked into the southeast. The maps on this page show roads, towns, water, and elevation separately so each feature stays readable, and the full-resolution JPG versions are available together in a downloadable ZIP.
A good way to orient yourself is to find I-75 first. It enters from the north, passes the Mount Vernon area, and continues toward the southern part of the county near the Livingston corridor. From that central route, KY 150 leads west toward Brodhead while U.S. 25 and several state roads connect valleys farther east and south. The contrast between the transportation corridor and the surrounding ridges becomes especially clear when the road, water, and elevation maps are viewed side by side.
Table of Contents
Mount Vernon is the easiest reference point for the county
On the general county map, Mount Vernon appears near the center-west of Rockcastle County with the courthouse marked nearby. I-75 runs just east of town, making the city easy to identify even before reading the smaller road labels. U.S. 25 and a network of Kentucky routes spread outward from this area, so Mount Vernon works as a practical starting point for understanding both local travel and the broader shape of the county.
The map labels KY 150, KY 70, KY 461, KY 618, KY 421, and KY 490 in addition to I-75 and U.S. 25. Their paths become more winding away from the central corridor, particularly toward the east and southeast. That change is not random: many roads follow lower ground between ridges, while the more rugged terrain limits the number of direct east-west routes.
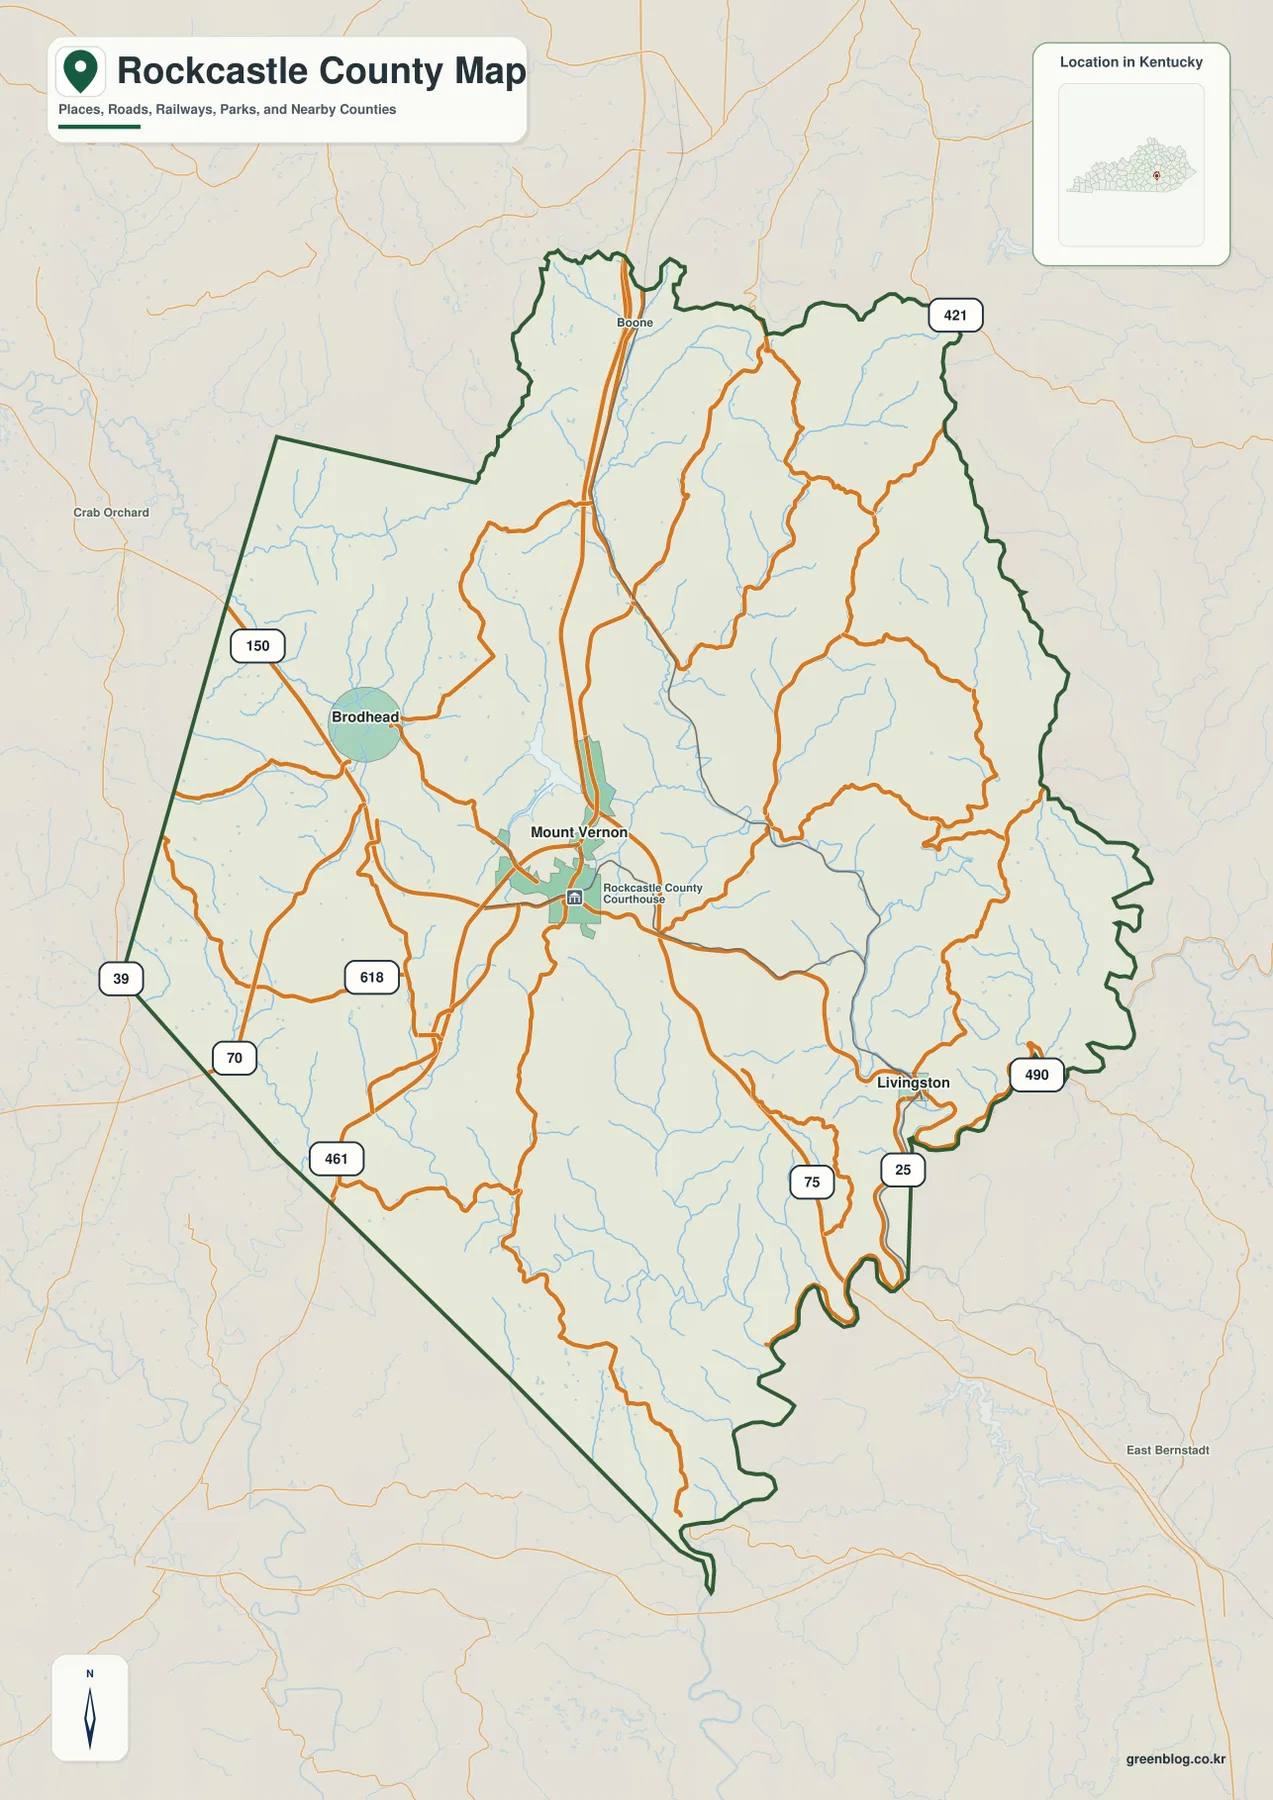
The outline also changes character around the county. Long straight segments are visible along parts of the west and southwest, while the eastern and southeastern boundary is much more irregular. Neighboring labels on the map include Pulaski, Laurel, Madison, Garrard, Jackson, and Lincoln counties, which helps place Rockcastle County between central Kentucky routes and the more dissected terrain to the east.
Mount Vernon, Brodhead, and Livingston occupy very different parts of the map
The city map strips away much of the detail and focuses on the three principal towns. Mount Vernon is the hub, Brodhead is about 5 miles away by straight-line distance to the west, and Livingston is about 8 miles to the southeast. Those figures are useful for scale, although driving distance will be longer because actual roads bend with valleys and terrain.
Brodhead sits near KY 150 and the western side of the county, where the road network spreads toward the Pulaski County side. Livingston is in a narrower southeastern setting near U.S. 25 and KY 490, close to a deeply indented section of the county boundary. Looking at these two towns from Mount Vernon makes the county feel less like a single corridor and more like three connected local areas with different surroundings.
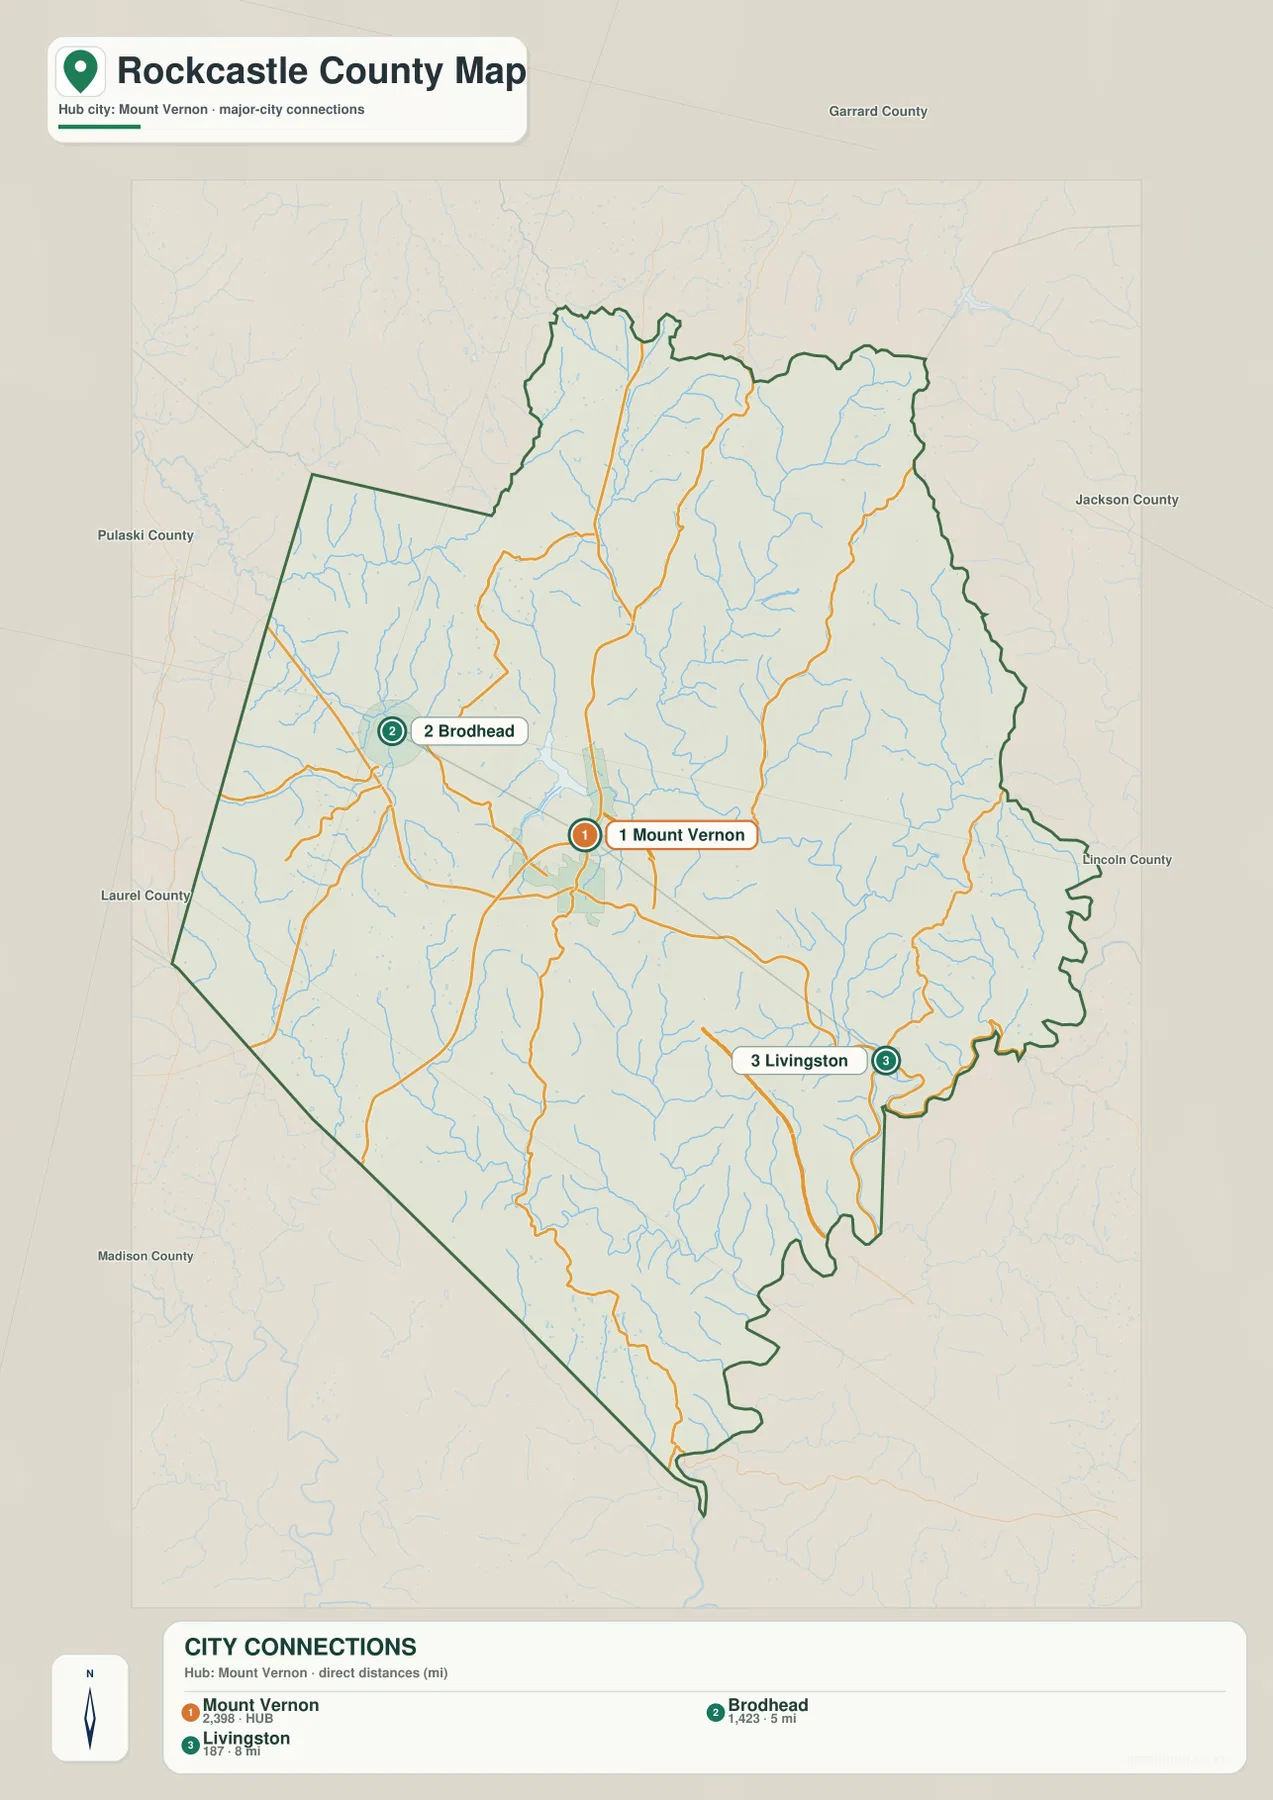
The county names printed around the frame add another layer of orientation. Garrard, Jackson, Lincoln, Pulaski, Laurel, and Madison counties are all labeled outside Rockcastle County, giving the city view a broader regional frame. For exact boundary relationships, the general county map is the better reference because the city map is designed primarily to keep the three town labels clear.
Waterways link Lake Linville with a dense network of creek valleys
The terrain and water map gives Lake Linville a clear position near the Mount Vernon area and labels numerous streams across the county. Dix River and Copper Creek appear in the west, Renfro Creek runs north of the lake area, and Clear Creek, Brush Creek, Roundstone Creek, and Crooked Creek occupy the central and eastern side. Farther south, Brushy Creek, West Fork Skaggs Creek, East Fork Skaggs Creek, and Skeggs Creek show how many smaller drainage lines cut through the landscape.
The Rockcastle River is the dominant named river on the southeast side. Its course bends along a rugged valley near the county edge, while Roundstone Creek and other eastern streams feed through a closely folded pattern of ridges. This map is especially useful because shaded relief sits underneath the blue water network, allowing the creek valleys to be read as physical features rather than isolated lines.
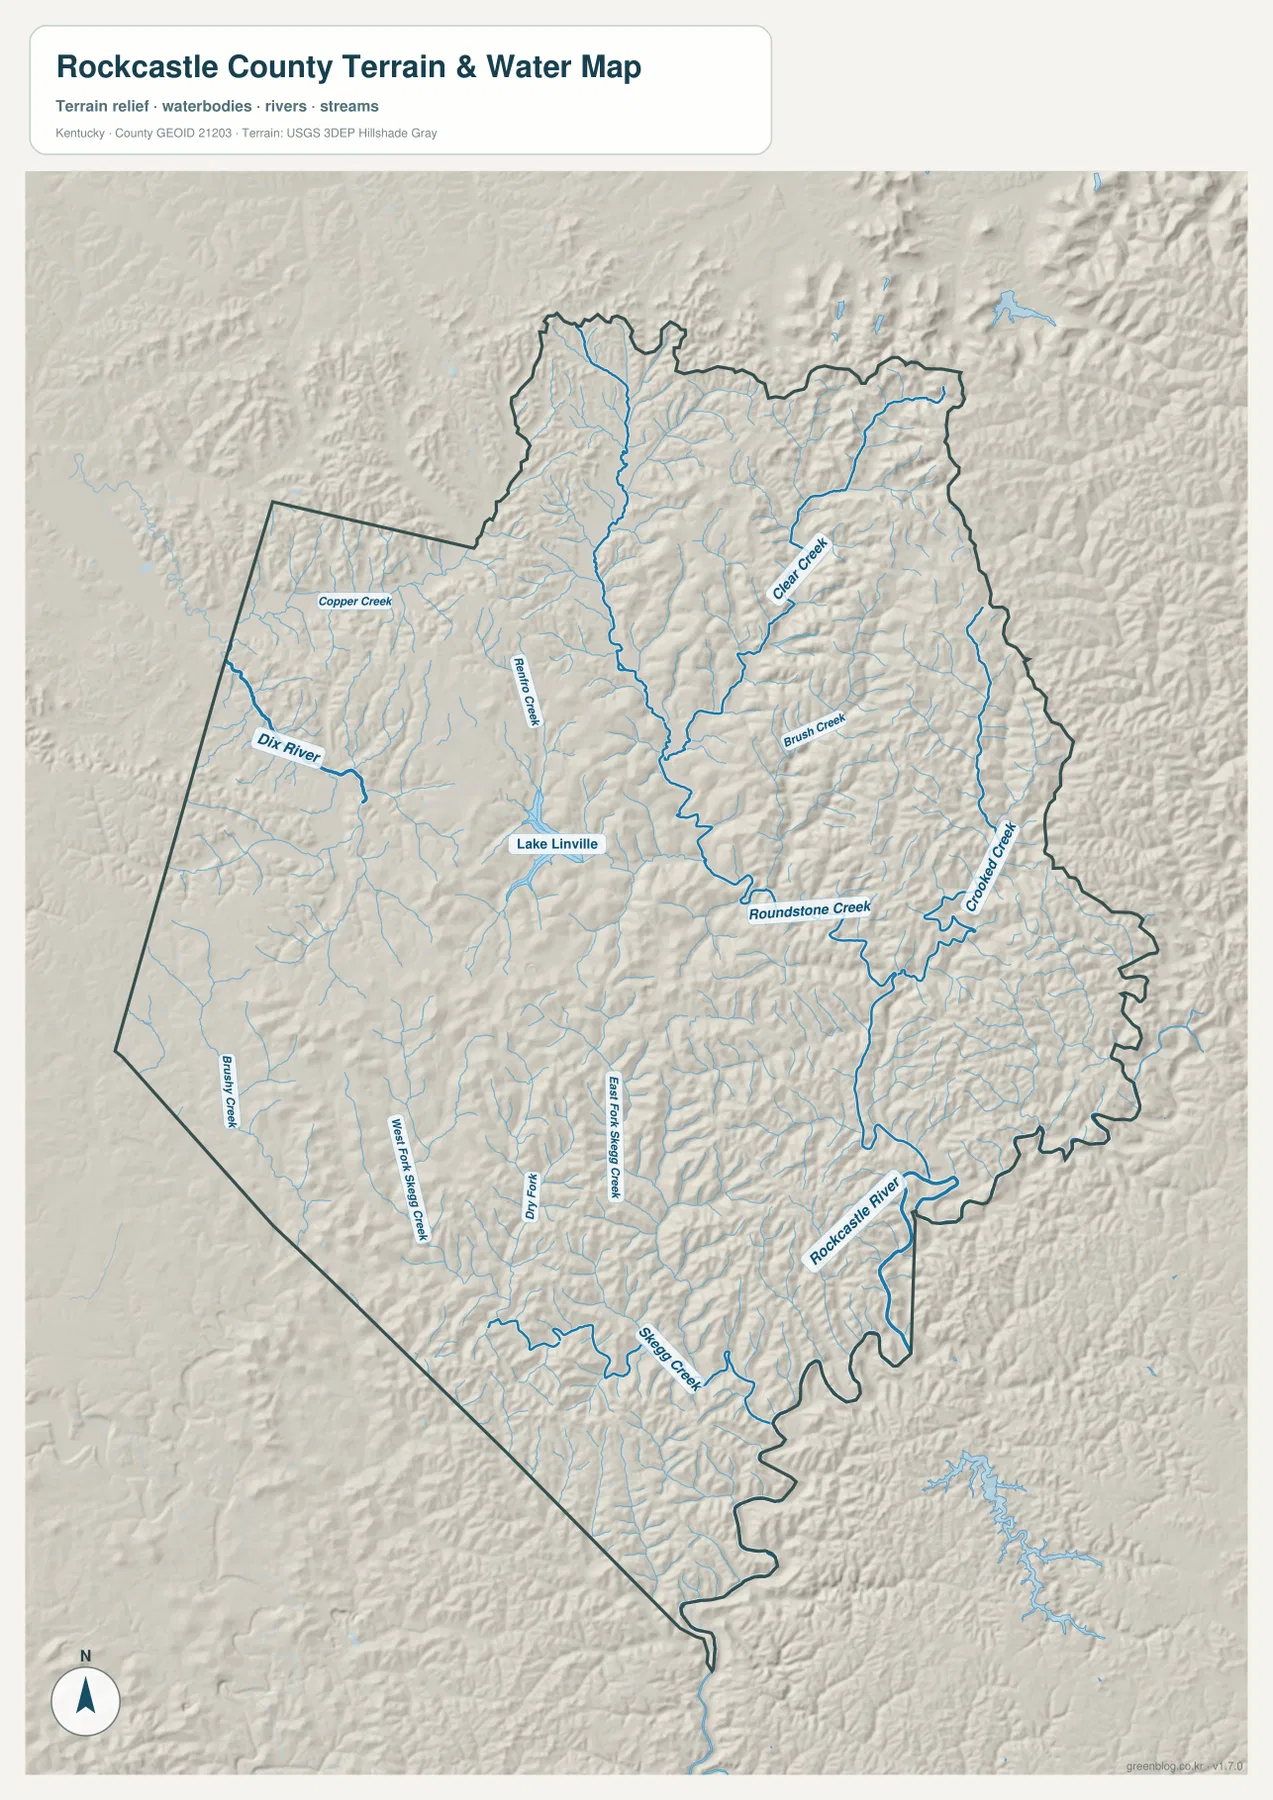
At county scale, the water map is best treated as a geographic reference rather than a flood, property, or engineering document. It can show which valleys connect and where major named streams lie, but a site-specific drainage decision requires more detailed official information. For trip planning, classroom use, and a general understanding of the county, however, the combination of relief and hydrography makes this one of the most informative views in the set.
Elevation makes the eastern ridge country stand out
The elevation map spans roughly 246 to 500 meters, with a mean value near 354 meters. Lower greens concentrate in valley bottoms and several western and central corridors, while tan and brown colors become much more common across the northeast and east. The result is a clear visual contrast: the I-75 and Mount Vernon area sits among broader low corridors, whereas the eastern half is broken into many narrow ridges and hollows.
The southeast near Livingston is also strongly dissected. Instead of a broad flat surface, elongated ridges repeat from one creek valley to the next, and the county boundary follows a complicated edge through this terrain. The western side is not flat, but its relief is generally less tightly packed than the ridge fields visible east of the main interstate corridor.
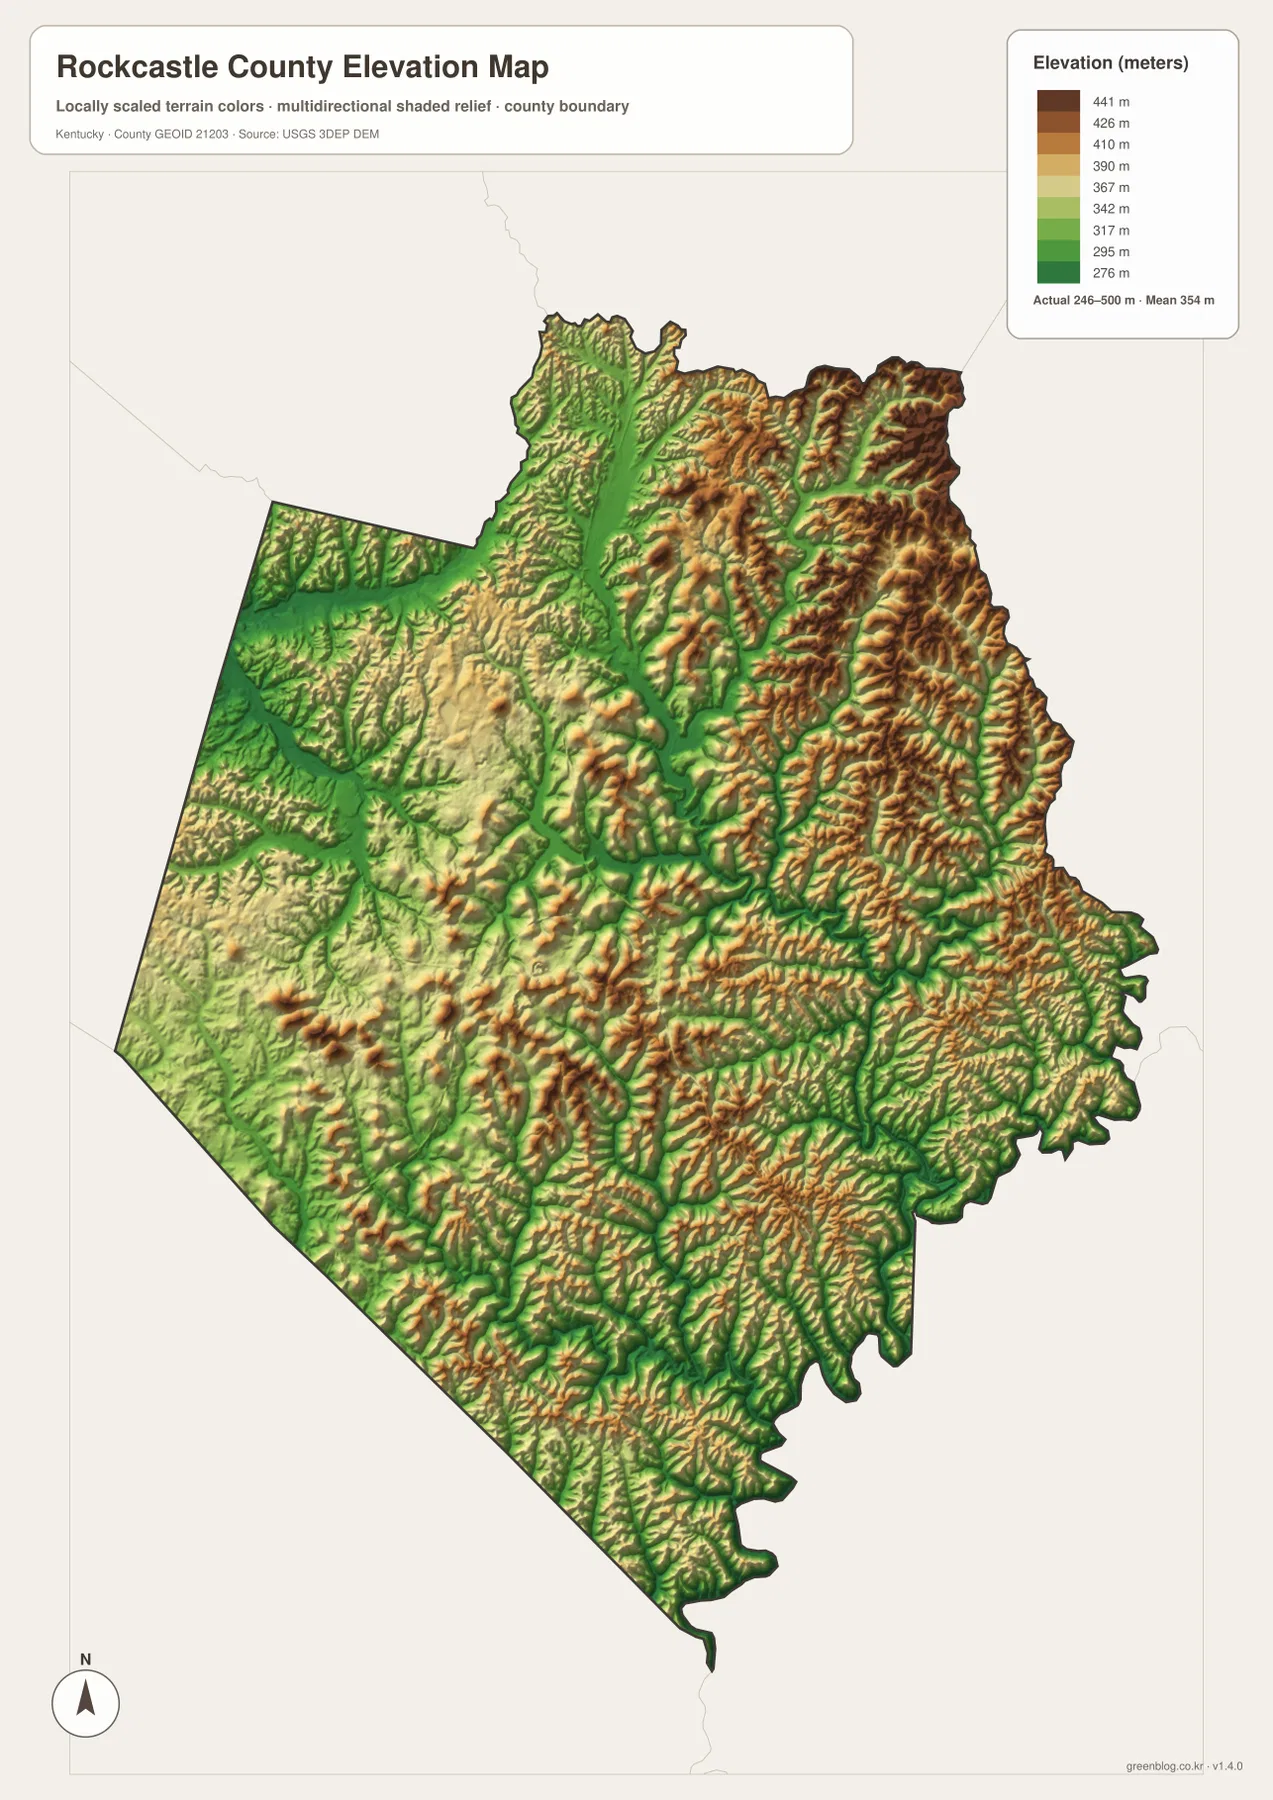
These colors are intended for relative comparison across the county. They do not provide a survey elevation for a house, road cut, building site, or trail point. Anyone who needs precise heights, slopes, or construction-grade terrain should consult source elevation data or a professional survey. For regional interpretation, the map is useful for seeing where steep relief is concentrated and why some transportation routes favor particular valleys.
Roads make more sense when the valleys are visible
Comparing the general map with the terrain layers explains several road patterns that can look arbitrary on a simple highway view. The I-75 corridor follows a relatively broad north-south passage through the county, while many smaller routes bend around hills or stay within creek valleys. U.S. 25 toward Livingston is a good example: the route enters a more confined landscape as it moves southeast, where the ridge pattern becomes tighter and the boundary becomes more irregular.
The same comparison also helps with local landmarks. Lake Linville can be connected quickly to the Mount Vernon area, while Roundstone Creek and the Rockcastle River make more sense when viewed against the eastern ridge network. Rather than treating roads, water, and elevation as separate subjects, the maps reveal why settlements and transportation tend to occupy the more accessible parts of a county with substantial local relief.
Choose the map that matches the question
Use the general county map when you need road numbers, towns, the full outline, and the broad transportation network at the same time. The city map is better for a clean comparison of Mount Vernon, Brodhead, and Livingston. The terrain and water map is the clearest choice for named streams and valley relationships, while the elevation map is best for comparing low corridors with higher ridge country.
- General county map: best for I-75, U.S. 25, KY 150, town locations, and the full county boundary.
- City map: useful when the main goal is to compare Mount Vernon, Brodhead, and Livingston without dense labeling.
- Terrain and water map: best for Lake Linville, Dix River, Roundstone Creek, Rockcastle River, and the smaller drainage network.
- Elevation map: useful for comparing the roughly 246–500 meter range and the concentration of ridges in the east.
For a travel or local-reference page, the general and city maps usually make the fastest pair. For physical geography, the water and elevation maps are more informative because they remove much of the road clutter. Moving between two views is often clearer than trying to read every feature from a single crowded map.
Use the full-resolution JPG files for printing and close inspection
The WebP images in the article are reduced for convenient viewing. The downloadable ZIP contains four JPG files at 2572 × 3638 pixels, which provides more room for small road shields, stream labels, and relief details. The portrait dimensions are well suited to A3-style printing, although printer margins and scaling should be checked before producing a final copy.
These maps are intended for general geographic reference, education, trip planning, and visual comparison. They should not replace official parcel maps, legal boundary records, engineering plans, or current transportation notices. If a decision depends on an exact location or measurement, use the linked government data resources or the appropriate local authority in addition to the map image.
Frequently Asked Questions
Which map is best for comparing Mount Vernon, Brodhead, and Livingston?
Use the city map for the cleanest comparison. It places Mount Vernon at the hub, Brodhead to the west, and Livingston to the southeast, and it includes approximate straight-line distances from Mount Vernon. Switch to the general county map when you also need numbered roads and the full route network.
Can I see Lake Linville and the Rockcastle River on the same map?
Yes. The terrain and water map shows Lake Linville near the Mount Vernon area and the Rockcastle River along the southeastern side of the county. It also labels Dix River, Renfro Creek, Clear Creek, Brush Creek, Roundstone Creek, Crooked Creek, and several smaller streams.
Can the 246–500 meter elevation range be used for engineering or site measurements?
No. The elevation map is a county-scale visualization for comparing valleys and ridges. Precise site elevations, grades, drainage design, construction, or surveying require higher-resolution source data and professional measurements.
Sources and reference information
The map content and regional context can be checked against the following local and federal resources. Because agency pages and datasets can change, use the current version of each source when an exact boundary, road status, water feature, or elevation value matters.
- Mount Vernon–Rockcastle County Tourism — Local information about attractions, Lake Linville, the Rockcastle River, and the Mount Vernon area.
- Kentucky.gov Rockcastle County Agency Profile — State reference information for Rockcastle County and its communities.
- U.S. Census Bureau TIGER/Line Shapefiles — Official U.S. geographic boundary and transportation data resources.
- USGS National Hydrography — Federal reference data for rivers, streams, lakes, and related hydrographic features.
- USGS 3D Elevation Program — Official U.S. elevation and terrain data resources.
Map File Information
The ZIP contains the high-resolution JPG versions of the Rockcastle County general map, city map, terrain and water map, and elevation map. Review the web previews first, then choose the file that fits your printing, reference, or presentation needs.
- Printable Size: 2572 × 3638 pixels each
- File Type: ZIP containing 4 JPG files
Related Maps
Green Map creates custom-edited map images using open geographic data sources such as geoBoundaries, Natural Earth, OpenStreetMap, and government open data. These maps are edited visual materials, not raw data files, and are provided for education, documents, presentations, and graphic reference.