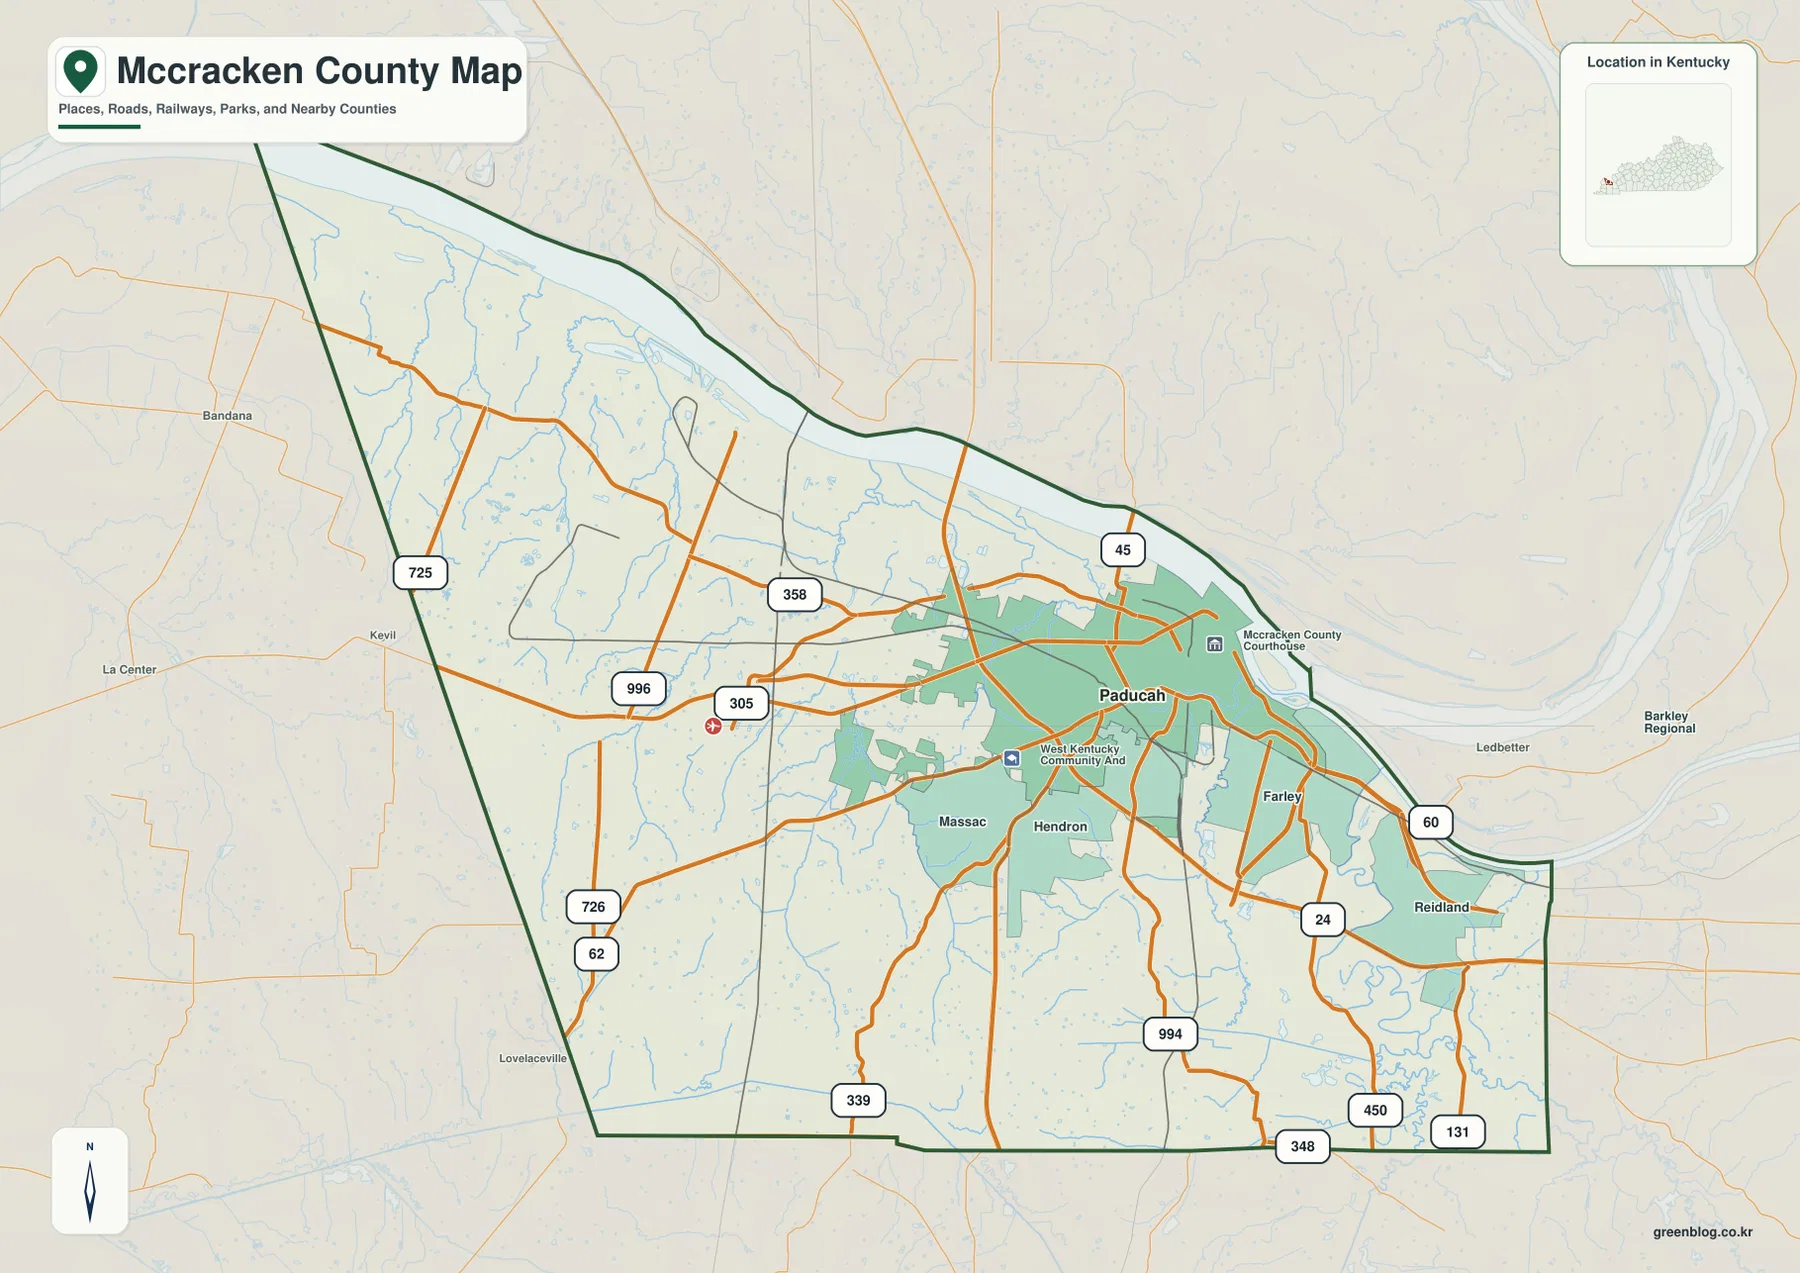
McCracken County occupies the far western side of Kentucky with Paducah concentrated near the broad river lowlands in the northeast. The Ohio River forms the long northern edge, and the Tennessee River approaches from the east before meeting the larger river near the Paducah area. The general map also shows Farley, Reidland, Massac, and Hendron together with routes 24, 45, 60, 62, and numerous local roads. The physical maps add Clarks River branches, smaller creeks, lakes, and an elevation surface that changes from low river ground to higher hills in the southwest and south-central county. High-resolution JPG versions of all supplied maps can be downloaded together in one ZIP archive. High-resolution map files are available for download in the section below.
Paducah is the only ranked major city on the city-distribution map, and the official McCracken County government is also based in Paducah. That concentration makes the county different from places where several towns divide the map more evenly. Much of the north and east is shaped by the Ohio and Tennessee river corridors, while the west and south contain smaller streams, rural roads, and more pronounced relief. Following those contrasts from the city outward is the easiest way to understand the county.
Table of Contents
Paducah anchors a road network that spreads into the county suburbs
Paducah is the strongest landmark on the general county map. Route 45 approaches from the north, route 60 continues toward Reidland and the eastern side, and Interstate 24 forms a major connection southeast of the city. West and southwest of the urban area, routes 358, 305, and 996 serve the Massac and Hendron side. The concentration of numbered roads around Paducah makes its role as the county’s transportation center immediately visible.
Farley and Reidland provide useful references east and southeast of Paducah. Farley lies between the main city and the Tennessee River corridor, while Reidland sits near route 60 and the southeastern drainage network. Massac and Hendron mark the outer edge of the developed area to the south and southwest. Beyond those communities, routes 994, 450, 348, and 131 cross a more rural landscape of creeks and rolling ground.
The western half includes routes 725, 726, and 62, with Kevil and Lovelaceville shown just outside the county as orientation points. Compared with the Paducah side, this area has fewer dense urban streets and more small waterways crossing rural roads. The county map therefore captures a clear transition from an urban river city to agricultural and creek-cut country within a relatively short distance.
The McCracken County Courthouse and West Kentucky Community And Technical marker appear in the Paducah area and help confirm the central urban zone. The map is a reference product rather than a live traffic service, so construction, temporary closures, and current travel times should be checked with up-to-date transportation sources before driving.
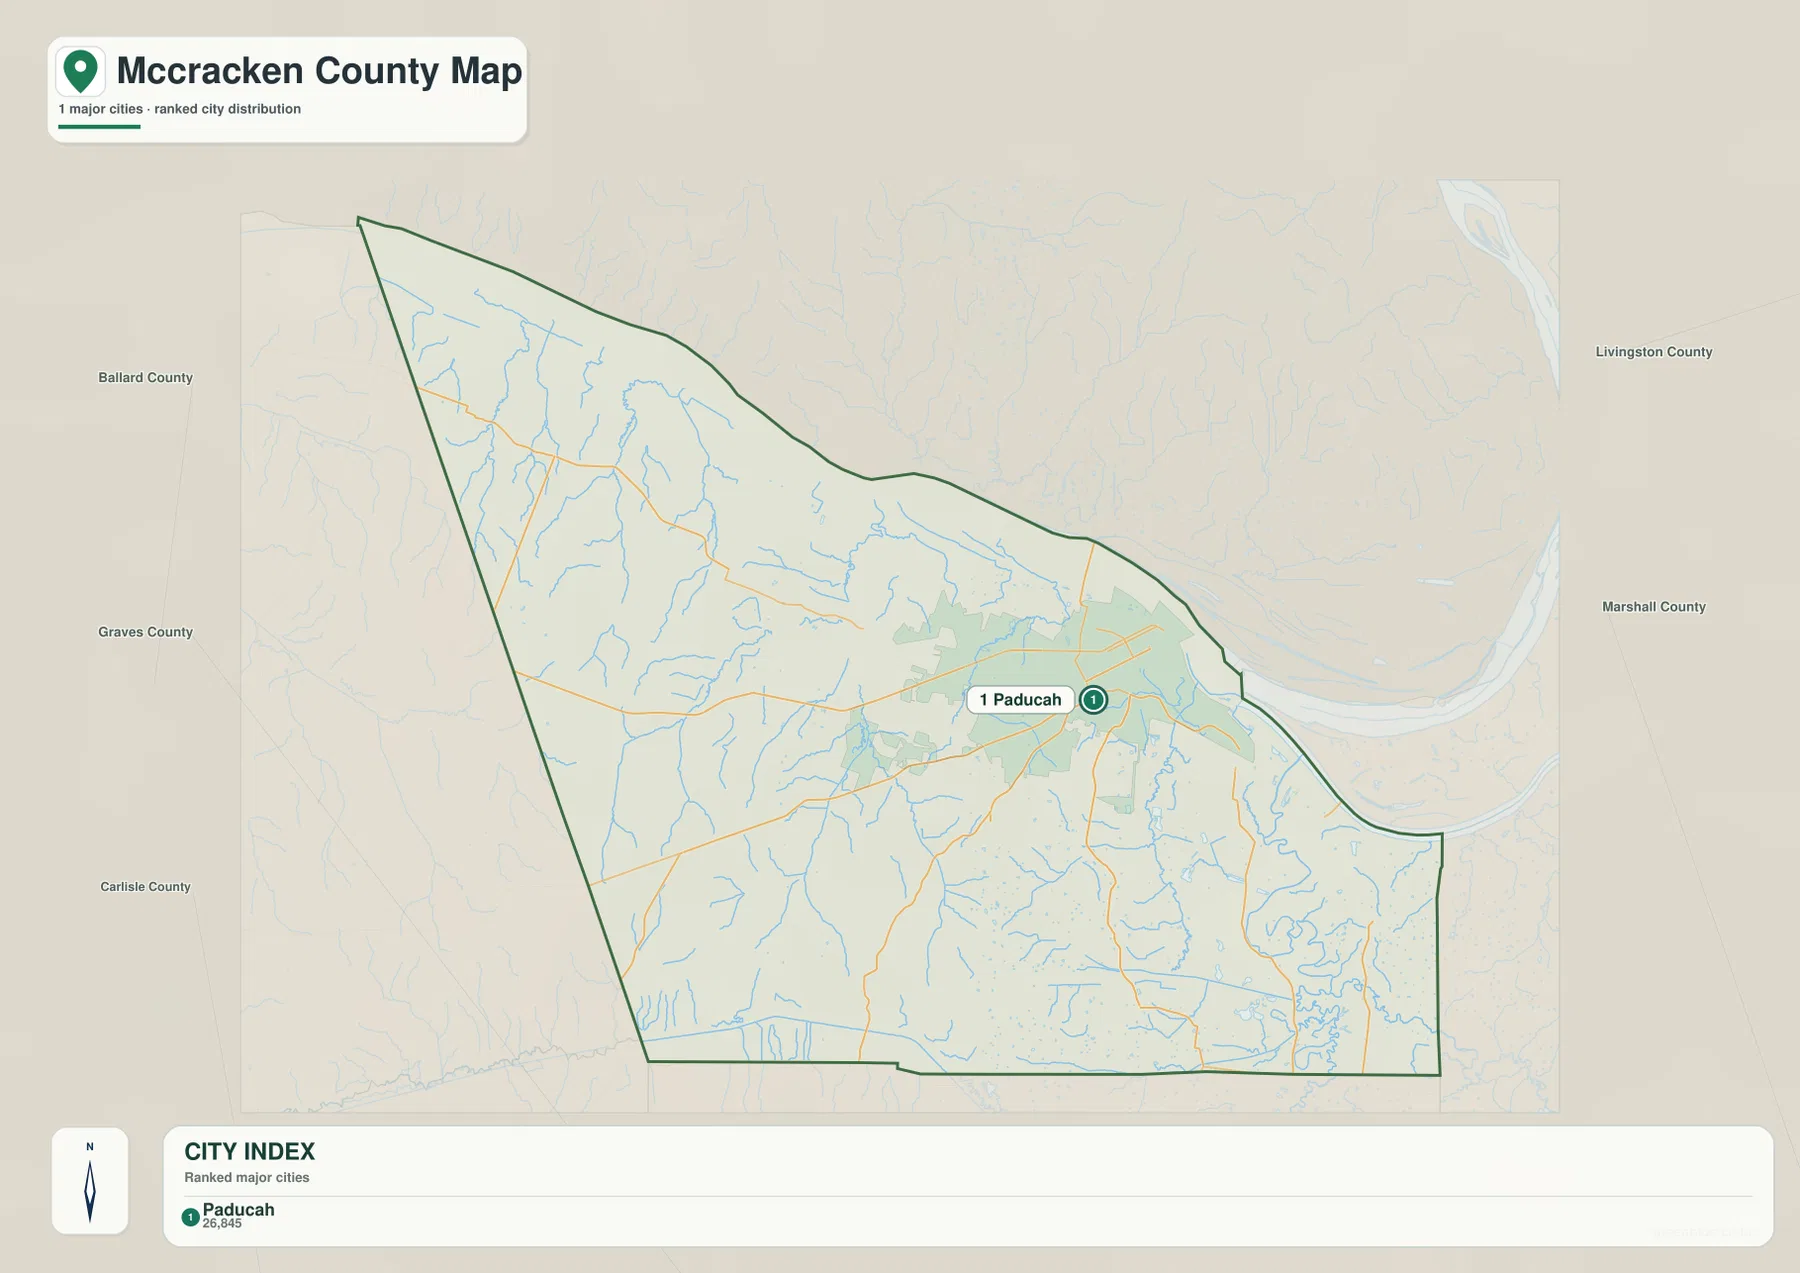
A single major city concentrates the county’s urban footprint in Paducah
The city-distribution map ranks only Paducah as a major city and labels its population as 26,845. The urban area occupies the northeastern part of McCracken County rather than the geographic middle. Western and southern sections do not contain another city marker of the same rank, which makes the county appear strongly oriented toward the river city rather than divided among several comparable urban centers.
Paducah’s location close to both the Ohio and Tennessee river corridors helps explain that concentration. Roads and development spread south and west from the city, but the county becomes increasingly rural away from the northeastern corner. On the physical maps, those outer areas are defined more by creeks, low valleys, and rolling hills than by large settlement labels.
Neighboring county labels provide useful regional orientation. Ballard County lies to the west, Graves and Carlisle counties to the southwest and south, and Marshall and Livingston counties to the east. McCracken County therefore sits at the meeting point between western Kentucky’s large river system and the inland counties farther south and east.
The absence of another ranked city does not mean the rest of the county lacks settlements. Farley, Reidland, Massac, and Hendron are visible on the general map, along with many local roads. The city map is intentionally simplified so Paducah’s dominance is clear; the general map is the better choice for finer local detail.
Ohio River and Tennessee River frame a dense network of creeks and lakes
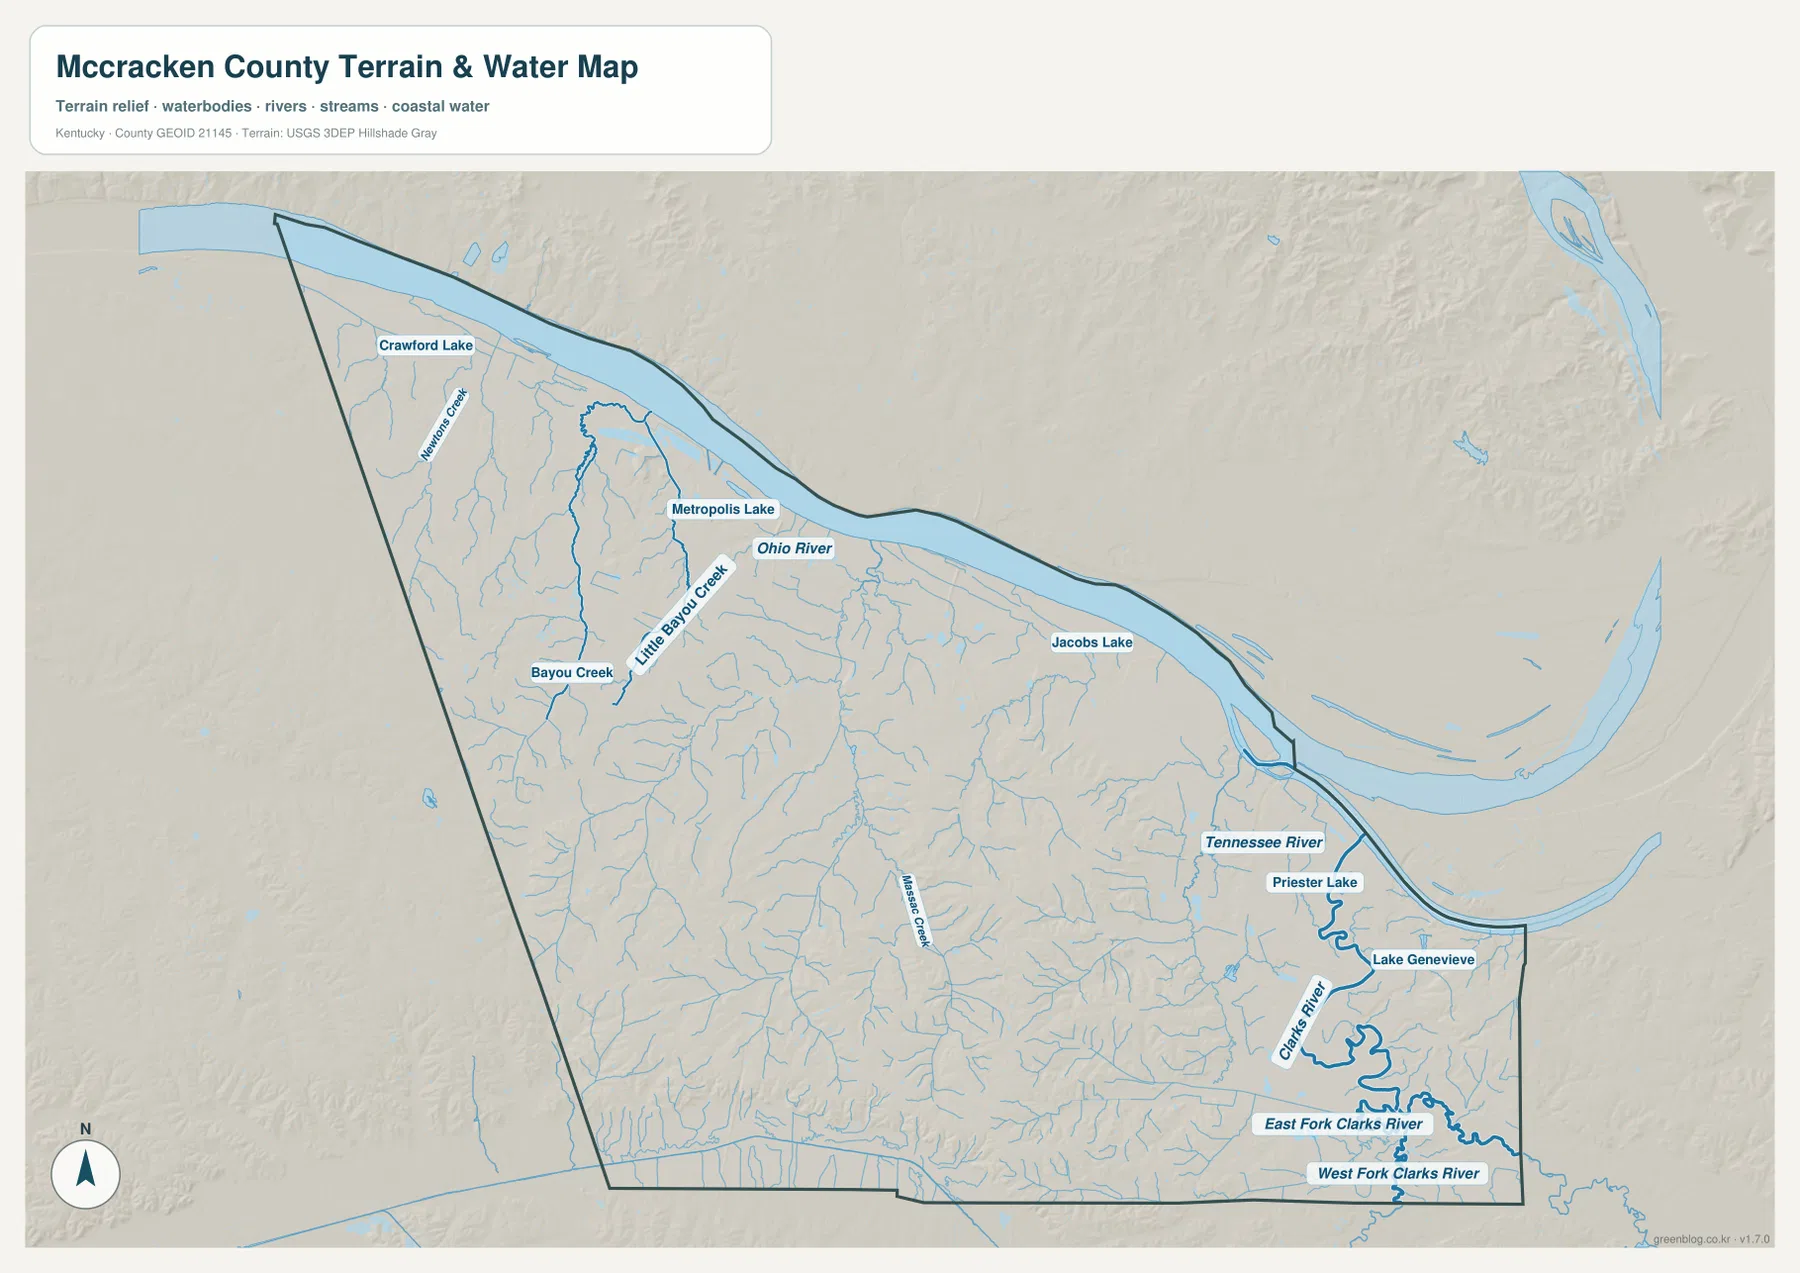
The terrain-and-water map is dominated by the Ohio River along the northern boundary and the Tennessee River along the eastern side. The Tennessee River approaches the Ohio near Paducah, creating a broad lowland environment around the northeastern county. Smaller streams drain toward those large rivers from the interior, so the river edges are connected to a dense network of narrow blue tributaries.
In the northwest, Massac Creek, Bayou Creek, and Little Bayou Creek are important named references. Crawford Lake and Metropolis Lake provide small water landmarks close to the northern river corridor. Farther east, Jacobs Lake sits near the Ohio River side. These features help organize the many smaller tributaries that would otherwise be difficult to distinguish on the shaded-relief map.
The southeastern county is organized around Clarks River and its East Fork and West Fork. Priester Lake and Lake Genevieve are also labeled in that area. The river forks occupy broad low corridors that match the green terrain on the elevation map, creating a very different setting from the higher rolling hills in the southwest and south-central parts of McCracken County.
A practical reading order is to locate the Ohio River and Tennessee River first, then compare the northwestern Bayou and Massac creeks with the southeastern Clarks River system. The map is not intended for current flood stages, navigation, water depth, fishing rules, or private-access decisions. Those questions require current information from the responsible agencies.
Elevation from 88 to 152 meters separates river lowlands from the southwestern hills
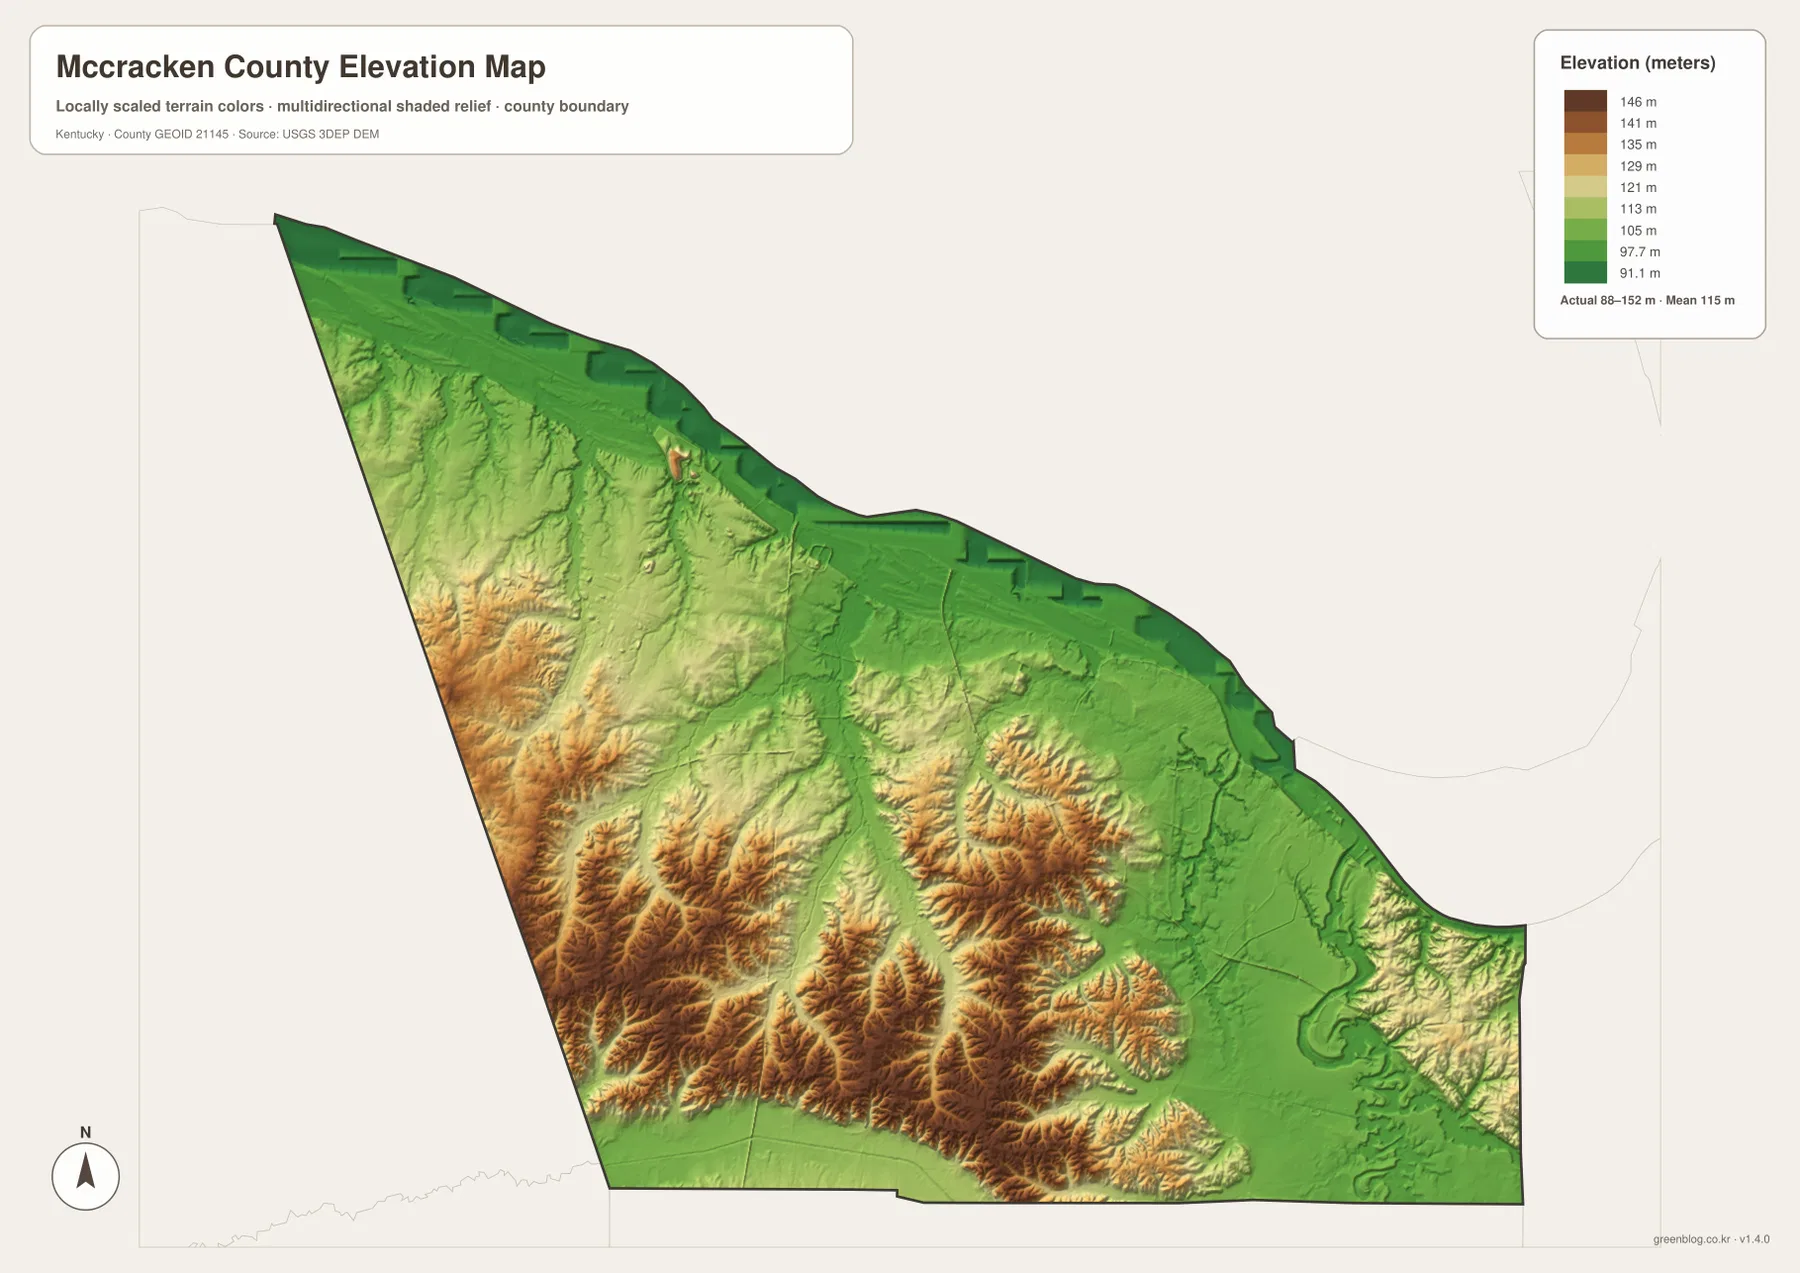
The elevation map reports an actual county range of about 88 to 152 meters and a mean near 115 meters. The darkest green lowlands follow the Ohio River across the north and continue along the Tennessee River and Clarks River side in the east and southeast. Higher yellow, orange, and brown terrain is concentrated farther inland, especially across the southwest and south-central parts of the county.
The western and southwestern hills are not a single flat upland. Narrow creek valleys cut repeatedly into the higher ground, leaving ridge-like areas between them. This pattern adds context to the winding rural roads visible around routes 725, 726, and 62. Roads tend to use lower corridors and gentler crossings rather than following a rigid straight grid across the relief.
Paducah and the northeastern river corridor are noticeably lower and flatter than the southwestern interior. Broad green areas surround the Ohio and Tennessee rivers, and the southeastern Clarks River system also occupies low terrain. Moving west and south from the city introduces more relief, even though the county’s total elevation range is modest compared with eastern Kentucky mountain counties.
The elevation surface is intended for county-scale comparison rather than parcel-level measurement. It clearly distinguishes major lowlands and higher rolling terrain, but it should not be treated as survey-grade elevation for a road, property, structure, or engineering project. Exact site work should use current source elevation data or professional field measurements.
Following McCracken County from Paducah into the western hills and Clarks River country
Paducah is the simplest starting point for comparing all of the maps. Locate routes 45, 60, and 24 on the general map, then move to the water map and find the Ohio and Tennessee rivers. On the elevation view, the same northeastern area appears as a broad green lowland. That sequence quickly establishes why the largest urban area sits where it does.
For the west and southwest, use routes 358, 305, 996, 725, and 62 together with Massac and Hendron. Massac Creek and Bayou Creek provide the nearby water references, while the elevation map shows increasingly higher terrain toward the southwest. This contrast is noticeable only a few miles from Paducah’s flatter river-side environment.
For the southeast, use Reidland and routes 24 and 60 before locating Clarks River, East Fork Clarks River, and West Fork Clarks River. Priester Lake and Lake Genevieve provide additional anchors. Following those same places on the elevation map shows how the river network occupies the lowest terrain along the county’s eastern and southeastern side.
Choosing the best McCracken County map for print, class, or local reference
Use the general county map when Paducah, suburban communities, numbered roads, and the complete boundary need to be visible together. The city-distribution map is cleaner when the main point is that Paducah is the county’s single ranked major city and that the urban footprint is concentrated in the northeastern corner.
Choose the terrain-and-water map for the Ohio River, Tennessee River, Clarks River forks, Bayou Creek, Massac Creek, and the named lakes. The elevation map is the strongest view for explaining the difference between the low river corridors and the higher southwestern interior. Showing the water and elevation maps together makes that relationship especially easy to see.
The WebP images in the article are optimized for browser viewing. The downloadable ZIP contains the original JPG maps at 3,638×2,572 pixels each, which is better suited to printing, classroom worksheets, presentations, and offline reference. These maps are general geographic resources rather than legal boundary records, flood studies, navigation charts, parcel surveys, or engineering plans.
Frequently Asked Questions
Why does Paducah appear concentrated on one side of McCracken County?
Paducah sits in the northeastern part of the county near the broad Ohio and Tennessee river lowlands. Development spreads outward from that river-side location, while the western and southern sections are more rural and contain more creeks and rolling terrain. The city-distribution map therefore places the county’s main urban concentration close to the river edge rather than the geographic center.
Which map best shows the Ohio River and the Clarks River system together?
The terrain-and-water map is the best choice. It shows the Ohio River, Tennessee River, Clarks River, East Fork Clarks River, West Fork Clarks River, Bayou Creek, Massac Creek, and several named lakes in one view.
Can the 88–152 meter elevation range be used as an exact property elevation?
No. The range summarizes the actual countywide elevations shown on the supplied map, with a mean near 115 meters. It is useful for comparing low river corridors with higher southwestern hills, but exact site elevations should come from current source data or professional surveying.
Map File Information
The ZIP archive contains the original high-resolution JPG versions of the McCracken County road-and-boundary map, city-distribution map, terrain-and-water map, and elevation map. Each image is 3,638×2,572 pixels for printing, classroom work, presentations, and offline reference.
- File Type: 4 JPG files inside one ZIP archive
Related Maps
Sources and references
County government information is available from the official McCracken County government website and the Kentucky.gov McCracken County profile. For underlying geographic data, see the U.S. Census Bureau TIGER/Line Shapefiles for boundaries and roads, USGS National Hydrography for rivers, creeks, and lakes, and the USGS 3D Elevation Program for elevation data.
These maps are intended for geographic explanation, printing, and general reference. Legal boundary decisions, live traffic, flood and water-safety questions, property surveying, and engineering work should rely on the latest authoritative information from the responsible public agency.
Green Map creates custom-edited map images using open geographic data sources such as geoBoundaries, Natural Earth, OpenStreetMap, and government open data. These maps are edited visual materials, not raw data files, and are provided for education, documents, presentations, and graphic reference.