Comparing private health spending across countries is difficult when ordinary exchange rates are used, because the same number of U.S. dollars can buy very different amounts of health care in different price environments. The World Bank indicator SH.XPD.PVTD.PP.CD addresses part of that problem by expressing domestic private health expenditure per person in current international dollars using purchasing power parity, or PPP. It is designed to compare the purchasing-power-adjusted scale of health spending financed from domestic private sources rather than the nominal foreign-exchange value of that spending.
The dataset used here contains the latest non-empty observation for 193 economies. The observation years span 2021 to 2024, but the distribution is unusually concentrated: 185 observations are from 2023, seven are from 2024, and only one is from 2021. This means the global pattern is largely a 2023 picture even though the correct label is still “latest available value,” not a synchronized 2023 or 2024 ranking.
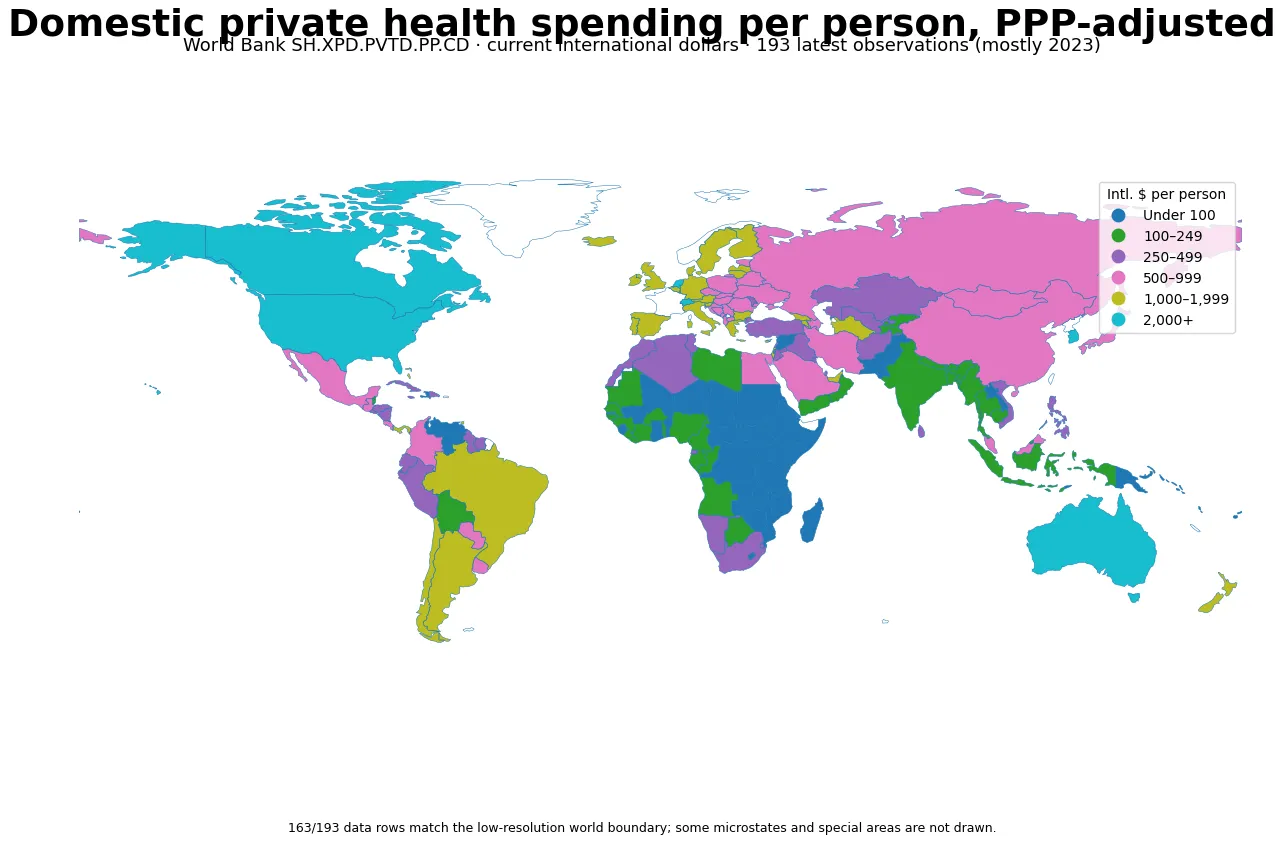
Table of Contents
Why PPP adjustment matters
Purchasing power parity converts monetary values into a common unit intended to reflect differences in domestic price levels. A market-exchange-rate dollar does not purchase the same amount of labor, clinical services, rent, or other locally provided inputs everywhere. PPP adjustment is therefore useful when the goal is to compare the real purchasing power embodied in health expenditure rather than the foreign-currency amount produced by an exchange-rate conversion.
An international dollar is a comparison unit, not a currency that households literally pay at the point of care. The indicator also covers domestic private sources more broadly than direct cash payments by patients. Depending on the financing system, private insurance and other domestic private financing can be part of the total. A value of 2,000 international dollars per person should therefore be interpreted as the PPP-adjusted scale of privately financed health expenditure, not as a statement that the average resident personally paid US$2,000 in cash.
The median latest value is about 383 international dollars
Across the 193 latest observations, the median is 382.87 international dollars per person and the mean is 650.15. The first quartile is 118.05 and the third quartile is 866.65. The mean sits far above the median because a small number of economies have exceptionally high values. Switzerland and the United States exceed 6,000 international dollars per person, stretching the upper tail of the distribution.
- Median: 382.87 international dollars per person
- Mean: 650.15
- 25th percentile: 118.05
- 75th percentile: 866.65
- Minimum: 1.03
- Maximum: 7,094.54
Forty-five economies are at or above 1,000 international dollars per person, and nine are at or above 2,000. At the other end, 44 are below 100. The indicator therefore spans a very wide range. Income, health-care prices, insurance arrangements, the public-private financing mix, and the quantity of services used can all influence the observed amount, but the indicator by itself cannot identify which factor is responsible for any particular country’s position.
Switzerland and the United States stand well above the rest
| Economy | Observation year | Intl. $ per person |
|---|---|---|
| Switzerland | 2023 | 7,094.54 |
| United States | 2023 | 6,203.90 |
| Liechtenstein | 2023 | 3,032.12 |
| Singapore | 2023 | 2,721.36 |
| Netherlands | 2023 | 2,443.39 |
| Canada | 2024 | 2,279.06 |
| Korea, Rep. | 2024 | 2,205.04 |
| France | 2024 | 2,168.47 |
| Australia | 2023 | 2,025.70 |
| Belgium | 2023 | 1,972.12 |
Switzerland records the largest latest value in the extract at 7,094.54 international dollars per person, followed by the United States at 6,203.90. The third-highest value, Liechtenstein at 3,032.12, is less than half the U.S. figure. Canada and France appear among the highest observations with 2024 data, but the extra year of recency should not be treated as evidence of growth relative to countries whose latest value is from 2023. The table compares each economy’s latest reported level; it is not a growth-rate table.
A high value is not a score for health-system quality or efficiency. Private expenditure can be high because private insurance plays a large role, because health-care prices are high, because use is intensive, or because public financing covers a smaller share of total spending. Conversely, a lower private amount can coexist with substantial health resources when government or external financing plays a larger role. The indicator is a financing-level measure, not an outcome ranking.
What do the lowest values mean?
| Economy | Observation year | Intl. $ per person |
|---|---|---|
| Tuvalu | 2023 | 1.03 |
| Solomon Islands | 2023 | 4.93 |
| Papua New Guinea | 2023 | 11.38 |
| Vanuatu | 2023 | 16.19 |
| Somalia, Fed. Rep. | 2023 | 16.36 |
| Marshall Islands | 2023 | 17.64 |
| Sudan | 2023 | 17.79 |
| Madagascar | 2023 | 20.76 |
| Mozambique | 2023 | 22.58 |
| Zimbabwe | 2023 | 23.37 |
Several Pacific island economies and lower-income countries appear at the bottom of the distribution. Tuvalu’s latest value is 1.03 international dollars per person, the Solomon Islands 4.93, and Papua New Guinea 11.38. These low figures do not automatically mean that government financing is generous. Total health spending may also be low, access to services may be constrained, or external and public sources may account for a larger share of the resources that are available.
This is why an absolute private-spending amount should be paired with a financing-share indicator. Two economies can both record 30 international dollars of domestic private health expenditure per person while imposing very different pressures on households if private sources account for 10% of current health expenditure in one system and 70% in another. The level and the financing share answer different questions.
Only seven economies have a 2024 observation
The seven 2024 observations are Canada at 2,279.06 international dollars per person, Korea at 2,205.04, France at 2,168.47, Chile at 1,859.45, Denmark at 1,202.94, Luxembourg at 1,042.80, and Colombia at 531.45. Comparing those seven removes the one-year timing difference, but the group is too small to represent the global distribution. Using all 193 latest values provides much broader coverage while mixing 2023 with a small number of other years.
For that reason, describing the dataset as a “2024 world ranking” would be misleading. The clearest description is “latest available values, mostly from 2023.” The timing difference is modest compared with many international datasets, yet it still matters because health expenditure can change with inflation, financing reforms, insurance coverage, and service use.
How this differs from a market-exchange-rate dollar measure
Per-capita private health expenditure can also be expressed in current U.S. dollars at market exchange rates. That version is intuitive for cross-border monetary comparisons but can move sharply when exchange rates change. The PPP version is designed to reduce the effect of international price-level differences and focus more closely on domestic purchasing power. As a result, country ordering and the size of cross-country gaps can differ between the two measures.
An economy with relatively low domestic prices may look small in market-dollar terms but larger after PPP adjustment because each unit of local currency purchases more domestic services. In a high-price economy, PPP adjustment can narrow part of the nominal gap. PPP is generally the more useful lens for comparing how much health care a level of spending can potentially purchase domestically, while market-dollar figures remain useful for questions involving foreign currency or international financial flows.
Private spending should be read with total health expenditure and financing shares
A high private amount per person does not necessarily mean that households face excessive financial pressure. In a very high-spending health system, private expenditure can be large in absolute terms while representing a modest share of total financing. The reverse can also happen: a lower absolute amount may still be burdensome when incomes are low and households finance a large share of care directly. The measure becomes much more informative when it is combined with total health expenditure per person, the domestic private financing share, and out-of-pocket spending.
- Total health expenditure per person shows the overall resource level of the health system.
- Domestic private financing share shows how much of current health expenditure comes from private domestic sources.
- Out-of-pocket spending helps separate direct household payments from broader private financing such as insurance.
- Income and social-protection structures affect how burdensome the same spending amount may be for households.
- Observation year should always be checked, even in a latest-available dataset with relatively concentrated timing.
How to read the map
The map joins the 193 data rows to a low-resolution world boundary. 163 rows match directly, equal to about 84.5% of the data. Most unmatched cases are very small island economies, territories, or areas whose country identifiers do not have a one-to-one polygon in the boundary file. A blank area on the map must not be interpreted as zero private health expenditure.
The range is exceptionally wide, from 1.03 to 7,094.54 international dollars per person, so the map uses value bands rather than trying to make tiny differences visually precise. This makes the broad distribution easier to see but means the map should not be used as a substitute for exact values. In the 2,000-plus band, for example, Switzerland and the United States remain far above several other economies even though they share the same broad map category.
What this indicator can and cannot tell you
The indicator can show how large domestically financed private health expenditure is per resident after adjusting for purchasing power. It is useful for comparing financing scale and for identifying economies that deserve a closer look. It does not directly measure service quality, health outcomes, insurance protection, affordability, or the risk that medical costs will push households into poverty. It also does not distinguish whether high private spending reflects voluntary supplementary insurance or unavoidable direct payments for essential care.
The World Bank’s official indicator page for SH.XPD.PVTD.PP.CD provides the definition and country time series. For policy analysis, a multi-year series is preferable to a single latest value, and the private amount should be considered together with government spending, private financing shares, out-of-pocket spending, and total health expenditure.
Summary
PPP-adjusted domestic private health expenditure per person varies enormously across the 193 latest observations. The median is 382.87 international dollars, while Switzerland and the United States exceed 6,000 and 44 economies are below 100. Because 185 of 193 observations are from 2023, the global distribution is highly comparable in time, although seven 2024 observations and one 2021 observation remain in the latest-value dataset. The central point is that this measure compares the purchasing-power-adjusted level of private health financing per resident, not health-system quality or household burden by itself.
Frequently Asked Questions
What does PPP-adjusted private health expenditure per capita measure?
It measures domestic private health expenditure per person after adjusting for cross-country price differences using purchasing power parity. The unit is a current international dollar, a comparison unit rather than an actual payment currency.
Does a high value mean households face a heavier medical-cost burden?
Not necessarily. Domestic private financing can include private insurance as well as direct household payments. Affordability should be assessed with income, out-of-pocket spending, and financing-share indicators.
Are all 193 country observations from the same year?
No. There are 185 observations from 2023, seven from 2024, and one from 2021. The dataset is best described as latest available values, mostly from 2023.
Related Articles
Green Map creates custom-edited map images using open geographic data sources such as geoBoundaries, Natural Earth, OpenStreetMap, and government open data.
These maps are edited visual materials, not raw data files, and are provided for education, documents, presentations, and graphic reference.