The 2021 male mortality rate attributed to unintentional poisoning measures deaths from unintentional poisoning per 100,000 male population. It is a rate, not the total number of deaths and not a percentage of all men. Standardizing by the male population makes comparisons more meaningful across economies with very different population sizes.
The World Bank series SH.STA.POIS.P5.MA contains 2021 values for 185 economies, while 32 economies are source-missing. Among observed values, the median is 0.64 deaths per 100,000 male population and the mean is 1.00. The first quartile is 0.28 and the third quartile is 1.44. Moldova has the highest observation at 6.71, while Singapore has the lowest at 0.0002.
The indicator identifies the cause category as unintentional poisoning, but it does not tell us which specific substance or circumstance produced each country’s rate. The data used here do not separate pharmaceuticals, chemicals, workplace exposures, household incidents, or other detailed mechanisms. Explaining the country differences therefore requires more detailed cause-of-death evidence than this single indicator provides.
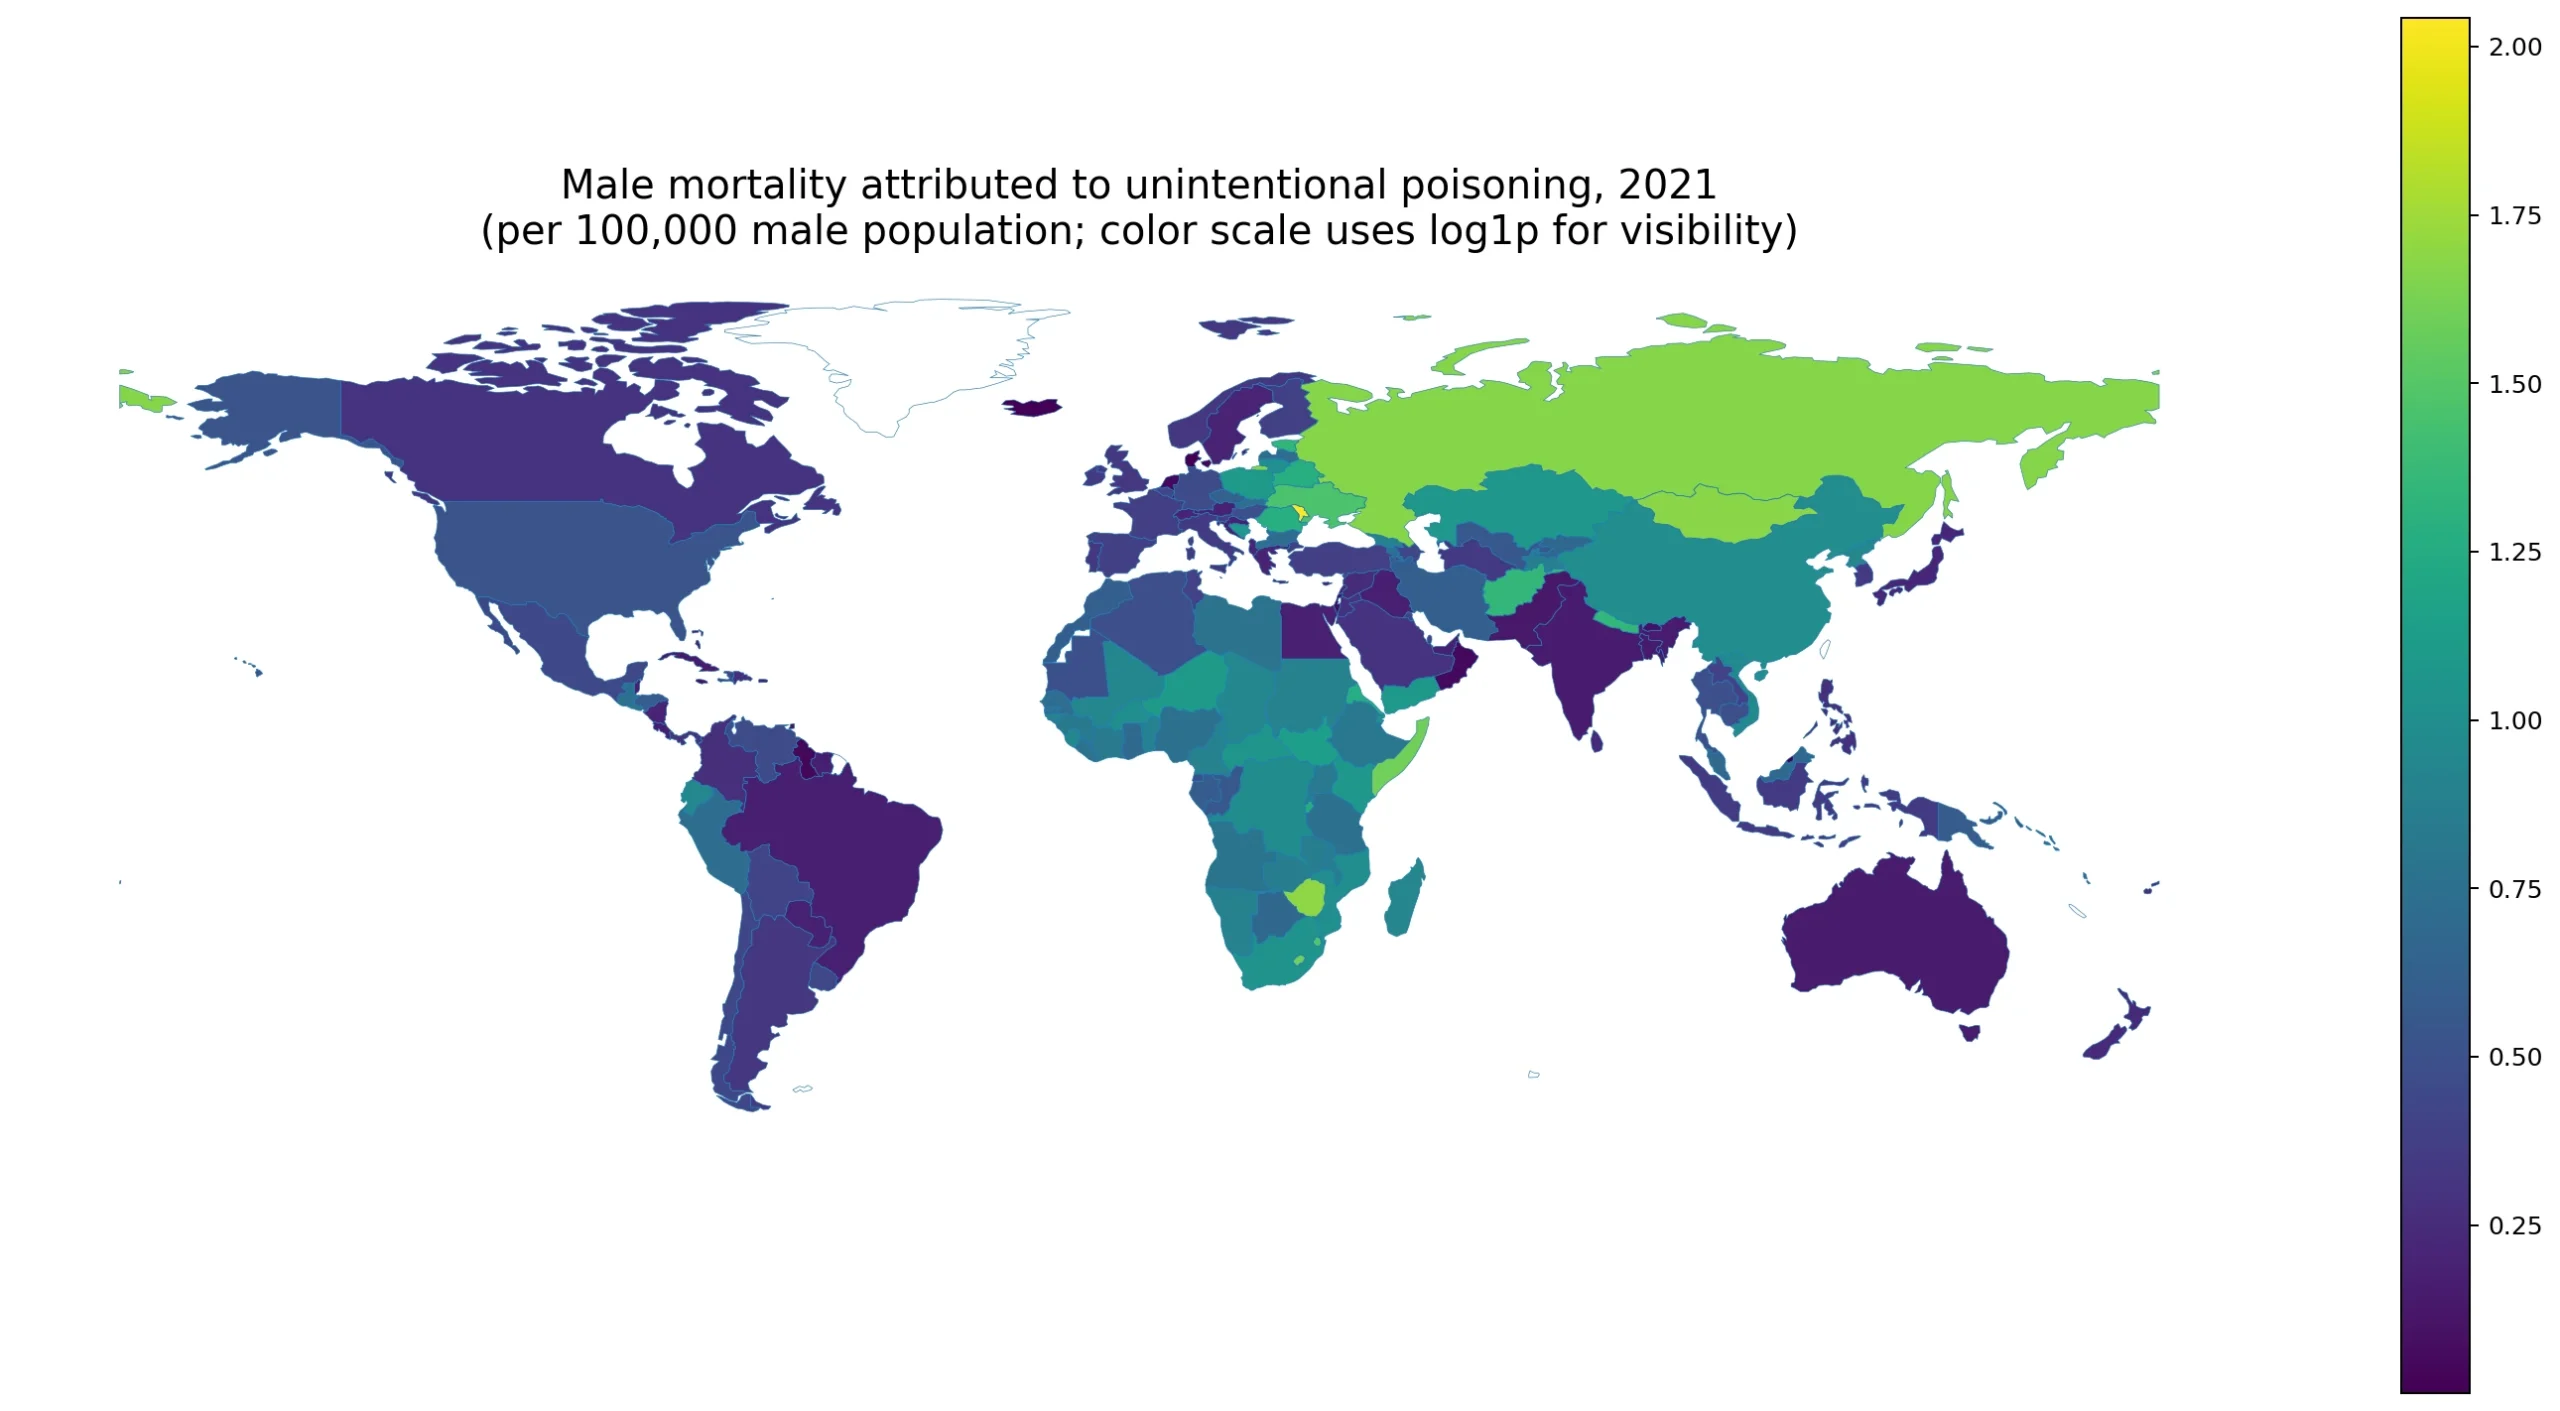
Table of Contents
The median is 0.64 deaths per 100,000 male population
Half of observed economies lie between roughly 0.28 and 1.44 deaths per 100,000 male population. There are 12 economies below 0.1, 63 from 0.1 to under 0.5, 34 from 0.5 to under 1, 56 from 1 to under 2, and 20 at 2 or more. The distribution is wide enough that a global mean by itself would hide substantial variation.
Several of the lowest values are far below one hundredth of a death per 100,000. Those are observed values, not missing data. At the same time, a missing observation must not be interpreted as zero. Mixing the two states would artificially enlarge the low-rate group and distort both the median and the map.
| Mortality-rate range | Economies |
|---|---|
| Below 0.1 | 12 |
| 0.1 to under 0.5 | 63 |
| 0.5 to under 1 | 34 |
| 1 to under 2 | 56 |
| 2 or more | 20 |
Moldova is highest, with several Eastern European and Central Asian economies also near the top
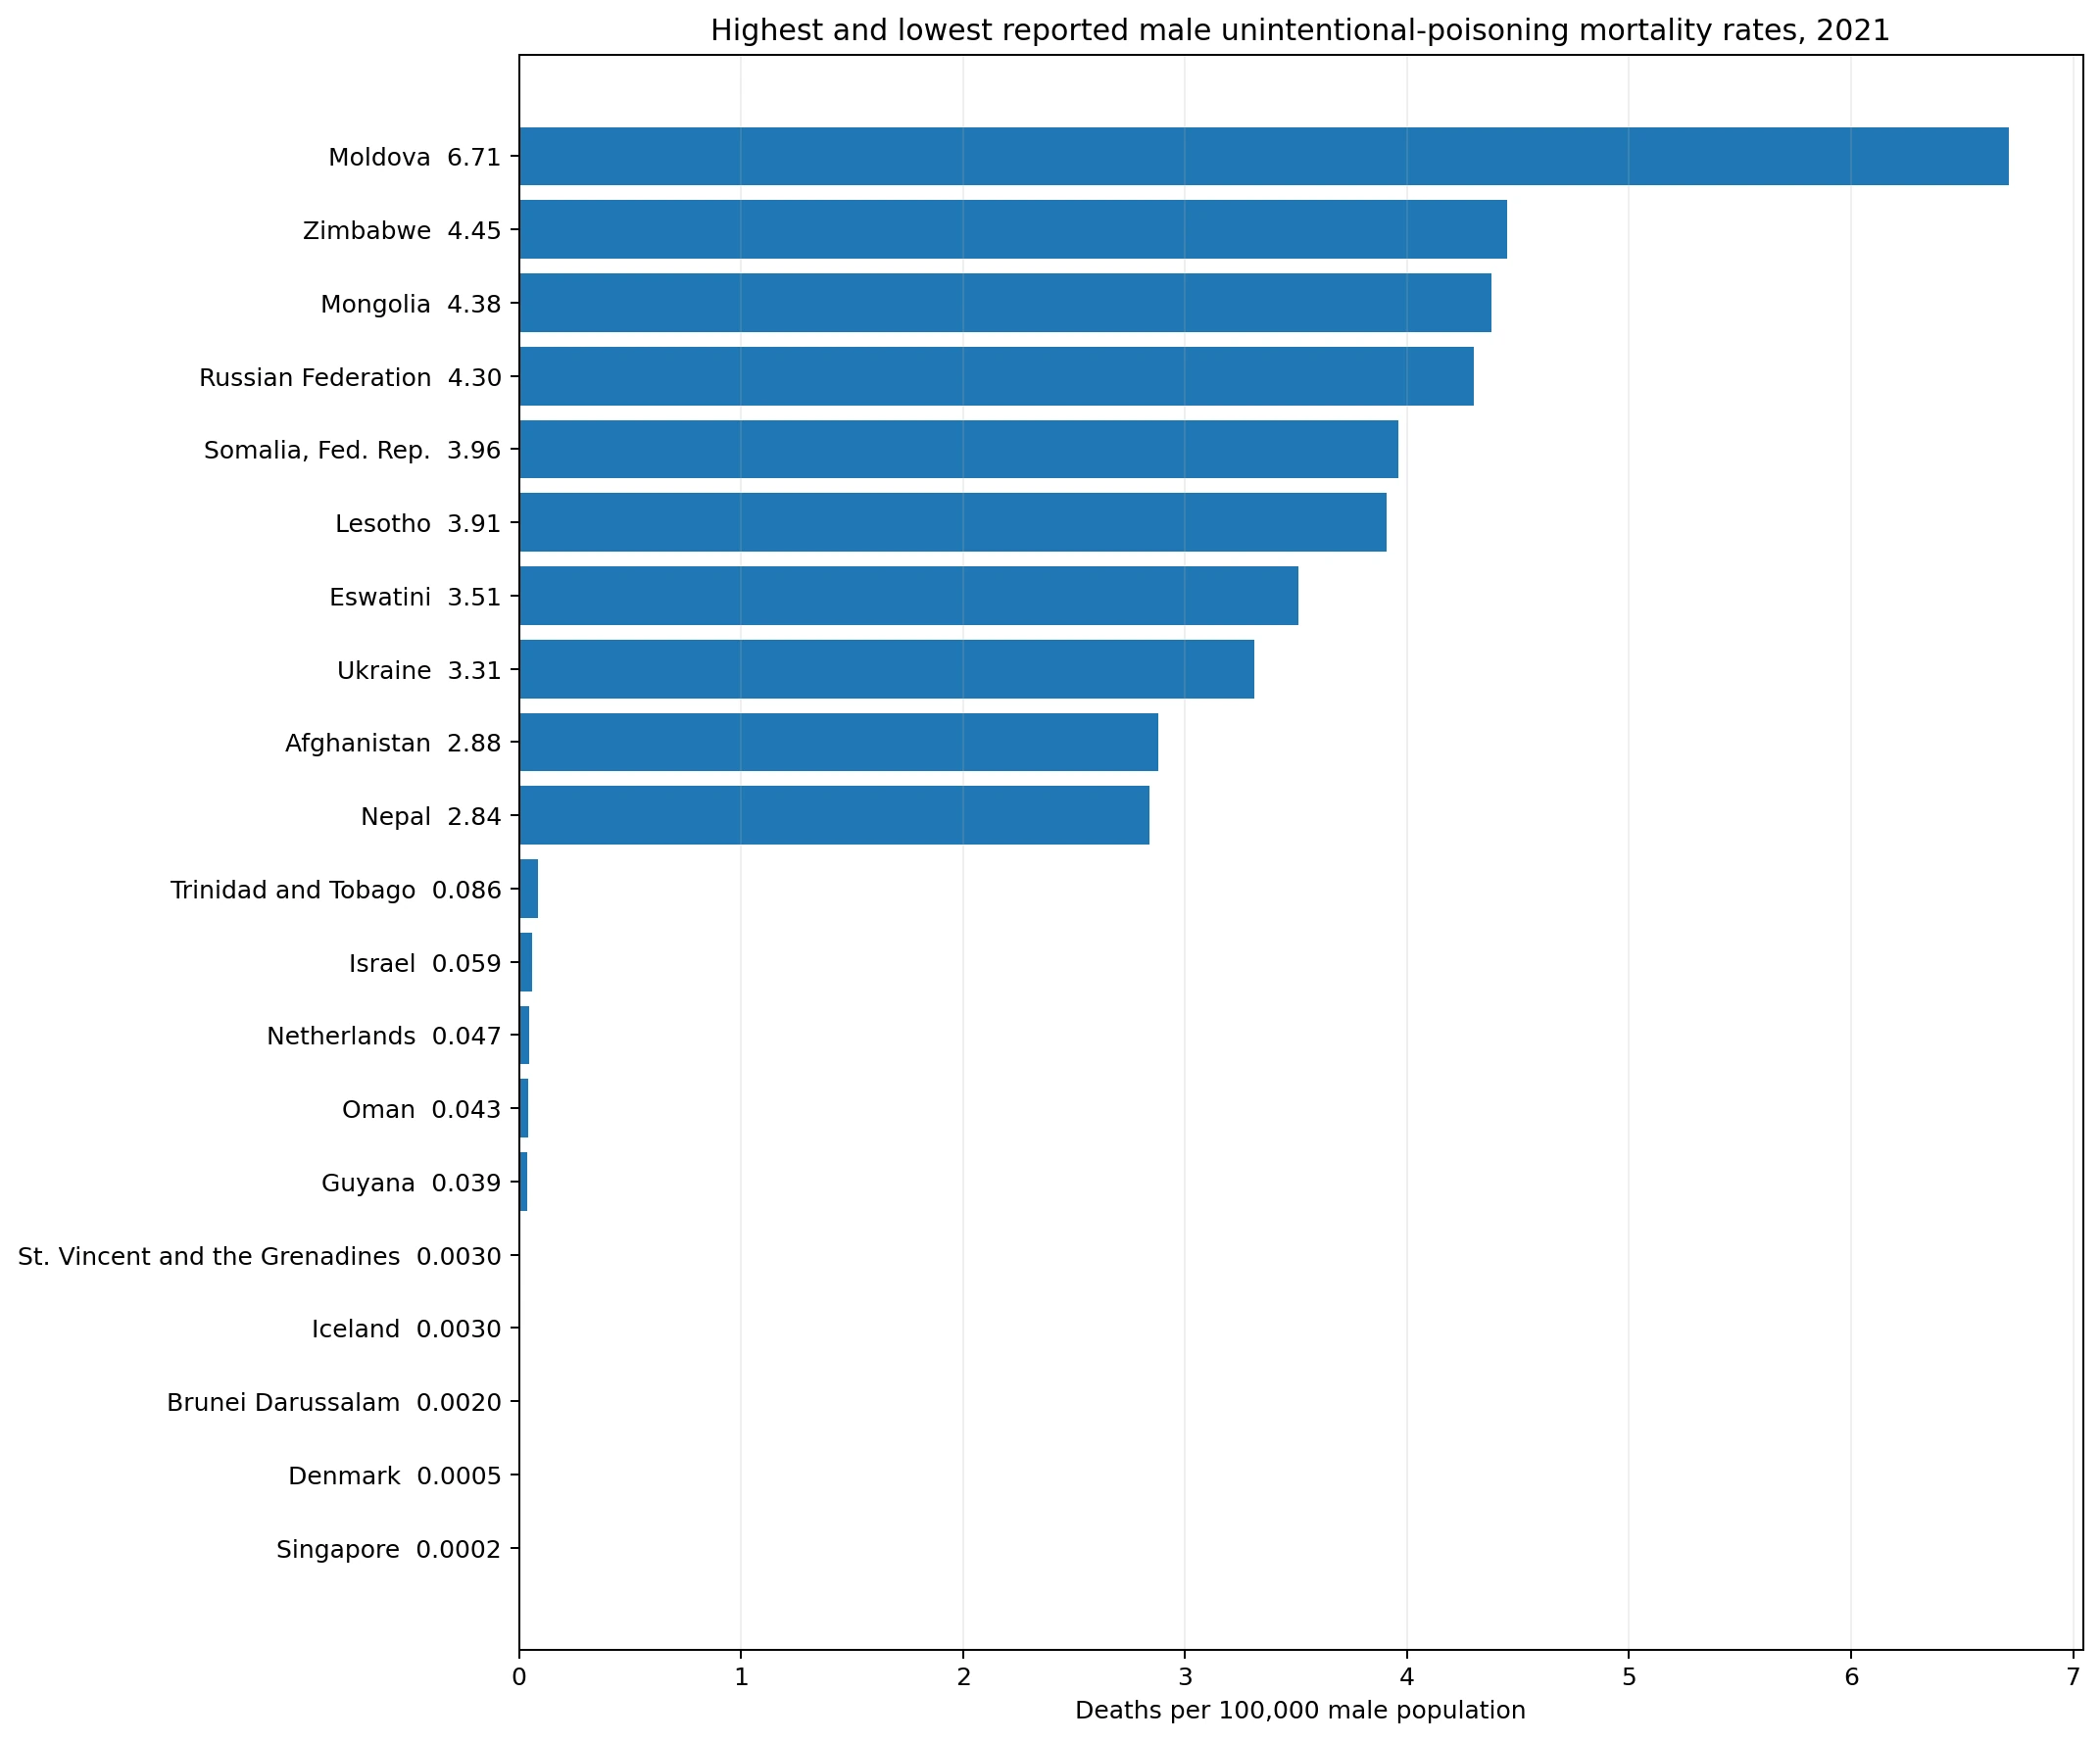
Moldova has the highest observed rate at 6.71 deaths per 100,000 male population. Zimbabwe is next at 4.45, followed by Mongolia at 4.38, the Russian Federation at 4.30, and Somalia at 3.96. Ukraine records 3.62, Lithuania 3.29, Latvia 3.22, Kazakhstan 3.05, and Belarus 2.99.
Several Eastern European and former Soviet economies appear in the highest ten, but the group is not geographically uniform because Zimbabwe and Somalia are also present. The spatial pattern should therefore be described rather than reduced to one common cause. Differences in exposure environments, health systems, cause-of-death certification, and other factors could matter, but this indicator does not quantify their separate contributions.
Moldova’s value is far above the global median and sits clearly in the upper tail of the distribution. That does not, by itself, identify a specific substance, policy, or behavioral cause. Country-specific explanations require detailed cause-of-death and exposure data.
| Highest observations | Deaths per 100,000 males |
|---|---|
| Moldova | 6.71 |
| Zimbabwe | 4.45 |
| Mongolia | 4.38 |
| Russian Federation | 4.30 |
| Somalia, Fed. Rep. | 3.96 |
| Lesotho | 3.91 |
| Eswatini | 3.51 |
| Ukraine | 3.31 |
| Afghanistan | 2.88 |
| Nepal | 2.84 |
The lowest observed rates are extremely close to zero
Singapore has the lowest reported value at 0.0002 deaths per 100,000 male population, followed by Denmark at 0.0005, Brunei Darussalam at 0.0020, Iceland at 0.0030, and St. Vincent and the Grenadines at 0.0030. Luxembourg is at 0.0040, Cyprus 0.0060, Malta 0.0070, Bahrain 0.0080, and Kuwait 0.0100.
At this scale, ordinary two-decimal rounding can display several observed values as 0.00. That would hide the difference between a very small rate and an actual zero. The table keeps additional decimal places for very small observations, and the map uses a logarithmic color transformation only for visualization while all reported values and statistics remain on the original rate scale.
Low rates also should not be assigned a single explanation. Cause-of-death recording, exposure patterns, demographic structure, health-care access, and year-to-year random variation can all affect the observed rate. Small populations are especially sensitive because one or two deaths can materially change a per-100,000 measure.
| Lowest observations | Deaths per 100,000 males |
|---|---|
| Singapore | 0.0002 |
| Denmark | 0.0005 |
| Brunei Darussalam | 0.0020 |
| Iceland | 0.0030 |
| St. Vincent and the Grenadines | 0.0030 |
| Guyana | 0.039 |
| Oman | 0.043 |
| Netherlands | 0.047 |
| Israel | 0.059 |
| Trinidad and Tobago | 0.086 |
A mortality rate is different from a death count
A rate standardizes mortality by population size, which makes cross-country risk comparisons easier, but it does not show the number of deaths. A very large country can have a moderate rate and still experience many deaths in absolute terms. A small economy can have a higher rate while recording far fewer deaths. Service planning and burden estimates often need both the rate and the count.
The denominator is specifically the male population, not the total population. Comparing this series with female mortality or an all-sex rate requires matching indicators with the same year and cause definition. Mixing denominators can produce misleading comparisons.
Age structure and small populations can affect country comparisons
The series uses the entire male population as the denominator rather than an age-standardized male population within this article’s calculation. Economies with different age structures can therefore differ partly because the age groups exposed to unintentional poisoning are represented differently. Age-specific mortality rates would be needed to identify which age groups contribute most to the national differences.
Small economies can also show large annual swings. If an economy has 50,000 male residents, one death corresponds to about 2 deaths per 100,000. The same single death has almost no visible effect in a country with tens of millions of men. Multi-year averages or trends are therefore especially useful when interpreting small-population economies.
The 2021 map is a cross-sectional snapshot, not a trend
Every value in this comparison refers to 2021. Moldova being highest in that year does not mean its rate was rising, and Singapore being lowest does not mean its rate had been falling. Establishing direction requires multiple years of the same indicator.
Mortality rates can change because the number of deaths changes, the population denominator changes, or classification and reporting practices change. A one-year map is best for identifying spatial differences and outliers. A longer time series is needed to discuss persistence or improvement.
Thirty-two missing economies are not zero-rate economies
Of the 217 rows in the source table, 185 have a 2021 value and 32 are missing. Missing means no comparable 2021 observation is available in this dataset; it does not mean that unintentional-poisoning mortality was zero. Missing economies are excluded from the ranking, median, and distribution statistics.
This distinction is especially important on a world map. A blank area should not be read as lower risk than a lightly shaded country. Observed near-zero values remain part of the statistical comparison, while missing observations are kept separate.
Key takeaways
Across the 185 economies with 2021 observations, male mortality attributed to unintentional poisoning ranges from 0.0002 to 6.71 deaths per 100,000 male population, with a median of 0.64. Moldova is the highest observation and Singapore the lowest. Several Eastern European and Central Asian economies appear near the top, but high-rate economies are also present in other regions.
Three interpretation rules matter most: the measure is a mortality rate rather than a death count, the denominator is the male population, and missing values are not zero. Explaining why individual countries differ requires more detailed information on poisoning mechanisms, age patterns, and multi-year trends.
Frequently Asked Questions
What does male mortality attributed to unintentional poisoning measure?
It measures deaths from unintentional poisoning per 100,000 male population.
Does a rate of 1 mean 1% of men died?
No. A rate of 1 means one death per 100,000 male population, which is very different from 1%.
Are missing observations treated as zero?
No. Missing means there is no comparable 2021 observation in the dataset; it does not imply zero mortality.
Can this indicator identify which poison or substance caused the country differences?
No. More detailed cause-of-death data are needed to identify specific substances, circumstances, or age groups.
Related Articles
Green Map creates custom-edited map images using open geographic data sources such as geoBoundaries, Natural Earth, OpenStreetMap, and government open data.
These maps are edited visual materials, not raw data files, and are provided for education, documents, presentations, and graphic reference.