Montgomery County is centered on Crawfordsville, with Linden to the north, Waynetown to the west, Darlington to the northeast, and New Market and Ladoga in the southern half. You can download the high-resolution JPG ZIP directly from this page when you need larger road labels, creek names, settlement details, or relief shading. This Montgomery County Indiana Map page combines the Crawfordsville road network with a six-place city index, Sugar Creek and its tributaries, and a 169–284 meter elevation surface that rises strongly toward the east and southeast.
Crawfordsville is the easiest place to use for orientation. It has the largest developed footprint and sits where several numbered routes spread toward the outer county. Route 231 connects Crawfordsville with Linden, Route 32 heads east, and Routes 74 and 136 help define the southeast. Waynetown and Ladoga sit well away from the central city, making them useful references for the county’s overall width and length.
The physical-geography views show a much stronger terrain pattern than the road map alone. Sugar Creek bends through the center in a long green lowland, with Black Creek descending from the north and Walnut Fork Sugar Creek extending toward the southeast. Higher tan and brown ground spreads across the eastern and southeastern county, interrupted by lower valleys along Big Raccoon Creek and Cornstalk Creek. The legend reports an actual elevation range of about 169 to 284 meters and a mean of 244 meters.
Table of Contents
Crawfordsville ties the northern, western, and southeastern road routes together
Crawfordsville has by far the largest developed area on the general map. Route 231 runs north-south through the city, Route 32 continues east, and Routes 74 and 136 help organize the southeast. Roads toward Waynetown and New Richmond spread west and northwest, while the New Market–Ladoga side extends south from the central urban area.
Linden lies north of Crawfordsville along Route 231, while New Richmond provides a smaller northwestern reference. Waynetown is farther west near the county line around Routes 25 and 400, and Wingate sits still farther northwest. The settlements become smaller and more widely separated outside Crawfordsville, so roads and creek crossings are often more useful than developed-area size for orientation.
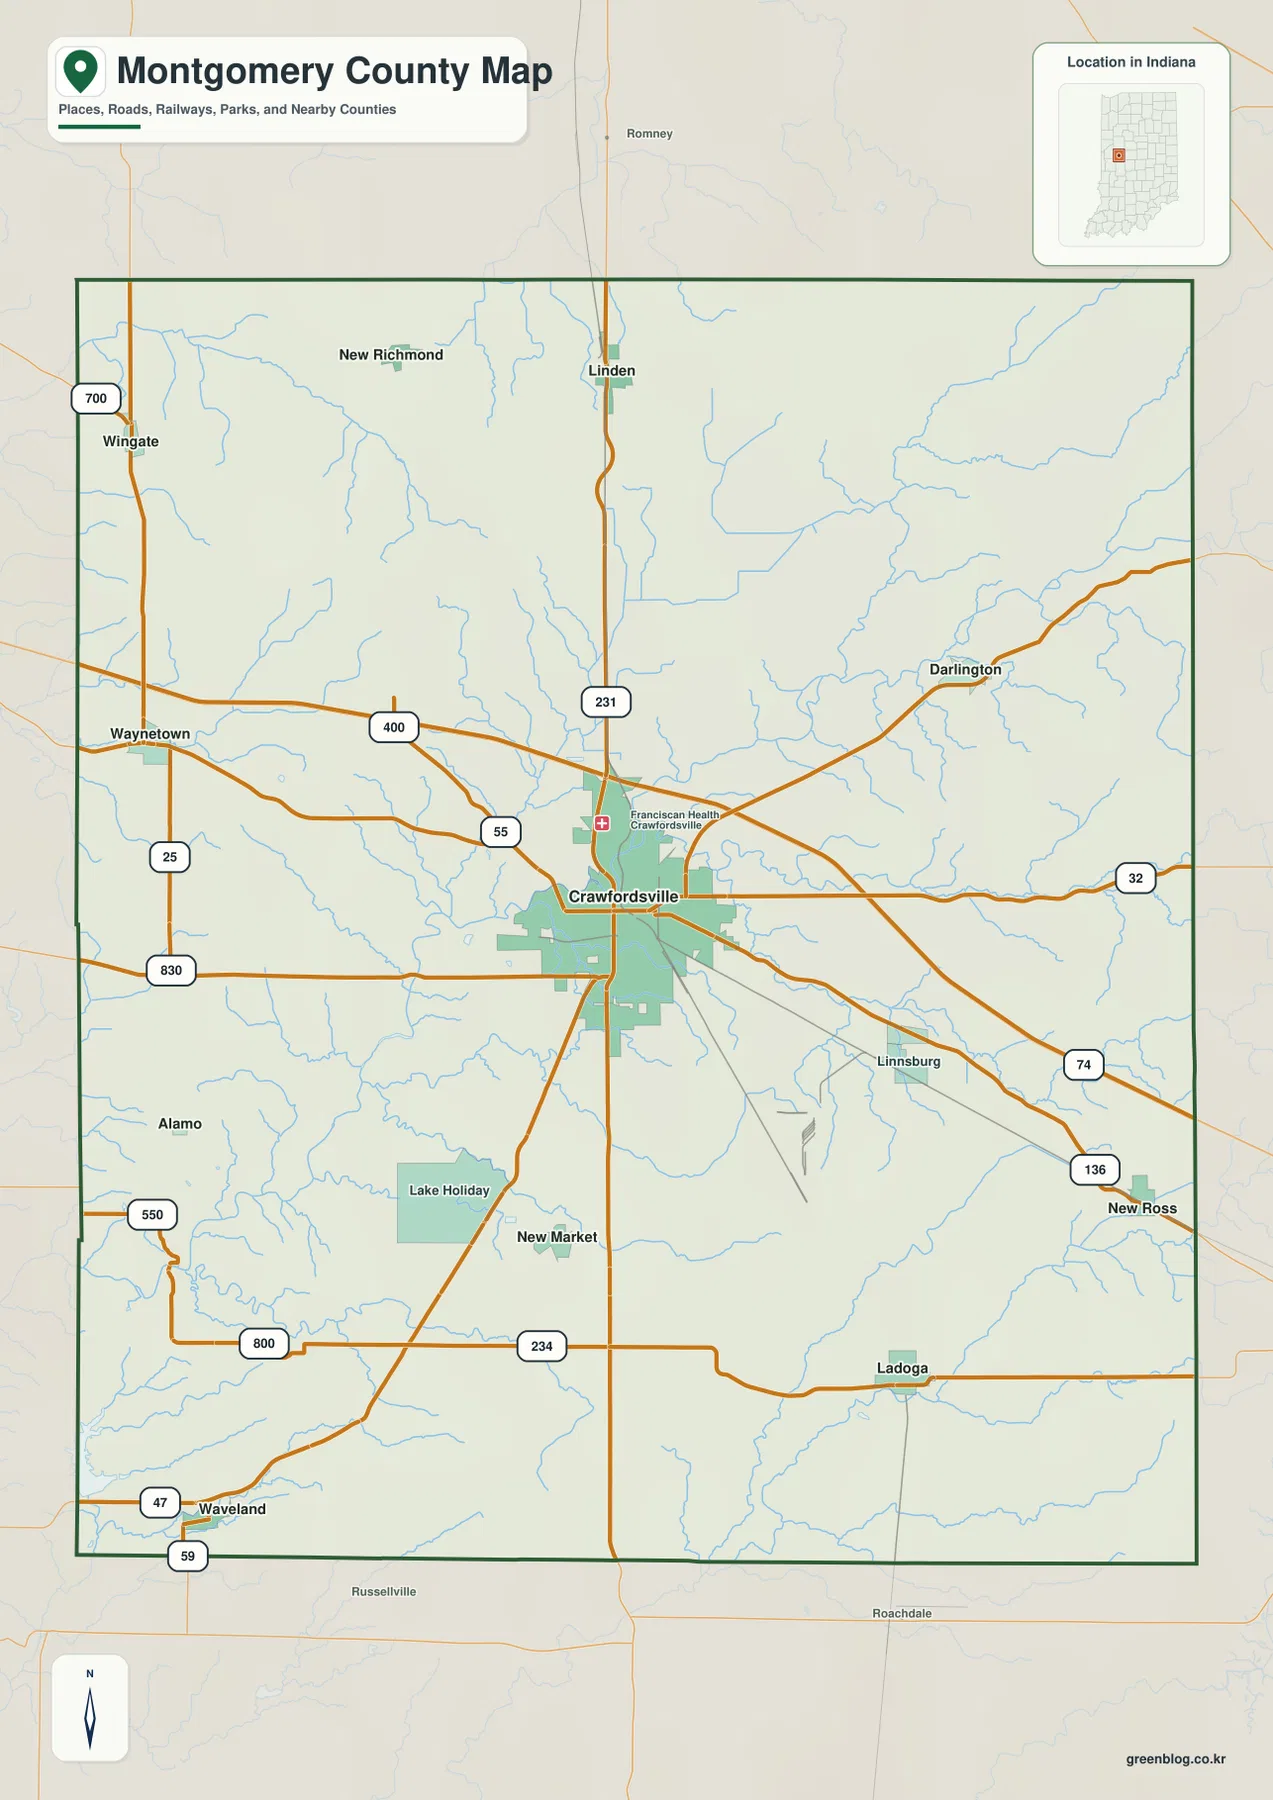
Darlington occupies the northeastern side beyond a broad rural and creek-filled area. Linnsburg and New Ross appear in the southeast, where Routes 74 and 136 become strong directional markers. Ladoga sits farther south near Route 234, while New Market is closer to Crawfordsville and slightly to the southwest.
The southwest is more lightly settled. Alamo and Waveland appear as small place labels, and Lake Holiday is one of the more noticeable water landmarks. Routes 47, 59, 550, and 800 help divide this side of the county. Working outward from Crawfordsville in a clockwise direction makes the scattered settlement pattern much easier to follow.
The city index shows one dominant center and five much smaller county references
The supplied city index highlights Crawfordsville, Ladoga, Waynetown, Darlington, Linden, and New Market. Crawfordsville is printed at 16,491 and Ladoga at 1,144. Waynetown and Darlington are close at 805 and 798, followed by Linden at 590 and New Market at 509. These figures belong to the supplied map edition rather than a live demographic feed.
| Rank | Place | Value printed on map | Position |
|---|---|---|---|
| 1 | Crawfordsville | 16,491 | Central |
| 2 | Ladoga | 1,144 | Southeast |
| 3 | Waynetown | 805 | West |
| 4 | Darlington | 798 | Northeast |
| 5 | Linden | 590 | North |
| 6 | New Market | 509 | South-central |
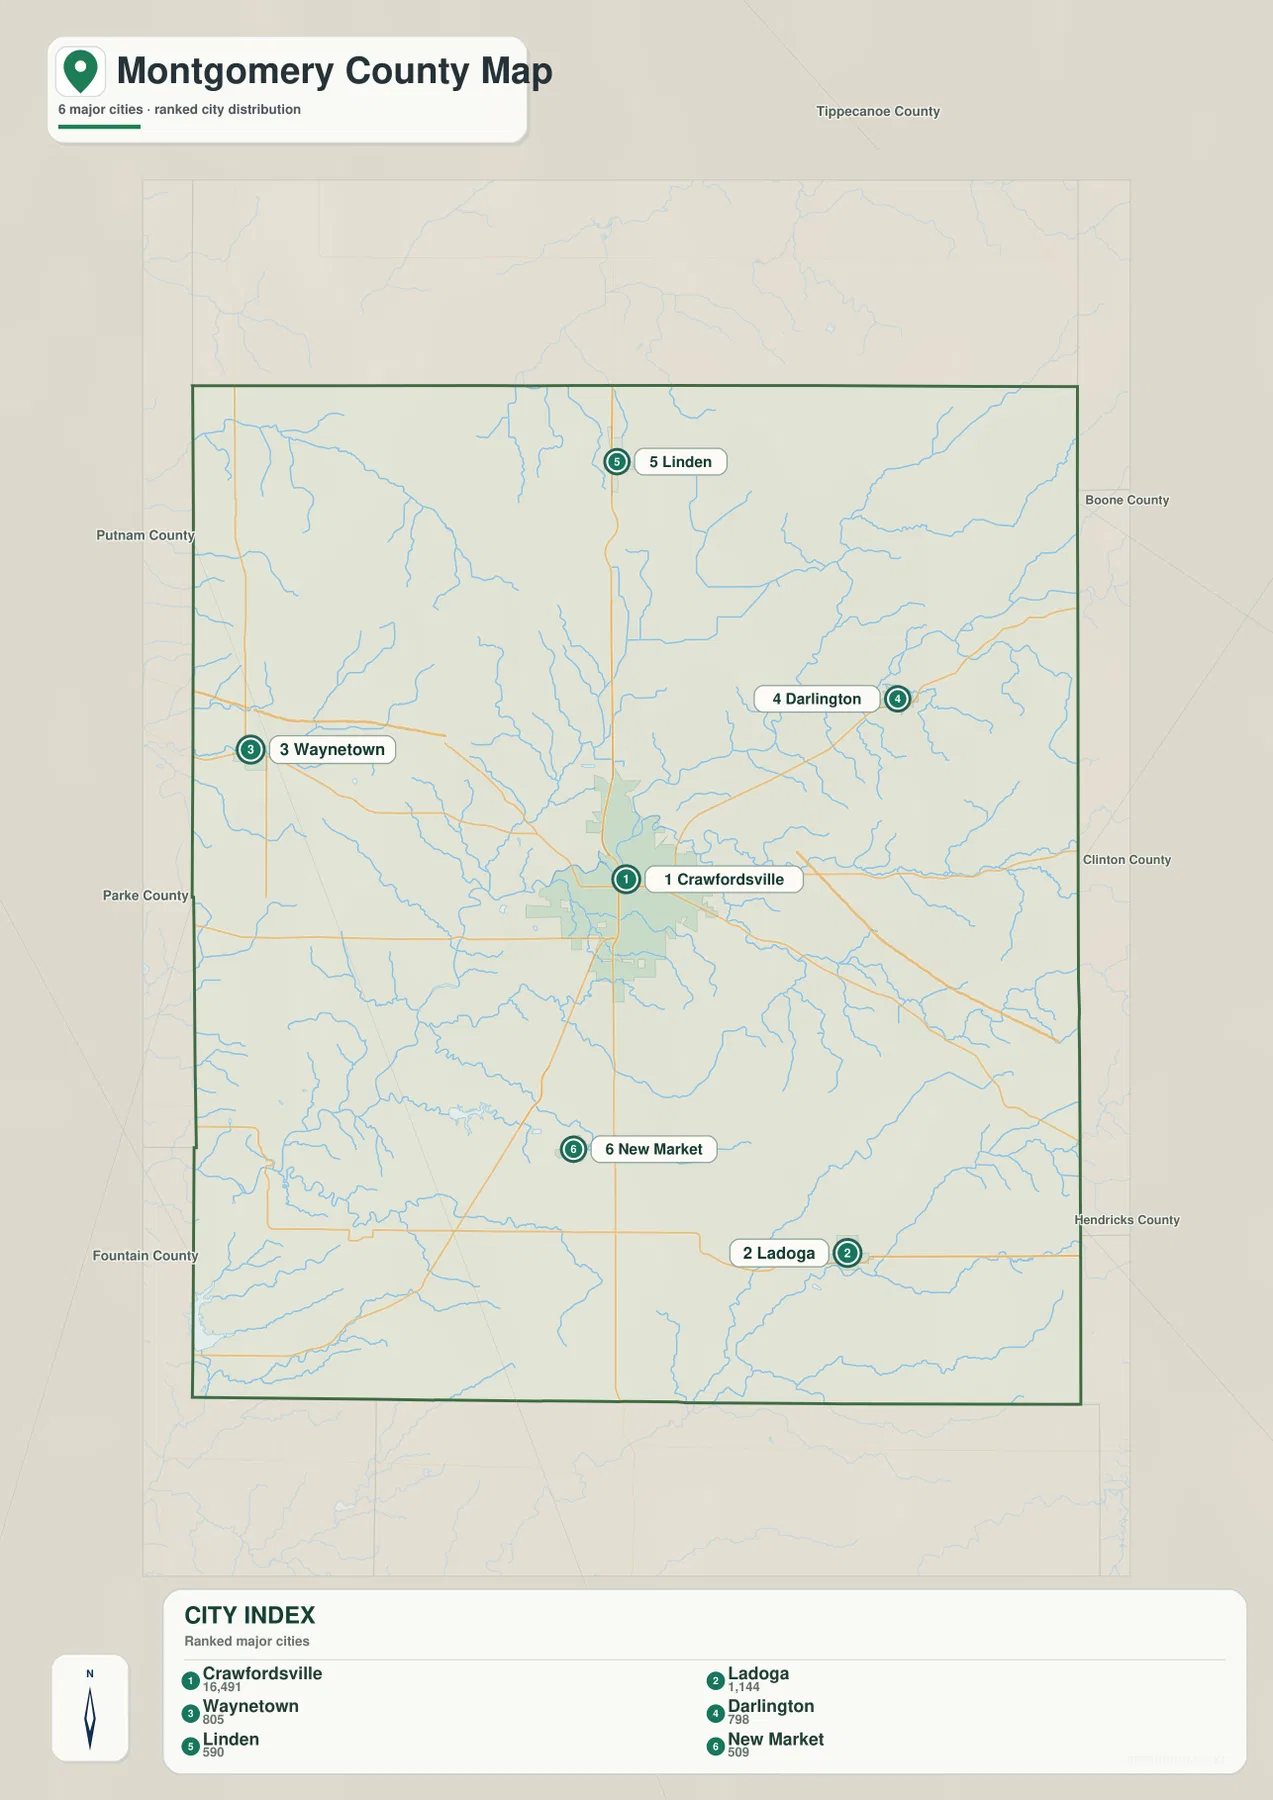
The size gap between Crawfordsville and the other highlighted places is large enough that Montgomery County reads as a single major center surrounded by small towns rather than a chain of similarly sized cities. Ladoga anchors the southeast, Waynetown the west, and Darlington the northeast. Linden and New Market provide smaller but useful north and south references.
The general map contains additional labels such as Wingate, New Richmond, Alamo, Waveland, New Ross, and Linnsburg that do not appear in the six-place index. Use the general view when those smaller places or road connections matter. Use the index when the goal is a quick comparison of the six highlighted settlements. Current population analysis should rely on a current official source rather than the printed values alone.
Sugar Creek forms the central lowland while Black Creek and southern tributaries carve separate valleys
Sugar Creek is the strongest water reference on the terrain-and-water map. It enters from the west, bends through the central county north of Crawfordsville, and continues toward the northeast. Cox’s Pond sits near the Sugar Creek–Black Creek area and provides a small fixed landmark when road names are absent.
Black Creek descends from the north toward Sugar Creek, while East Fork Coal Creek occupies the northwestern interior. Little Potato Creek appears in the northeast. South of Sugar Creek, Walnut Fork Sugar Creek and Little Sugar Creek extend across the eastern half, creating a dense set of lower corridors rather than one simple drainage line.
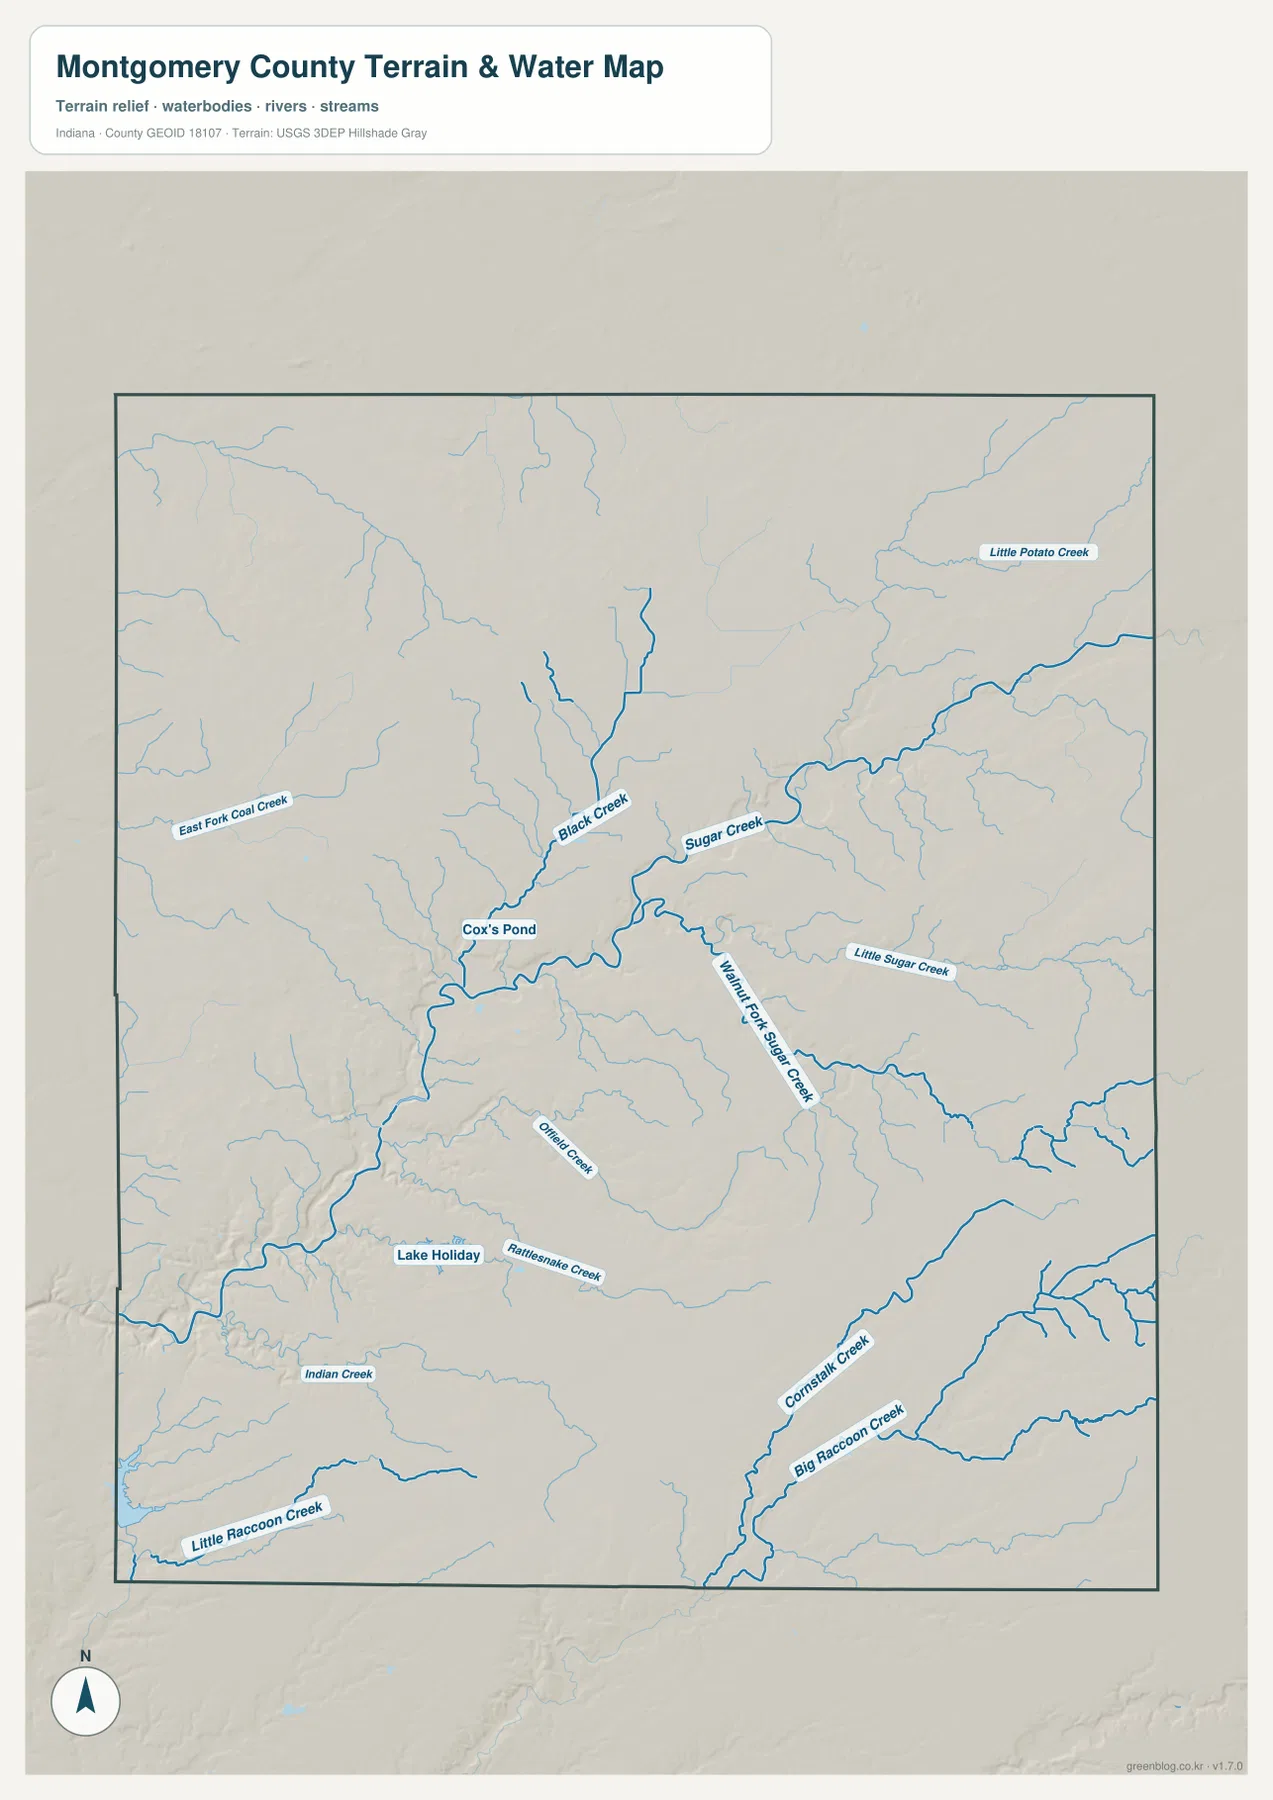
Rattlesnake Creek and Indian Creek organize the southwest around Lake Holiday, while Little Raccoon Creek runs closer to the southern edge. Big Raccoon Creek and Cornstalk Creek create clear southeastern lowlands through higher terrain. These southern valleys are especially useful on the elevation map because they remain green while the surrounding hills turn tan and brown.
The City of Crawfordsville highlights Sugar Creek in its local trail and outdoor-quality projects, reinforcing the creek’s importance as a local geographic landmark. The supplied water map is still intended for location and terrain reference. Flood risk, current water conditions, navigation rights, property limits, and legal stream boundaries require the appropriate current agency source.
The 169–284 m relief rises sharply away from Sugar Creek toward the east and southeast
The elevation legend gives an actual Montgomery County range of about 169 to 284 meters and a mean of 244 meters. On this Montgomery County scale, the creek floors appear in green and the land steps upward through yellow and tan into the brown hilltops of the east and southeast. Sugar Creek forms the most prominent central lowland, while the eastern and southeastern county contains broad high ground.
Around Crawfordsville, Sugar Creek and its nearby tributaries create a wide set of lower green corridors. Black Creek continues that low pattern northward, while the land between the stream valleys rises into smaller hills. The western county remains lower overall than the southeast, but it is still broken by short ridges and tributary cuts rather than being completely flat.
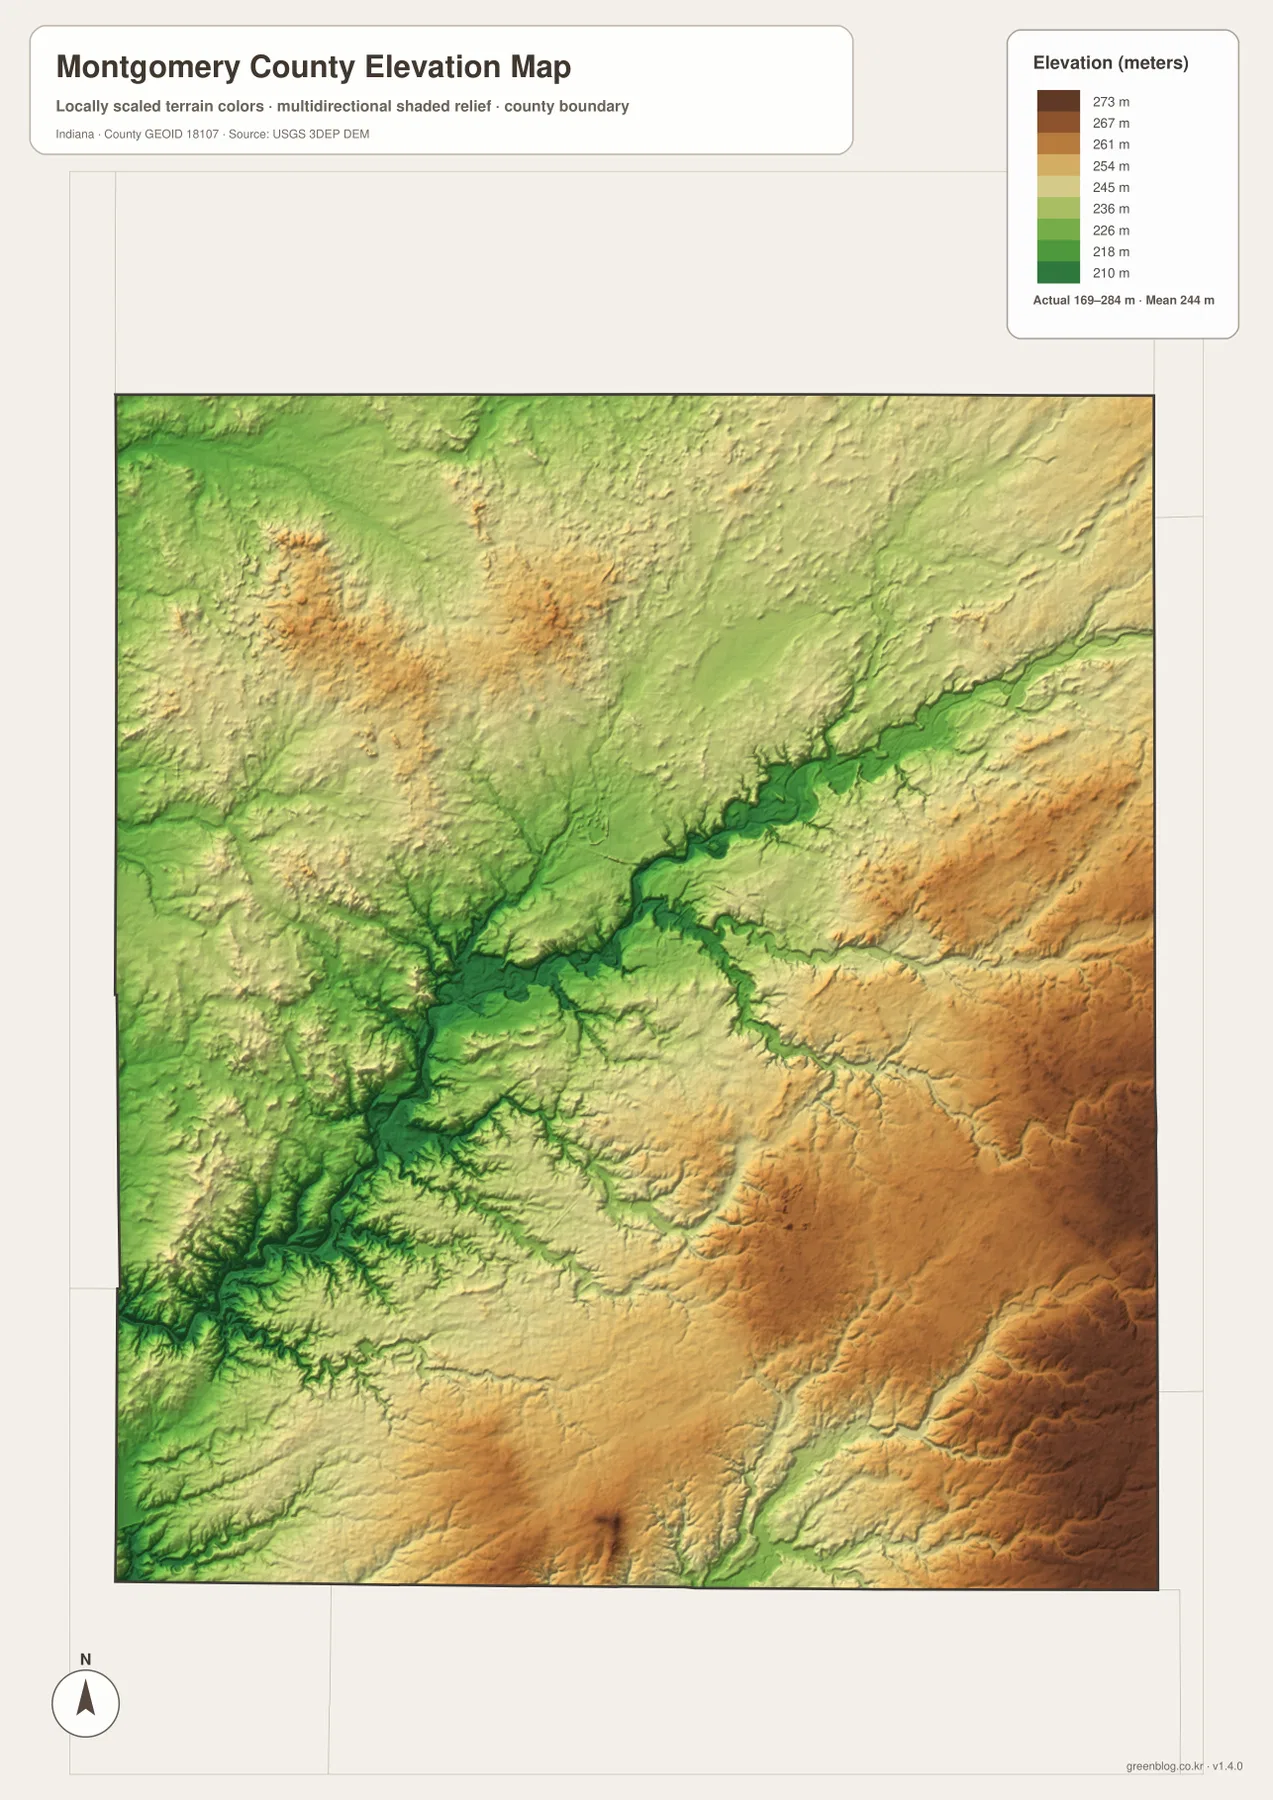
East of the central creek valley, the colors rise steadily into tan and brown. Big Raccoon Creek and Cornstalk Creek cut lower green lines through that high surface in the southeast. Keeping Darlington and New Ross in mind from the general map helps match those eastern hill areas back to settlement locations.
Lake Holiday and the Little Raccoon Creek side of the southwest sit within a more complicated lower landscape, while the Ladoga side of the southeast is broadly higher. A useful county-scale reading is the Sugar Creek lowland through the center, lower rolling ground in the west, and stronger hills across the east and southeast.
The 169–284 meter range is intended for broad terrain comparison rather than survey-grade work. For a Montgomery County parcel, building site, roadway grade, or drainage design, use original elevation data or a qualified survey instead of this county-scale relief image.
Keep Crawfordsville fixed while comparing the town pattern with Sugar Creek and the higher southeast
For settlements and roads, begin with Crawfordsville near Routes 231 and 32. Move north to Linden, west to Waynetown, northeast to Darlington, and south to New Market and Ladoga. Smaller labels such as Wingate, Waveland, and New Ross become easier to place once the main road framework is familiar.
The city index is useful when the goal is to compare the six highlighted places without the dense road and creek network. Crawfordsville dominates the printed values, while Ladoga, Waynetown, and Darlington define different outer directions. Linden and New Market provide smaller north and south markers.
For physical geography, locate Sugar Creek first, then add Black Creek, Walnut Fork Sugar Creek, and Big Raccoon Creek. Switch to the elevation map at those same locations and the county’s structure becomes clear: central creek valleys stay low, the west remains relatively subdued, and the east and southeast rise into stronger hills.
The WebP images on this page are reduced previews. The Montgomery County archive contains four original 2572×3638-pixel JPG files covering the general county map, city index, terrain-and-water map, and elevation map. The larger originals are better for printing or reading small road, creek, and settlement labels.
A useful comparison is to keep Crawfordsville fixed as the central reference. Find Waynetown, Darlington, and Ladoga on the general map, compare the six highlighted settlements on the city index, move to the water view to trace Sugar Creek and Black Creek, and finish on the elevation map by comparing those low valleys with the high southeastern terrain.
Frequently Asked Questions
Which places have the largest values on the supplied city index?
Crawfordsville is printed at 16,491, followed by Ladoga at 1,144, Waynetown at 805, Darlington at 798, Linden at 590, and New Market at 509. These figures belong to the supplied map edition rather than a live demographic feed.
Why is Sugar Creek the easiest water reference?
Sugar Creek crosses the county through a broad central lowland and passes north of Crawfordsville before bending northeast. Black Creek joins from the north, while Walnut Fork Sugar Creek extends toward the southeast, making the main drainage relationships easy to recognize from one central feature.
Can the 169–284 m elevation range be used for exact site measurements?
No. The elevation image gives a county-wide range with a mean of 244 meters and is intended for comparing creek lowlands with the higher eastern and southeastern terrain. Exact property, construction, road-grade, or drainage work requires original elevation data or professional survey measurements.
Map File Information
The Montgomery County ZIP combines the general road-and-place map, six-place city index, terrain-and-water map, and elevation map as full-resolution JPG originals.
- File Type: ZIP containing four 2572×3638px JPG files
Related Maps
Sources and References
The article is based primarily on the supplied Montgomery County map set and asset manifest. The following official sources provide county, Crawfordsville, boundary, hydrography, and elevation context.
- Montgomery County, Indiana – official county government and local administrative information
- City of Crawfordsville – Quality of Place – official information on local Sugar Creek trail connections and community projects
- U.S. Census Bureau TIGER/Line Shapefiles – boundary reference for Montgomery County and its place framework
- USGS National Hydrography – reference data for Sugar Creek, tributaries, and mapped water features
- USGS 3D Elevation Program – source terrain data for checking precise elevations beyond the county-scale relief image
Green Map creates custom-edited map images using open geographic data sources such as geoBoundaries, Natural Earth, OpenStreetMap, and government open data.
These maps are edited visual materials, not raw data files, and are provided for education, documents, presentations, and graphic reference.