Download the high-resolution A3 JPG Vermilion County Map ZIP directly from this page. Vermilion County has two very different settlement patterns: Danville, Tilton, Westville, Georgetown, and Catlin form a relatively compact southeastern group, while Hoopeston stands far to the north as a separate major center. Between them are smaller communities such as Rossville, Henning, Alvin, and Bismarck. The water and elevation maps add another layer, showing several branches of the Vermilion River cutting low valleys through higher northern terrain.
The embedded WebP maps are sized for quick browser viewing, while the matching original JPG files in the archive are better for enlarging small road and stream labels or for printing. A practical way to begin is with Danville and I-74, then move south through Tilton, Westville, and Georgetown and north through Bismarck, Alvin, Rossville, and Hoopeston. Once those places are familiar, the North Fork and Middle Fork Vermilion River provide an easy framework for reading the terrain.
Table of Contents
Danville anchors a dense southeastern settlement cluster
Danville is the clearest landmark on the general county map. Its built-up area occupies a large part of the east-central to southeastern county, and I-74 runs west from the Oakwood side toward Danville. Tilton sits immediately southwest of the city, with Westville and Georgetown farther south. Catlin lies to the southwest rather than on the same north-south line, so the southern settlement pattern branches away from Danville instead of following a single corridor.
Moving north produces a much more open map. Bismarck lies north of Danville, Alvin farther north, and Rossville continues the sequence toward Hoopeston. Henning sits west of Alvin and provides another mid-county reference. Route 136 crosses the Henning–Alvin area, while Route 9 runs through the far north around Hoopeston. These roads make it easier to understand the long distance between the northern city and the denser Danville area.
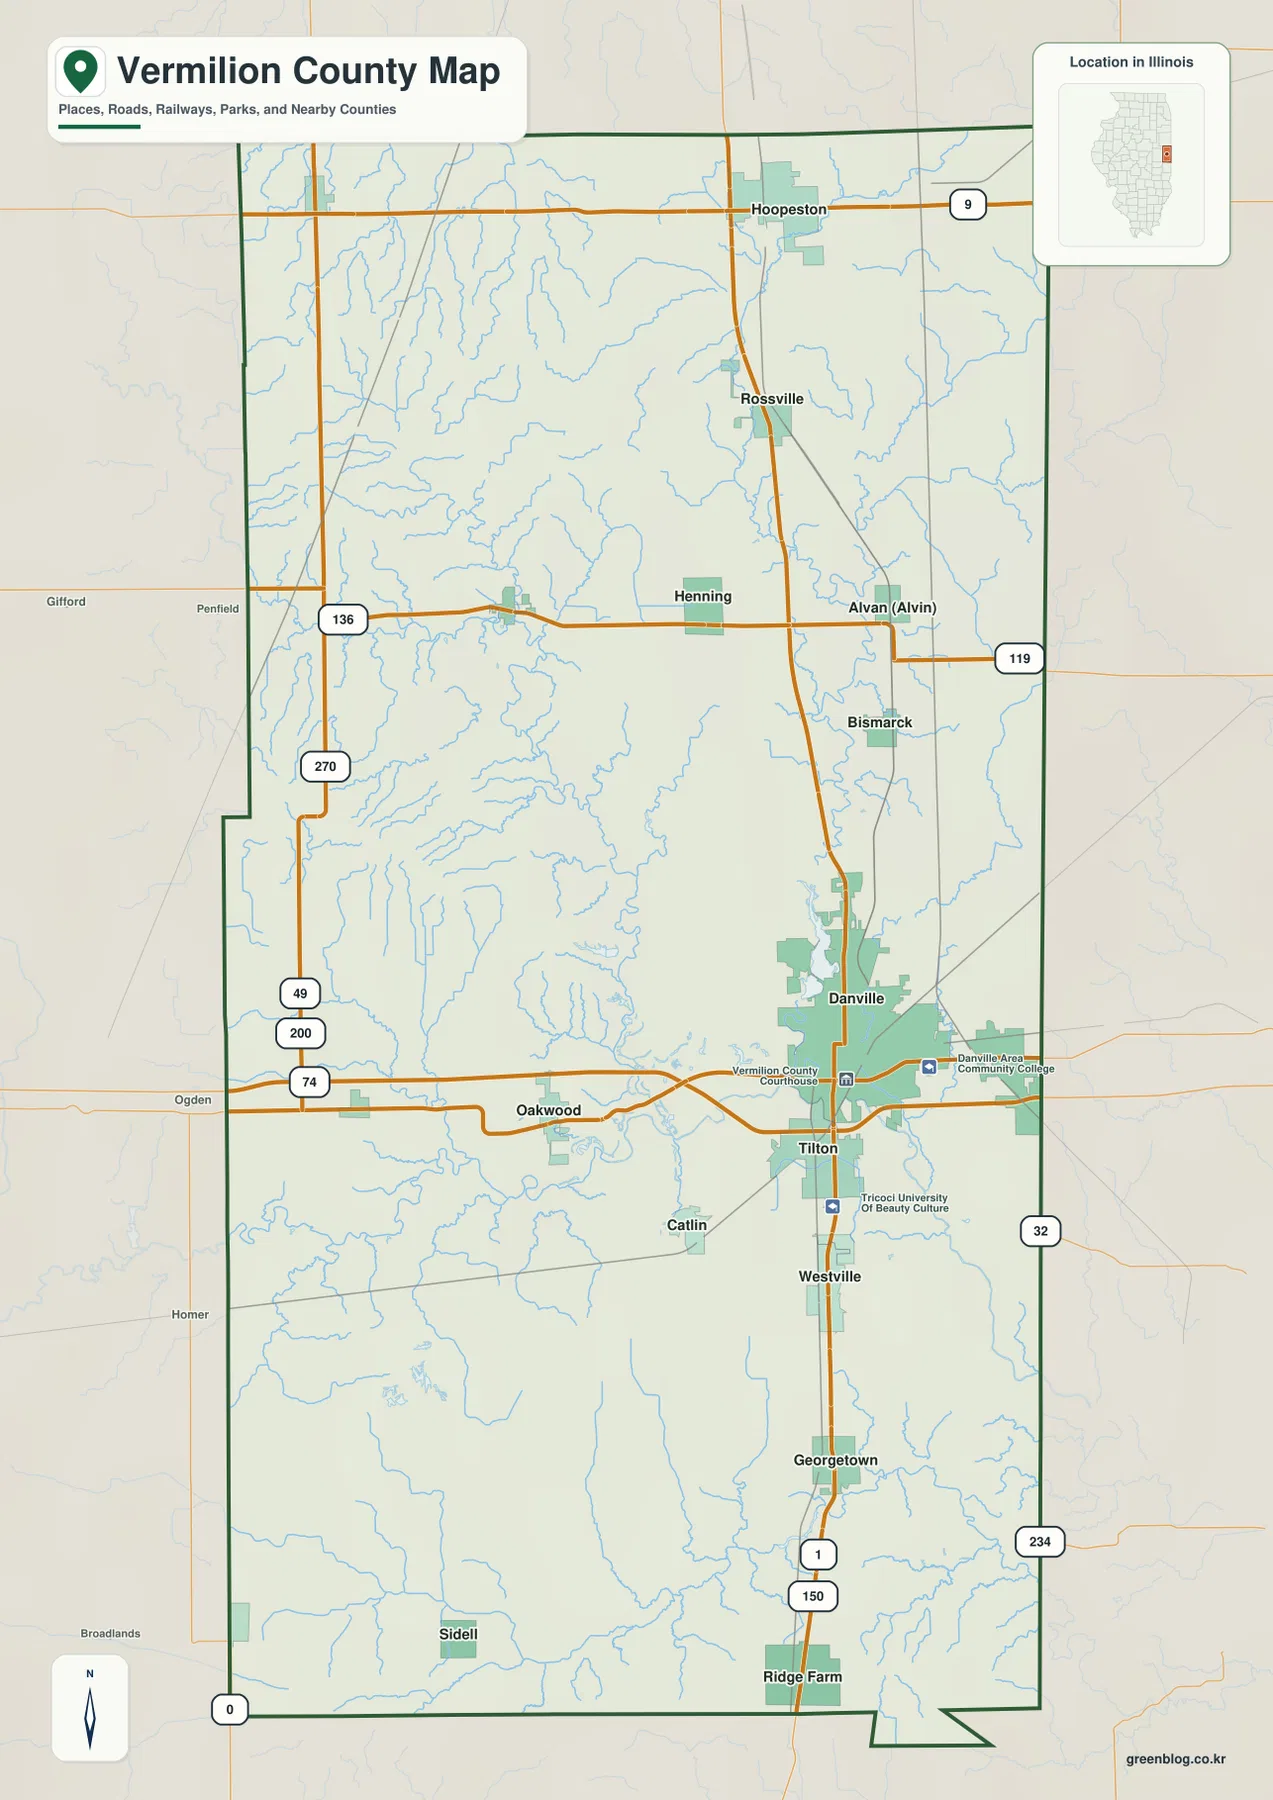
The western half of the county contains far fewer large community labels. North of Oakwood, the map is dominated by local roads and a dense network of small blue waterways. Numbers such as 49, 200, and 270 provide orientation on the western side, but the larger pattern is easier to understand by keeping Danville, Oakwood, and Henning in view as reference points. The contrast with the eastern side is clear: settlement names are more widely spaced and stream lines become more visually prominent.
Georgetown and Ridge Farm provide useful southern references. Roads labeled 1 and 150 appear near Georgetown, and 234 is shown close to the eastern edge. Sidell lies farther southwest, separated from the main Danville–Westville–Georgetown group. The full county map is therefore most useful when the goal is to compare three areas at once: the northern Hoopeston region, the southeastern Danville cluster, and the much more open western and southwestern interior.
The six-city index stretches from Hoopeston to Georgetown
The city-index map removes most local roads and smaller place labels and highlights six communities. The supplied ranking places Danville first with 28,595, Hoopeston second with 5,034, Westville third with 3,419, Georgetown fourth with 3,069, Tilton fifth with 2,453, and Catlin sixth with 2,160. These values are described only as figures printed on the supplied city index; they are not presented here as newly verified current population counts.
Five of the six highlighted places are relatively close to the southeastern part of the county. Danville is the central reference, Tilton lies immediately southwest, Westville and Georgetown are farther south, and Catlin sits to the southwest. Hoopeston is the exception. It stands near the northern edge, far from the other five markers, making the county’s principal settlement pattern much more stretched than the Danville-area cluster alone would suggest.
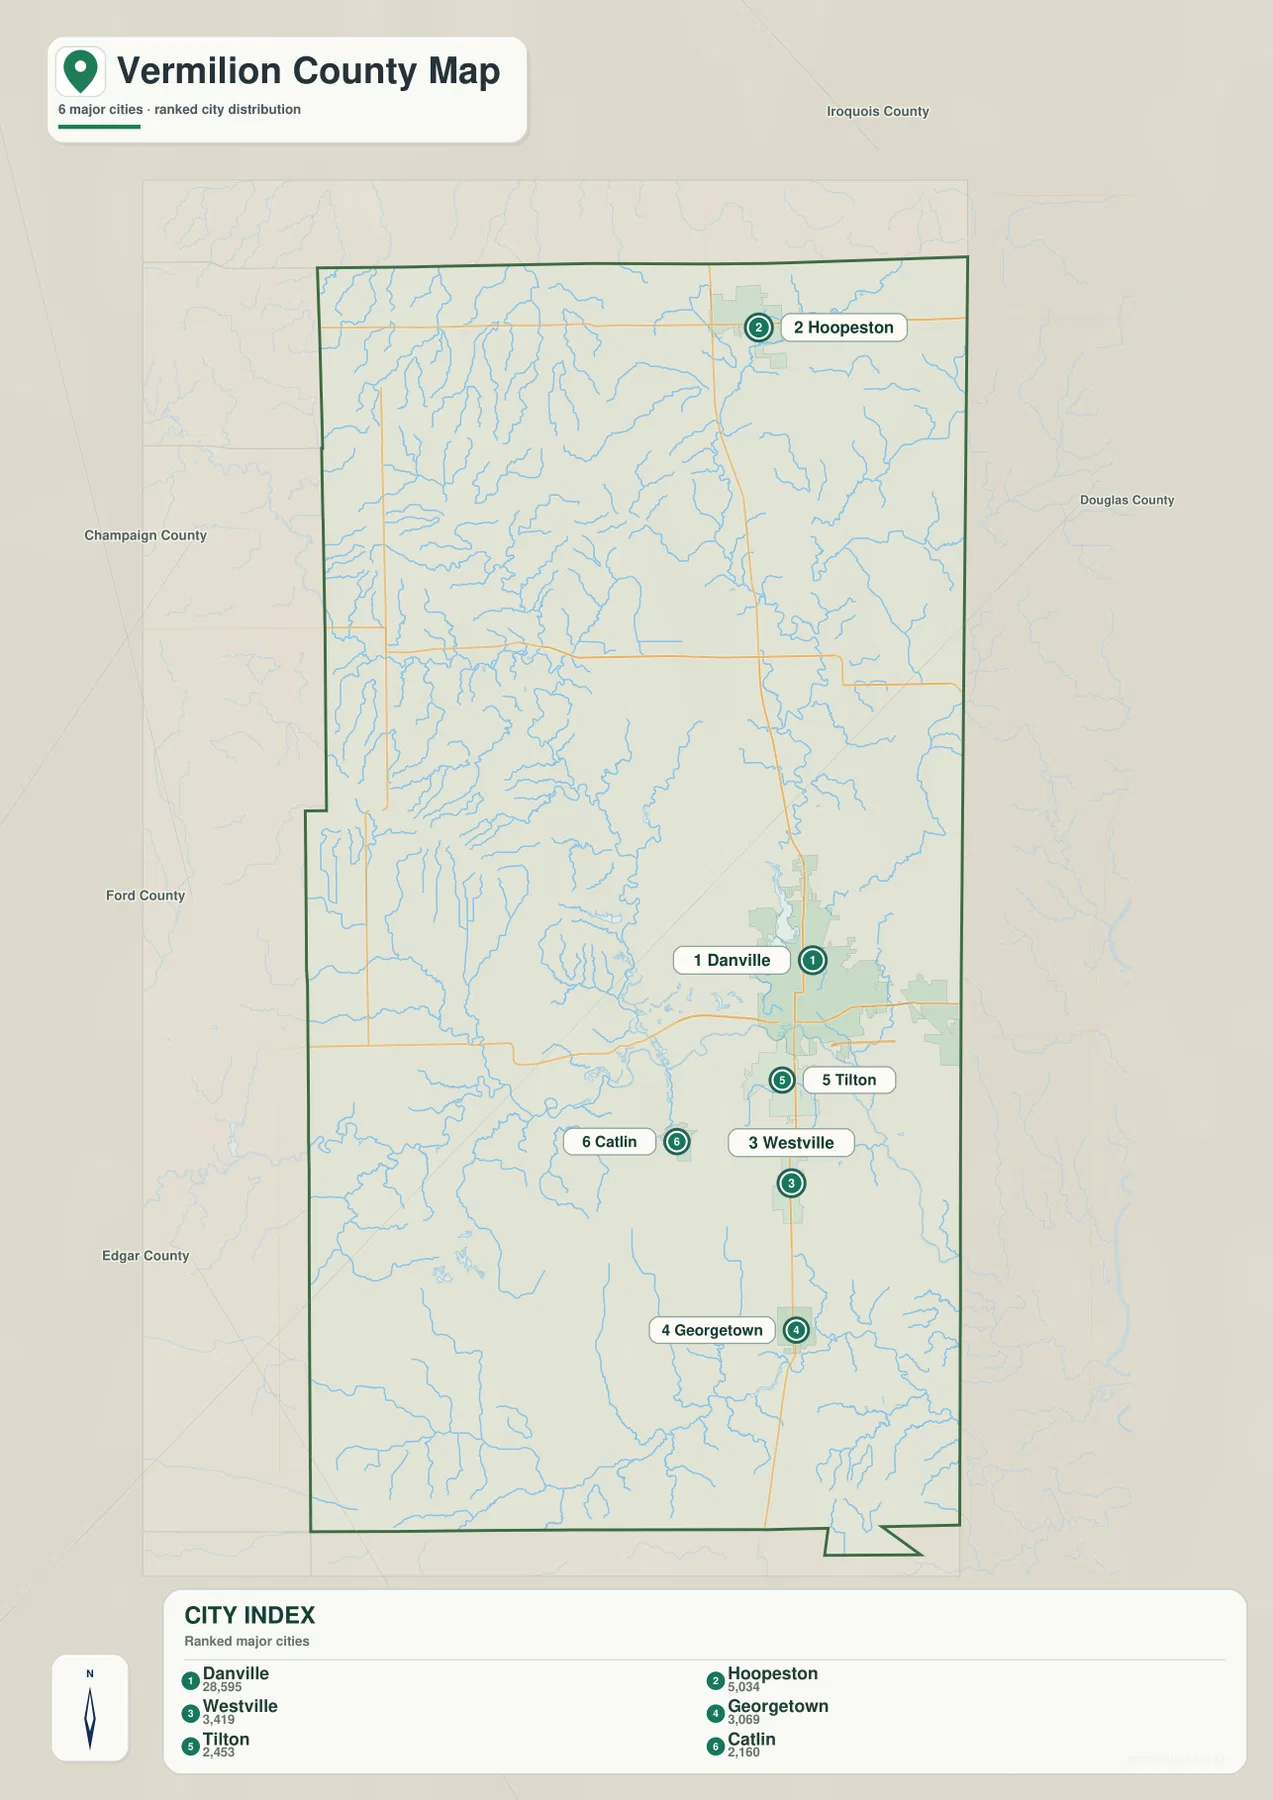
This simplified view is especially useful for understanding how unusual Hoopeston’s position is compared with the rest of the highlighted places. The general county map is still necessary when smaller communities such as Rossville, Henning, Alvin, Bismarck, or Ridge Farm matter. The city index answers a narrower question: where are the principal labeled cities concentrated, and which one lies far outside that concentration?
North and Middle Forks organize the Vermilion River system
The terrain-and-water map is easiest to read by locating the North Fork Vermilion River and Middle Fork Vermilion River first. The North Fork descends through the eastern half from the north, while the Middle Fork approaches the central county from the west. The main Vermilion River label appears farther south in the broad Danville-area drainage, tying the forked river system to the county’s largest urban concentration.
Lake Vermilion lies along the North Fork side of the system, and Windfall Lake appears along the Middle Fork. Inland Sea and Long Pond are close together west of Danville, while Hershal Lake sits farther east. These named water bodies make the river map easier to orient because they provide fixed points between the long river branches and the finer network of tributaries.
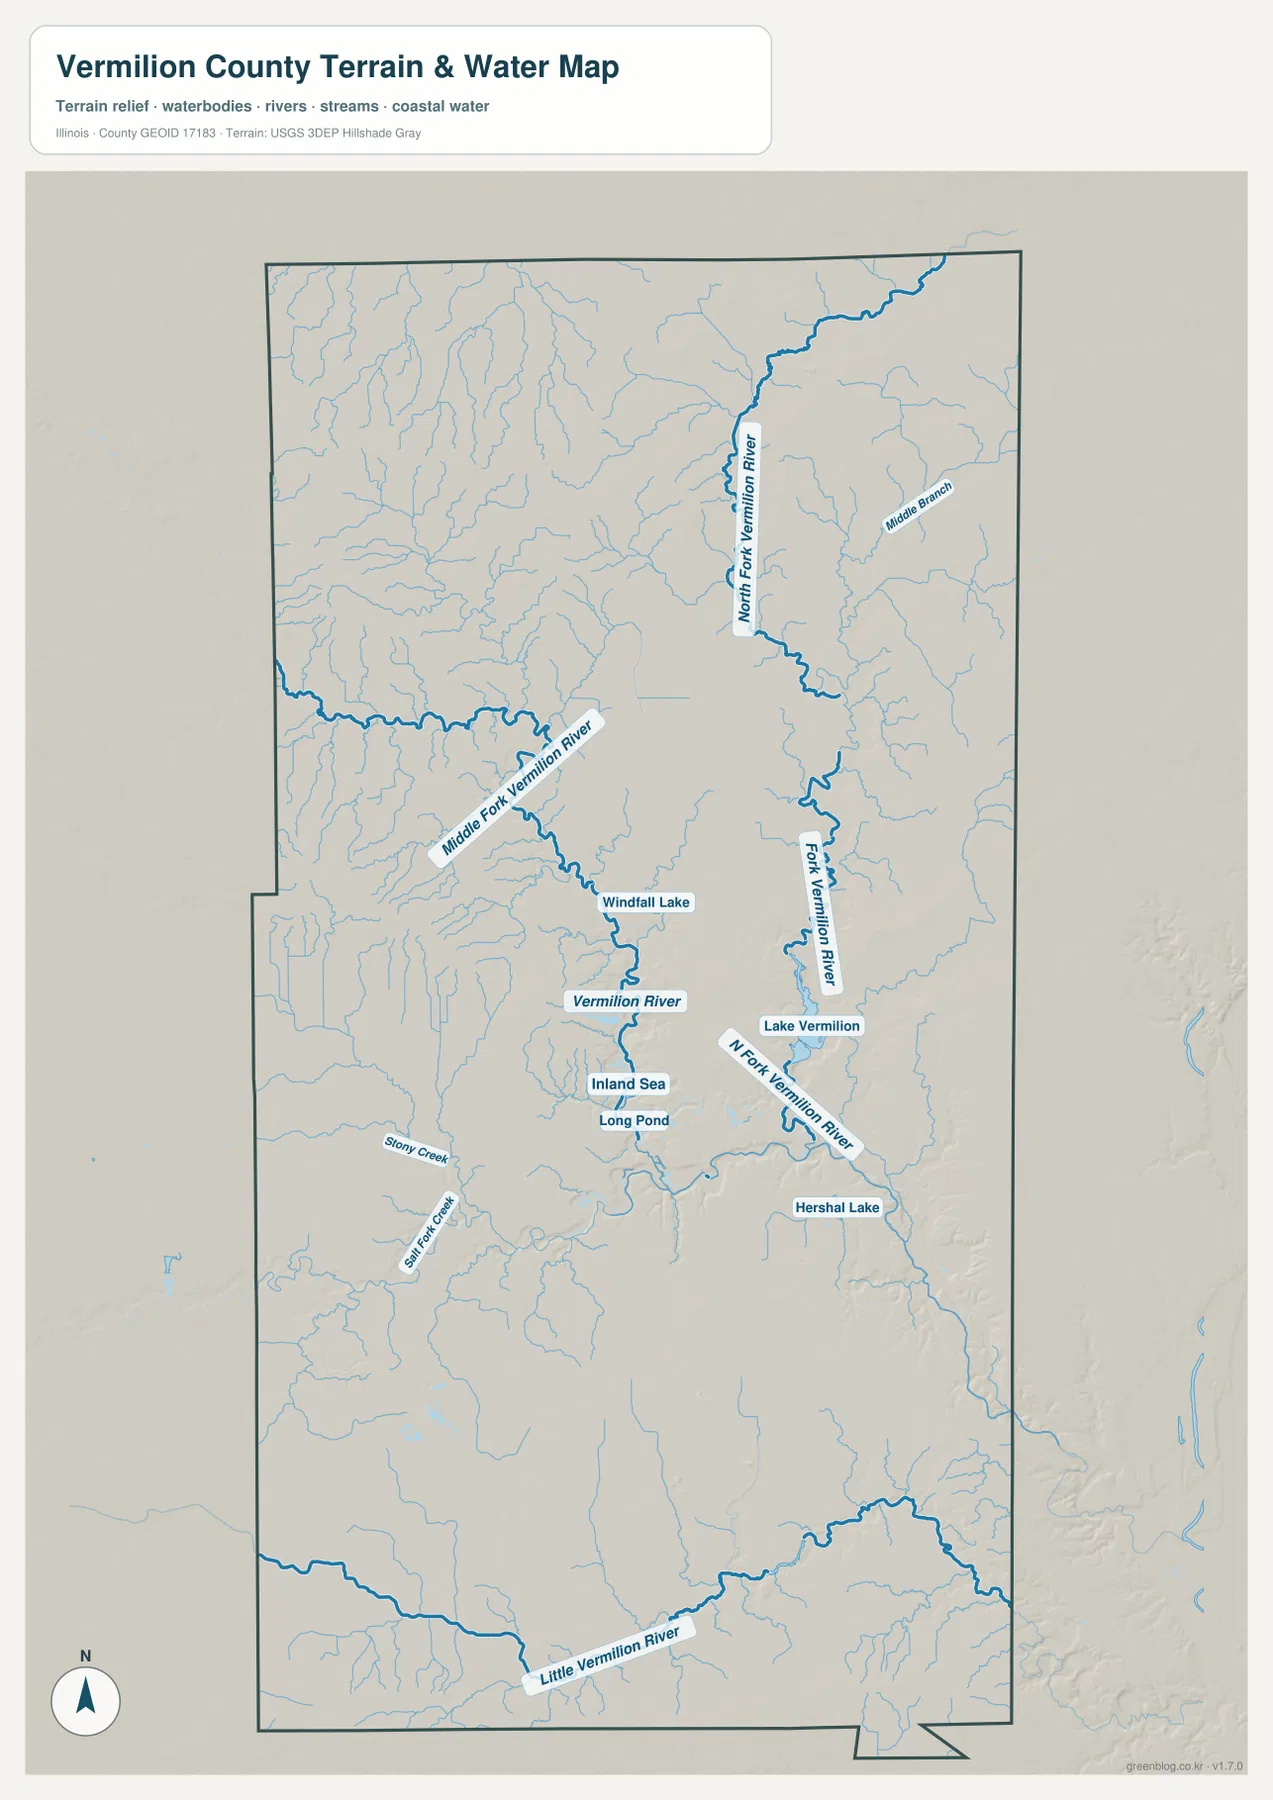
At the southern edge, Little Vermilion River creates a separate east-west water reference. Stony Creek and Salt Fork Creek are labeled in the southwest, and Middle Branch appears in the northeast. The map contains many fine blue tributaries, but it is not necessary to memorize every name. North Fork, Middle Fork, the main Vermilion River, and Little Vermilion River provide enough structure to understand how the county’s drainage is divided.
This layer is intended for general geographic reference rather than flood-hazard, water-quality, navigation, parcel, or legal-boundary decisions. A mapped river, creek, lake, or pond shows relative location, not public access or a current regulatory condition. Current recreation or management information for Lake Vermilion and county conservation properties should be checked with the relevant local authority.
A 150 to 243 meter range highlights northern hills and river valleys
The supplied elevation layer reports an actual range of about 150 to 243 meters and a mean near 207 meters. The lowest dark-green terrain follows the North Fork, Middle Fork, and other Vermilion River valleys, with especially broad low corridors around the Danville-area drainage. Warmer tan and brown terrain spreads across much of the north and northwest, where the land stands noticeably higher between the branching streams.
The northern uplands are not one smooth plateau. North Fork Vermilion River and many smaller tributaries carve narrow green valleys through the higher ground. The Middle Fork creates another major low corridor from the west toward the center. Around Danville, several valleys come close together, producing a much more deeply cut landscape than the simple road map suggests.
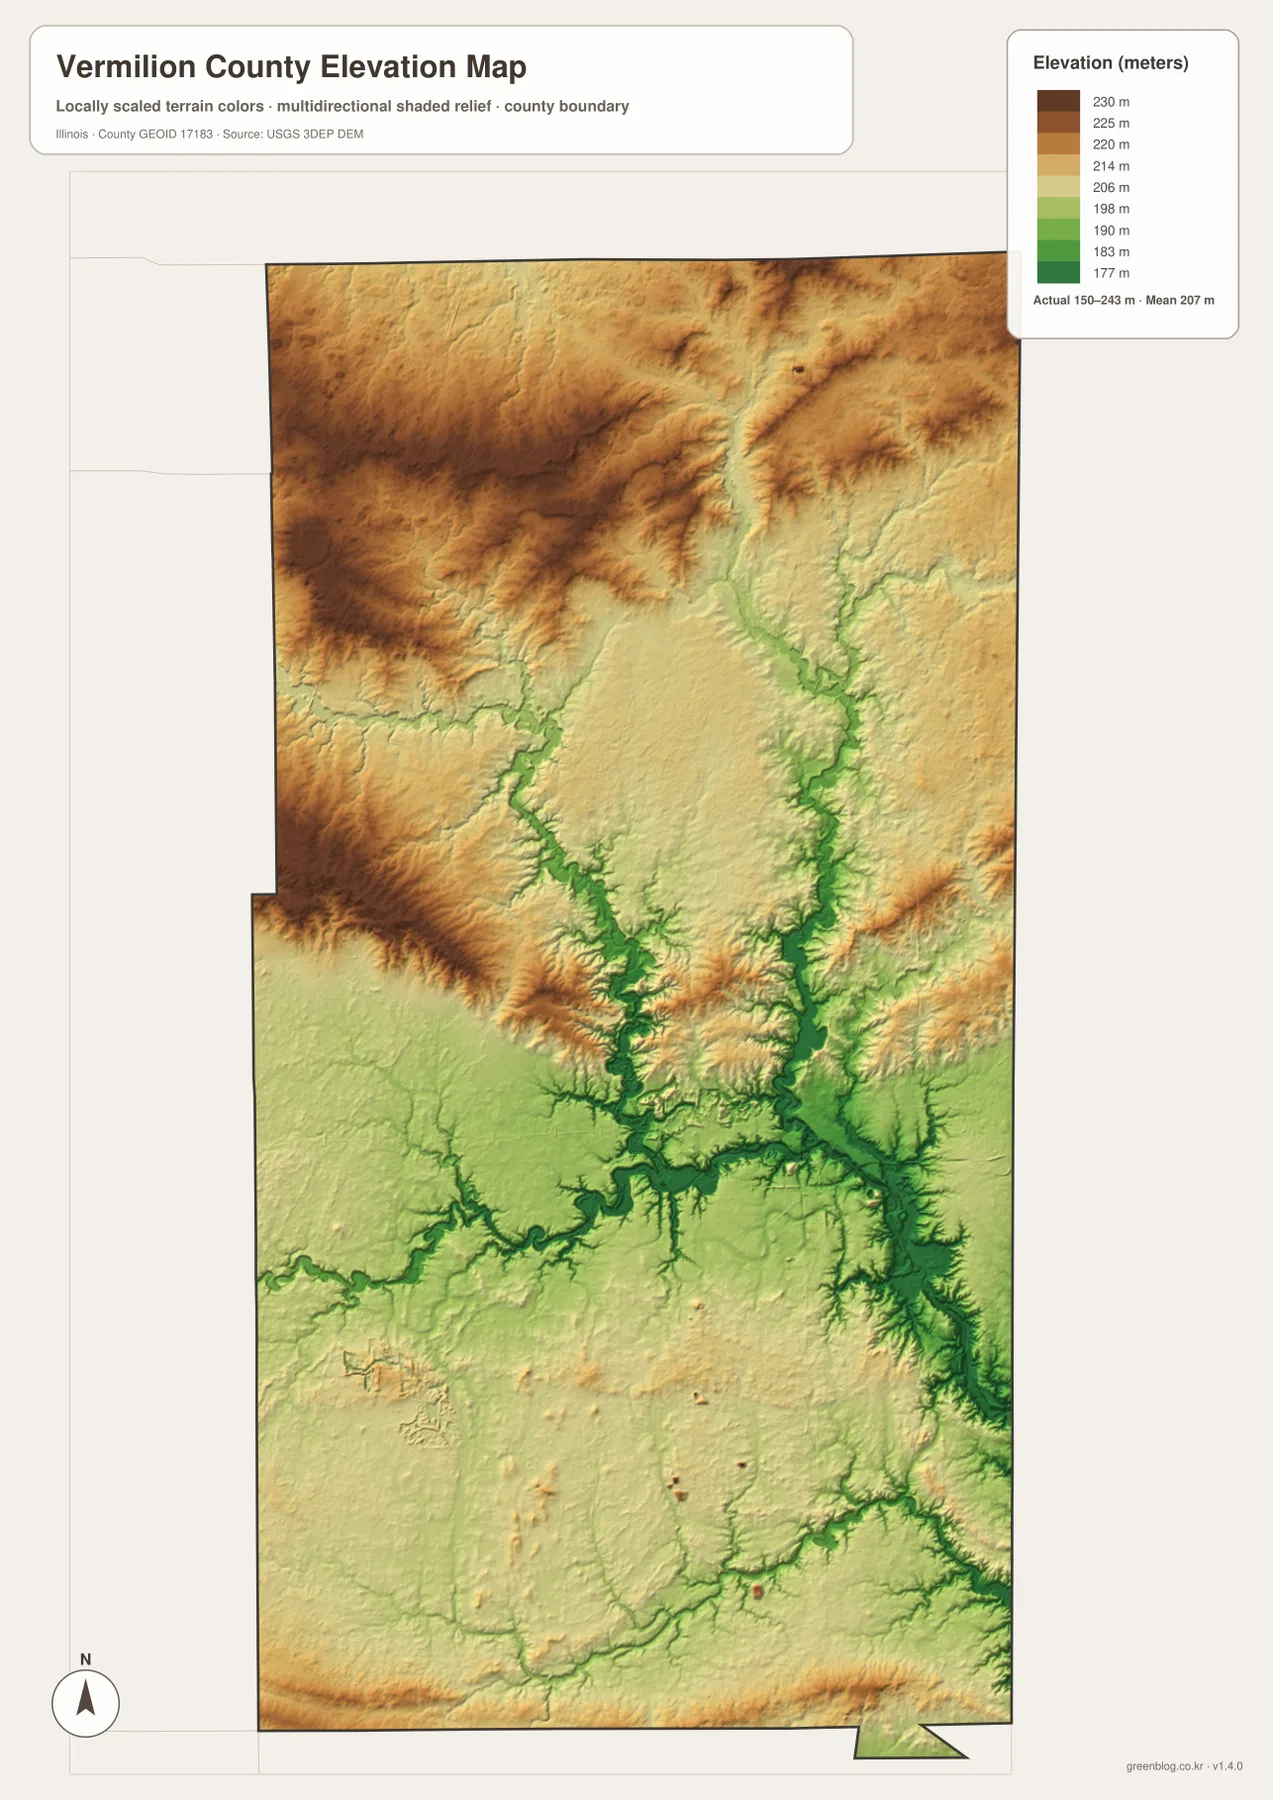
The southern half contains less extensive high brown terrain than the north, but it is not perfectly flat. Little Vermilion River and many smaller tributaries still form low green corridors across the landscape. Danville, Tilton, and Westville also sit close to lower river-cut terrain. A better description than simply “high north, low south” is that higher ridges are repeatedly divided by river and creek valleys, with the strongest uplands concentrated in the northern part of the county.
The elevation surface is intended for county-scale comparison, not parcel surveying or engineering design. The 150–243 m range is useful for identifying river valleys and surrounding hills, but it does not provide survey-grade elevation for a specific property. Construction, drainage, flood, and legal decisions require more precise and current source data.
A practical order for using the Vermilion County map set
For communities and roads, start with Danville and I-74, then trace the southeastern group through Tilton, Westville, Georgetown, and Catlin before moving north to Hoopeston. Use the city index when the main question is where the six highlighted cities are concentrated. For waterways, find North Fork and Middle Fork Vermilion River first, then add Lake Vermilion, the main Vermilion River, and Little Vermilion River. The elevation view is most useful after those waterways are familiar because it shows which green corridors are low and where the higher northern terrain rises around them.
The ZIP below contains four high-resolution JPG files matching the county-and-road map, city index, terrain-and-water map, and elevation map on this page. Each image is 2572 × 3638 pixels in portrait orientation, making small road and stream labels easier to enlarge or print than in the browser-sized WebP versions. These maps are general reference products, so current traffic, legal parcel boundaries, flood determinations, water regulations, and survey-grade elevations should be checked against the appropriate official source.
Frequently Asked Questions
Where are the highlighted major cities concentrated in Vermilion County?
Most are concentrated in the southeast around Danville. Tilton lies immediately southwest, Westville and Georgetown farther south, and Catlin to the southwest. Hoopeston is the major exception because it is shown far to the north near the county’s upper edge.
Which map best shows the North and Middle Forks of the Vermilion River?
The terrain-and-water map is the clearest choice. It shows North Fork Vermilion River, Middle Fork Vermilion River, the main Vermilion River, Lake Vermilion, Windfall Lake, and Little Vermilion River in the same county view. It is a general geographic reference rather than a flood, navigation, or legal-water-boundary map.
What elevation range is shown for Vermilion County?
The supplied elevation layer reports an actual range of about 150 to 243 meters and a mean near 207 meters. River valleys appear as lower green corridors, while broad higher terrain is concentrated across the north and northwest.
Map File Information
The ZIP contains high-resolution A3 JPG versions of the Vermilion County road-and-boundary map, major-city index, terrain-and-water map, and elevation map.
- Printable Size: 2572 × 3638 pixels each
- File Type: ZIP containing 4 JPG files
Related Maps
Sources and references
- Official Vermilion County website – county government and local information
- Vermilion County Conservation District – county parks, natural areas, and Lake Vermilion references
- U.S. Census Bureau TIGER/Line Shapefiles – county boundaries, roads, and place references
- USGS National Hydrography – rivers, streams, and lakes
- USGS 3D Elevation Program – elevation and terrain reference
Green Map creates custom-edited map images using open geographic data sources such as geoBoundaries, Natural Earth, OpenStreetMap, and government open data.
These maps are edited visual materials, not raw data files, and are provided for education, documents, presentations, and graphic reference.