Agriculture dominates Decatur County in the supplied 2025 classification, but the county is not simply one continuous field. Cropland covers 73.07%, forest accounts for 15.91%, and developed land reaches 10.30%. The largest built concentration sits around Greensburg, while wooded patches become more noticeable through the southern half and along several branching strips elsewhere. This Decatur County Indiana Land Cover Map set separates those patterns into current cover, forest and farmland, impervious surface, and a 1985–2025 endpoint comparison.
Four WebP previews are placed beside the discussion. The same four maps are available as original 2480 × 1754-pixel JPG files in one ZIP near the end of the page. They can be used for county profiles, classroom comparisons, presentations, and reference graphics when the goal is to explain where agriculture, forest, built surfaces, water, and mapped class differences occur.
Table of Contents
A 73.07% agricultural county still has a clear center, wooded breaks, and small water features
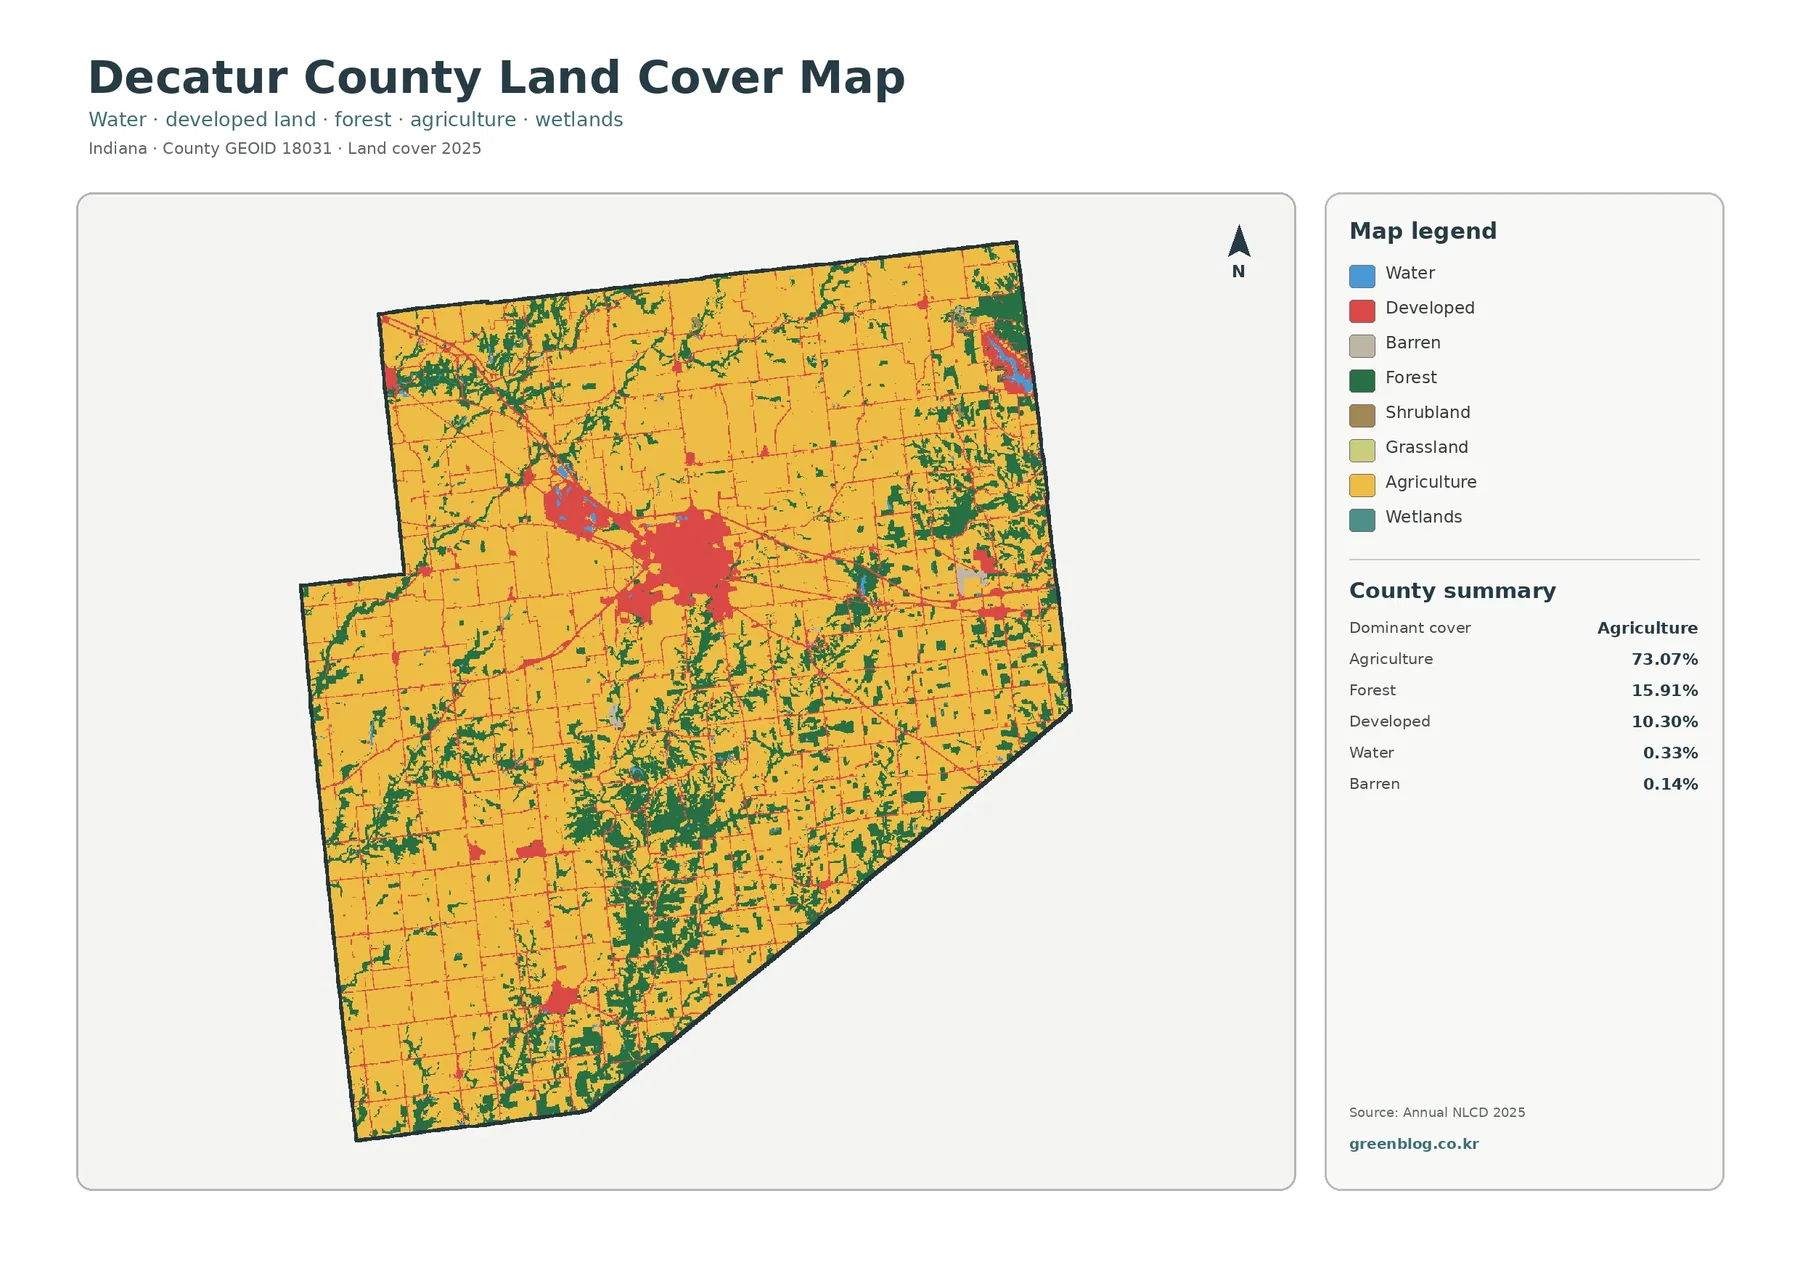
Yellow agricultural cells cover most of the county from north to south. The largest uninterrupted blocks are especially easy to see across the northern and western portions, where field-shaped areas are divided by thin developed lines and scattered forest. The dominance of agriculture is therefore obvious at county scale, yet the map also contains enough green and red to show that the landscape changes substantially around settlements and more wooded terrain.
Forest is the second-largest class at 15.91%. Dark green is more concentrated in the south-central and southeastern parts of the county, with additional branching patches in the northwest and northeast. These forest areas are rarely shaped like the broad rectangular agricultural blocks. They tend to follow irregular edges and appear as larger clusters, narrow strips, and smaller fragments between fields. That contrast makes the southern half look more mixed even though agriculture remains the leading class countywide.
Developed cover totals 10.30%. The broadest red concentration aligns with Greensburg, the county seat, and smaller developed pieces appear farther east, southwest, and around other rural locations. Decatur County’s official history page places the county in southeastern Indiana at the intersection of Interstate 74 and State Road 3 and identifies Greensburg as the county seat. That official context helps explain the location of the main center, but the land-cover preview does not contain municipal boundaries or road labels, so it should not be treated as a street or zoning map.
Open water represents 0.33%, while wetlands account for 0.12% and barren land for 0.14%. Those percentages are small, yet blue water cells remain visible in a few localized places, including the northeastern side of the county. Small classes can matter greatly at a specific site even when they contribute little to the countywide total. For that reason, a percentage table should be read together with the actual location of each color.
The 1985–2025 comparison is led by mixed class differences, not by one simple growth story
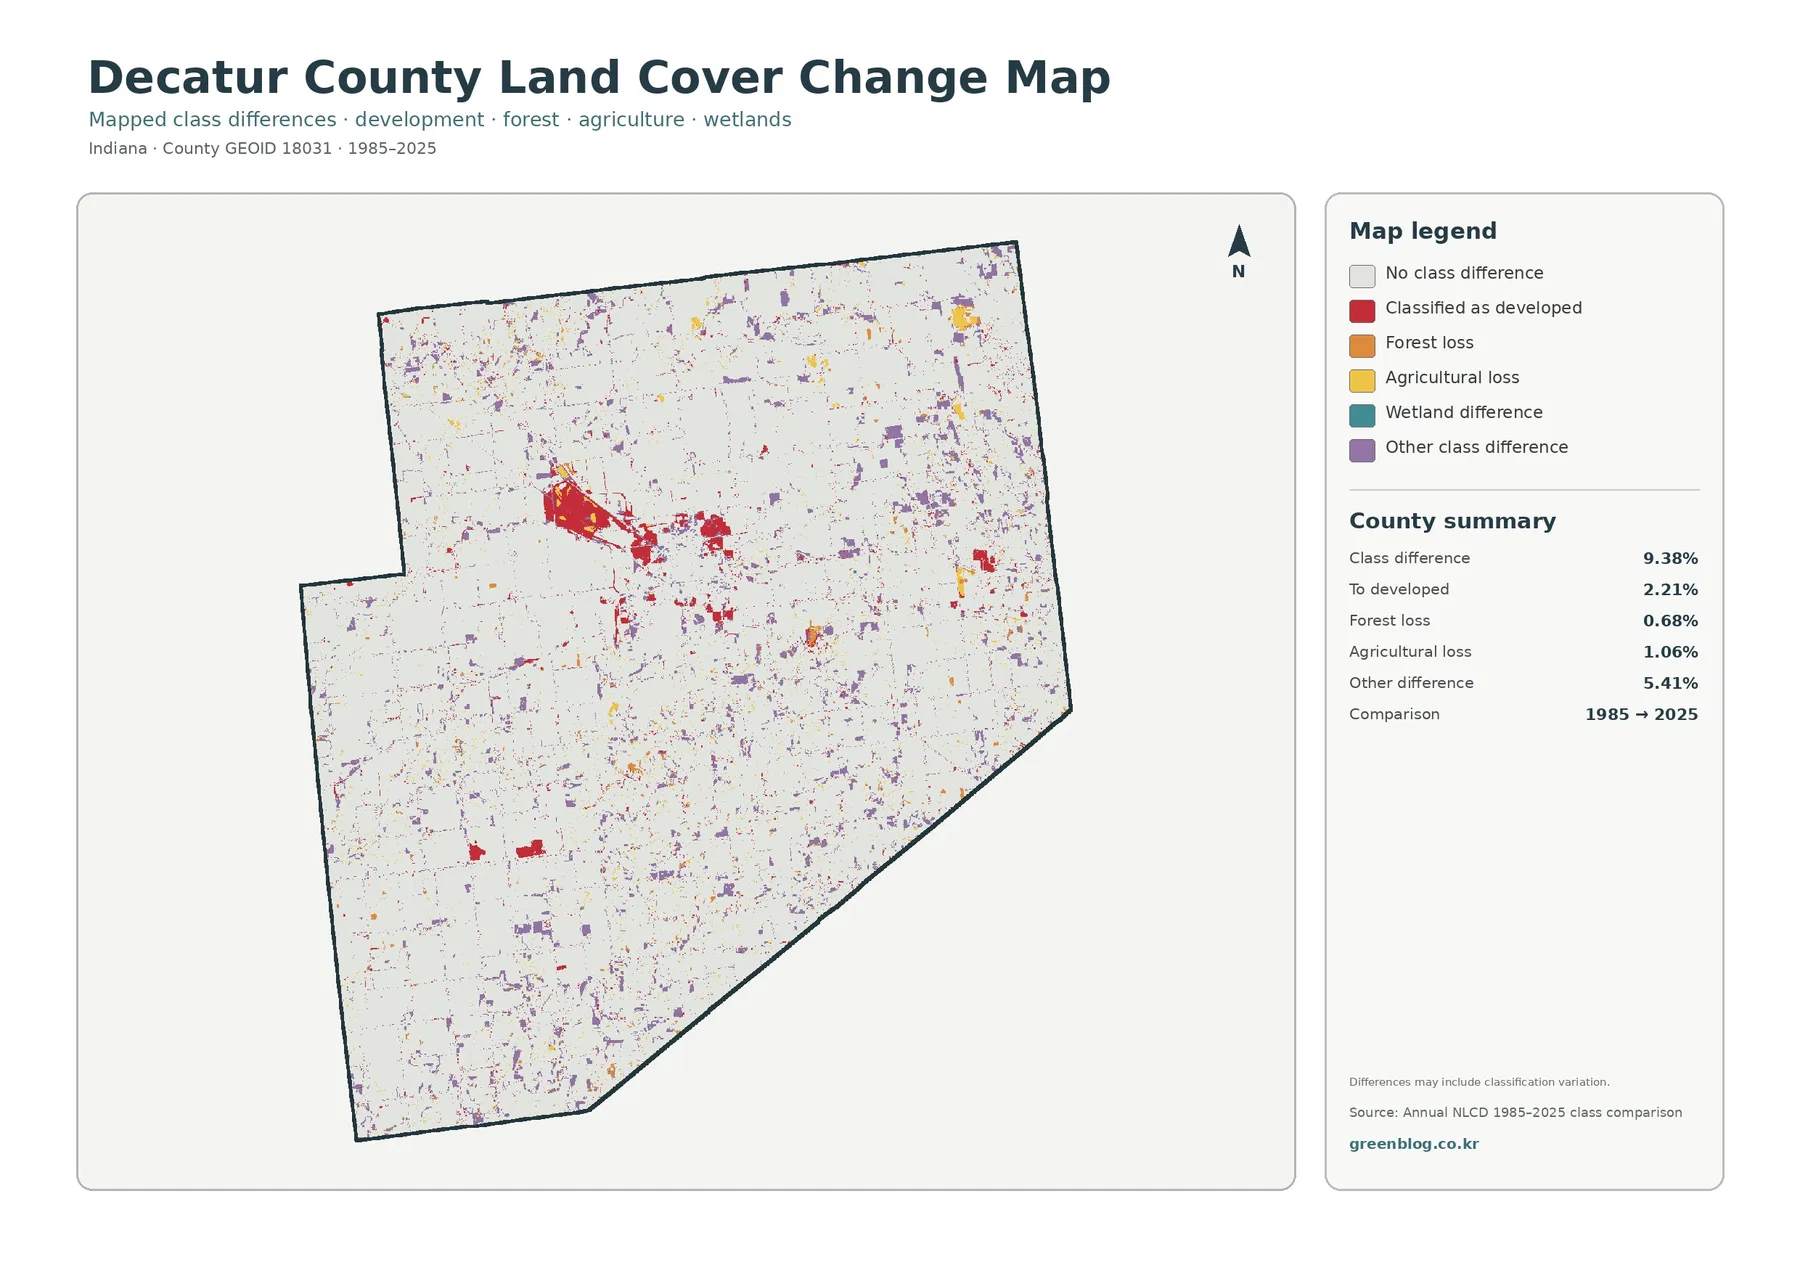
The change map reports a total class difference of 9.38% between the 1985 and 2025 endpoints. The listed components are 2.21% classified as developed, 0.68% forest loss, 1.06% agricultural loss, and 5.41% other class difference. Wetland difference appears in the legend but is not given a separate percentage in the summary, so it should not be reconstructed from rounding or presented as a new official statistic.
Red developed-conversion cells are most concentrated around Greensburg and immediately to its northwest, with smaller red patches elsewhere. Purple “other class difference” is much more broadly scattered across the county and is the largest listed component. Orange forest-loss and yellow agricultural-loss cells are also dispersed rather than forming one single band. The map therefore does not support a claim that all 9.38% represents urban expansion or land degradation.
A loss label has a narrow technical meaning here: a cell that belonged to forest or agriculture at the earlier endpoint received another class at the later endpoint. It does not identify logging, subdivision construction, field abandonment, flooding, storm damage, restoration, or classification error as the cause. The map itself notes that differences may include classification variation. Establishing timing and cause would require intermediate imagery, aerial photographs, permits, or local records.
Current developed cover and developed conversion should also remain separate. The 10.30% developed figure describes all cells classified as developed in 2025. The 2.21% conversion figure identifies a subset of cells whose endpoint class changed to developed. Long-established developed areas can appear as “no class difference” on the comparison map, so subtracting or adding these percentages does not produce a valid growth rate.
Hard surfaces are concentrated around Greensburg even though the countywide mean is only 2.84%
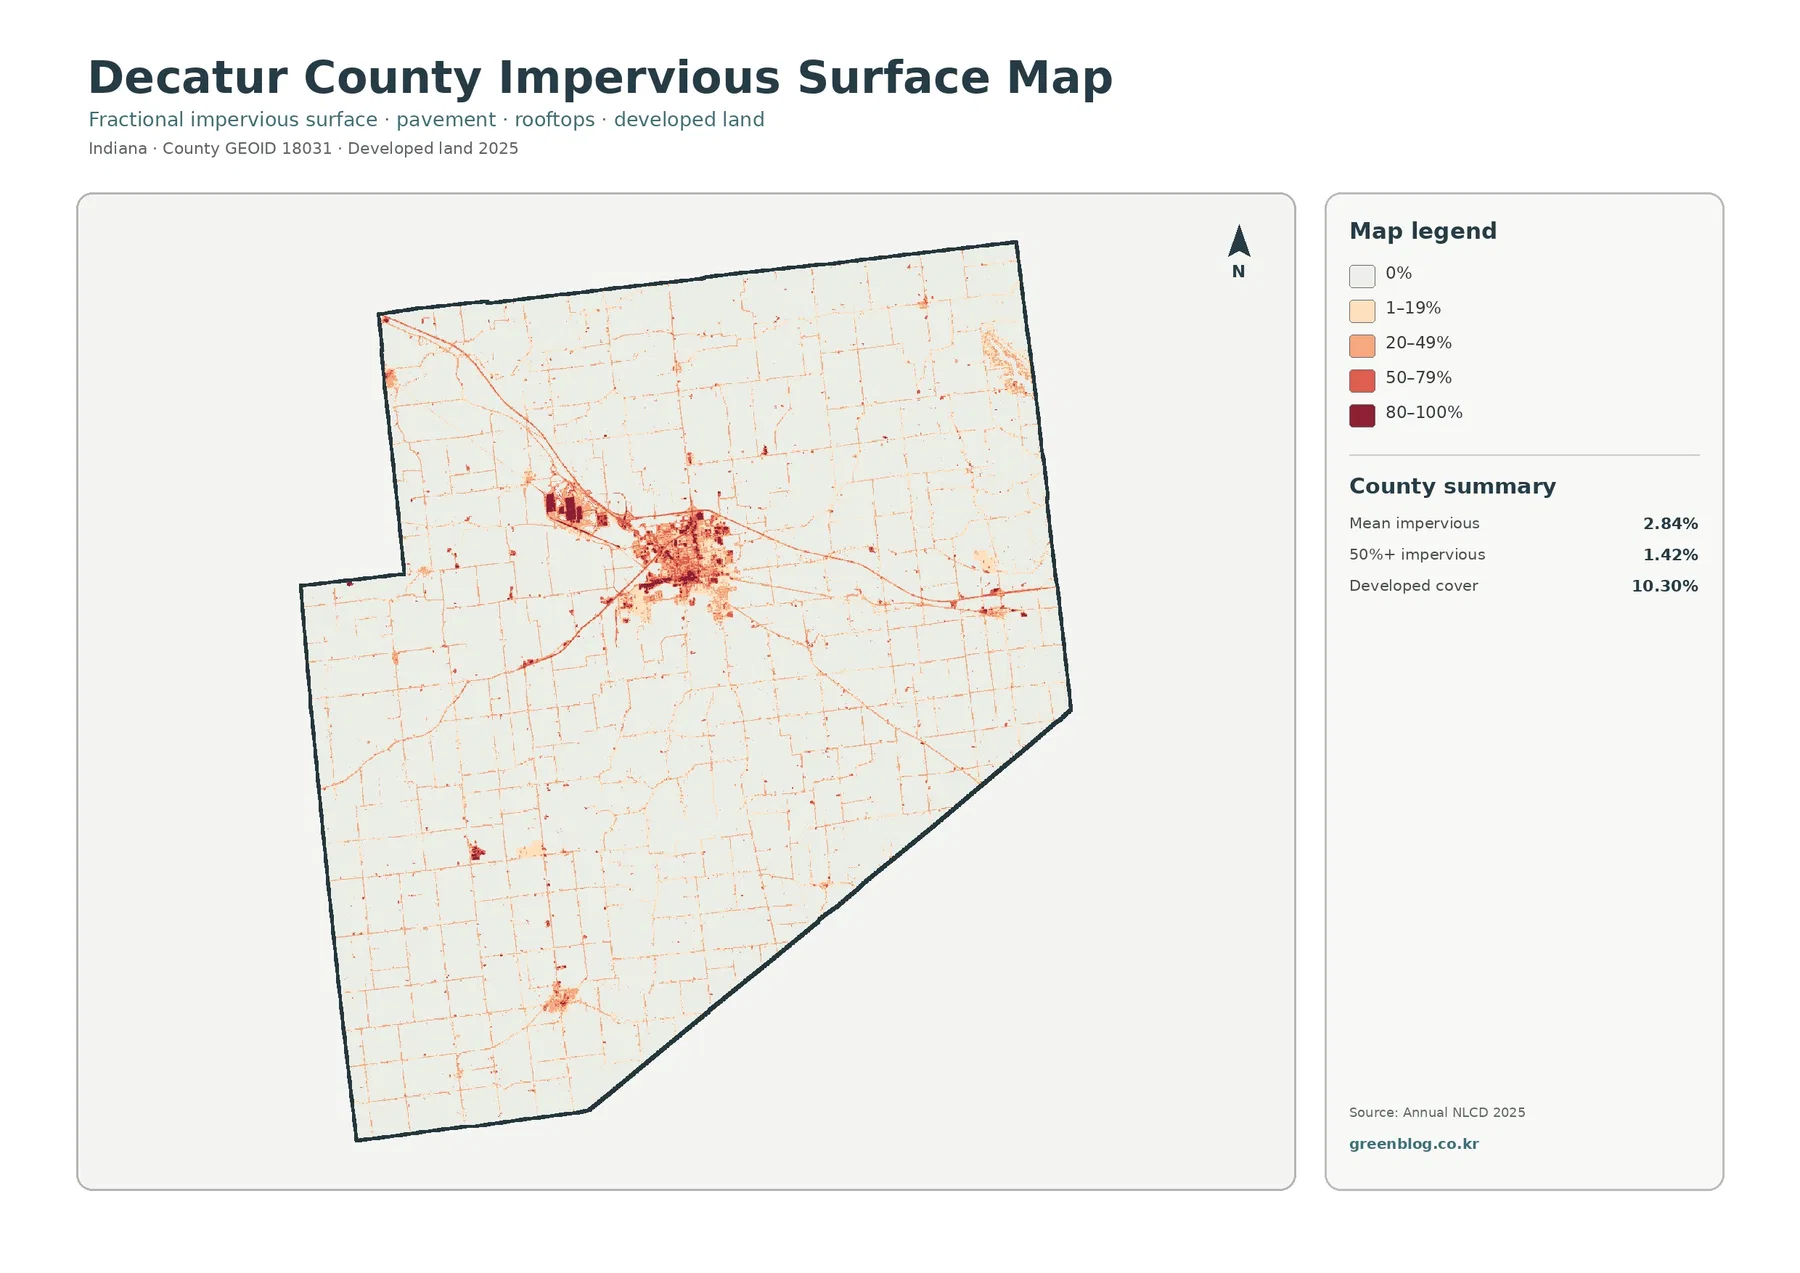
Mean impervious cover is 2.84%, and 1.42% of the county is mapped at 50% impervious or greater. Both values are well below the 10.30% developed share. Developed land-cover classes can include lawns, trees, exposed soil, and other permeable surfaces around roads and buildings, while the impervious layer concentrates on hard materials such as roofs and pavement. The two measures describe related but different aspects of development.
The darkest tones form a compact cluster around Greensburg. Another strong group appears immediately northwest of the main center, and thinner lines extend outward through the surrounding agricultural landscape. Smaller nodes can be seen in other parts of the county. Because the preview does not label individual roads, factories, commercial areas, or neighborhoods, those shapes should be described as mapped hard-surface concentrations unless a separate official map is used to identify them.
A county mean can hide this sharp contrast. Most rural agricultural areas fall near the lightest categories, while central developed locations contain many cells in the higher ranges. That difference makes the impervious map useful when a presentation needs to compare a town center with surrounding farm country. It can also provide context for runoff questions, although flood or drainage analysis would additionally require rainfall, soils, topography, streams, drainage infrastructure, and current regulatory information.
Fading developed land exposes a north–south difference in the forest-and-farmland pattern
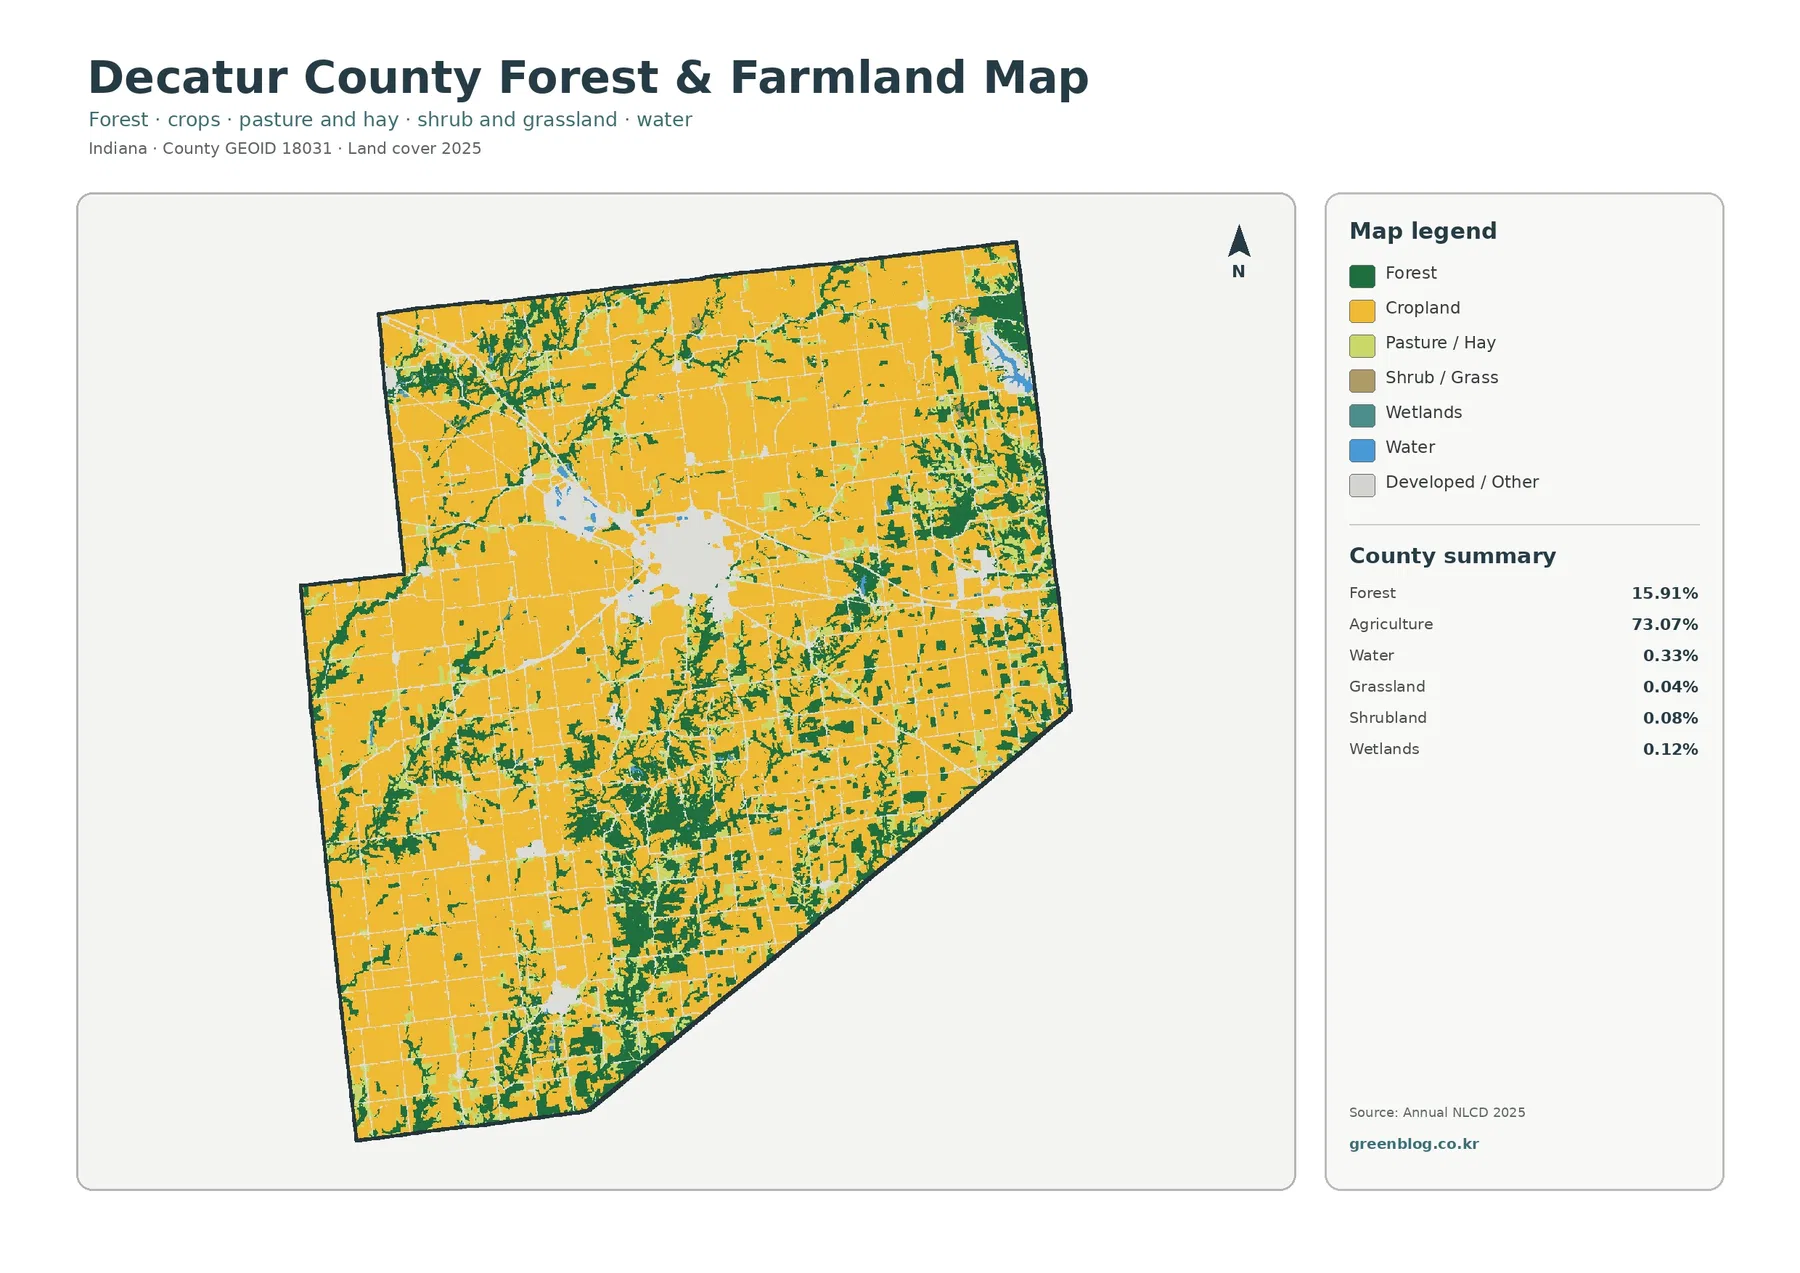
The vegetation-focused map makes the 73.07% agricultural share even more prominent because developed and miscellaneous surfaces are faded. Across the north, large yellow field blocks remain comparatively continuous. Moving into the southern half, green forest occupies more space and breaks the agricultural pattern into smaller pieces. The result is not a simple east-versus-west split; instead, the southern interior carries a noticeably stronger mixture of woods and fields.
Grassland is listed at 0.04% and shrubland at 0.08%, both too small to form large countywide zones in this summary. Wetlands account for 0.12%. These minor classes can appear along edges or within mixed landscapes, but they should not be enlarged conceptually into distinct land-management areas. Annual NLCD is a raster classification, meaning the county is represented by 30-meter cells and each cell receives a predominant class even when several surface types occur inside it.
That cell-based structure is especially important in farm country. A straight yellow edge can resemble a legal field or parcel boundary, yet a narrow tree row, ditch, farm lane, grass strip, or small pond may be absorbed into a surrounding class. The map is useful for county-scale pattern comparison, not for measuring a farm boundary or determining ownership. Parcel surveys, current aerial imagery, and local records are required for site-level questions.
Purdue Extension maintains a Decatur County Agriculture & Natural Resources program with local resources, including soil sampling and testing information. That material can support deeper research about agricultural conditions in the county, but it serves a different purpose from the 73.07% land-cover statistic. The map summarizes classified surface cover across the county; Extension resources address management, soils, crops, and practical agricultural questions.
A small northeastern water-and-development cluster deserves attention even though water is only 0.33%
The northeastern edge contains a visible combination of blue water, nearby developed cells, and surrounding forest or agriculture. Lake Santee is listed among Decatur County communities, and local Lake Santee information places the lake northeast of Greensburg. The mapped location is consistent with that setting. Even so, the preview has no place label or shoreline name, so exact identification and boundary work should be done with a labeled hydrography or local reference map.
This example also shows why countywide percentages can understate the importance of localized features. Water is only 0.33% of the county, but a lake can still be a defining element for the surrounding community. A county profile might use the full land-cover map to show how rare open water is overall and then point to the northeastern concentration as an exception. Regulatory wetlands, shoreline rules, flood zones, and property boundaries require separate current sources.
Planning maps and land-cover maps answer different questions about the same ground
Land cover describes what the surface is classified as from imagery: crop, forest, developed surface, water, and related categories. Zoning describes legal land-use districts, and parcel maps describe property or survey units. A red developed cell does not prove that the land is zoned residential or commercial. Likewise, a yellow agricultural cell does not establish an agricultural zoning district, ownership, a crop type, or a legal farm boundary.
Decatur County’s Area Plan Office separately provides comprehensive-plan, zoning, stormwater, highway, and permit resources. Those sources should take priority when the question concerns building permission, future land-use policy, flood-hazard regulation, roadway standards, or other legal and administrative matters. The land-cover maps are better suited to broad visual comparison of the observed surface.
The distinction matters when looking at growth around Greensburg. The change map can identify cells classified differently at the two endpoints, but it cannot show which project caused a change or whether a parcel was rezoned. A planning document may identify intended future land uses even where the 2025 image still classifies the surface as agriculture or forest. Using both sources together is useful, but their meanings should not be merged.
Choose the current-cover map first, then add the view that matches the question
For a general county introduction, start with the 2025 land-cover map. It places the agricultural majority, Greensburg, wooded southern areas, and localized water in one frame. If the subject is working land and natural vegetation, follow with the forest-and-farmland map. If the question is about buildings and paved surfaces, use the impervious map. The endpoint-change map works best after current conditions have already been established.
This sequence reduces two common mistakes. First, viewers are less likely to confuse a change color with the current land-cover class at that location. Second, they are less likely to treat the impervious percentage as another name for developed cover. Each map emphasizes a different property of the same county, so the strongest explanation usually uses one primary image and one supporting comparison rather than asking a single map to answer every question.
In a classroom, students can compare the relatively continuous northern farmland with the more mixed southern forest-and-farm pattern. In a county profile, the overall map and impervious layer can explain why Greensburg stands out from the surrounding agricultural grid. In an environmental presentation, the current map can establish water and forest locations before the change layer is introduced. These are reference uses, not substitutes for engineering, wetland-jurisdiction, survey, or permitting products.
Scale, date, and mixed cells set practical limits on how far the maps can be pushed
The current maps represent the supplied 2025 observation year. Construction, harvest, vegetation recovery, road work, or water conditions after that year may not be reflected. The 1985–2025 comparison uses two endpoints and therefore cannot show every intermediate transition. A cell may have changed more than once between those dates and still finish with the same class at both endpoints.
Annual NLCD uses 30-meter cells, which are appropriate for county-scale analysis but coarse for individual properties. Zooming the JPG enlarges the colored squares; it does not reveal parcel details that were never present in the source. Mixed pixels can occur where fields, woods, yards, roads, ditches, and buildings share a cell, so boundaries should be treated as generalized.
Each original JPG measures 2480 × 1754 pixels. That size works well for screen graphics, document layouts, presentations, and many ordinary print uses. The package does not mark the files as meeting an A3 high-resolution reference, so large-format printing should be tested first to make sure labels and legend text remain clear at the intended size.
Frequently Asked Questions
Is Decatur County almost entirely farmland because agriculture is 73.07%?
Agriculture is clearly the dominant class, but the county is not uniform. Forest accounts for 15.91% and becomes more noticeable through the southern half, while Greensburg forms the largest developed concentration. Localized water and smaller developed nodes also interrupt the agricultural pattern. The percentage is best understood together with the map rather than as a description of every location.
Why is developed cover 10.30% while mean impervious cover is only 2.84%?
Developed land-cover classes can include permeable surfaces such as lawns, trees, and open soil around buildings and roads. Impervious cover focuses on roofs, pavement, parking areas, and similar hard materials. Because those hard surfaces occupy only part of many developed cells, the countywide impervious mean is lower than the developed share.
Does the 9.38% class difference mean that 9.38% of Decatur County was damaged after 1985?
No. It is the share of cells that received different endpoint classes in 1985 and 2025, and the comparison may include both real surface change and classification variation. “Other class difference” alone accounts for 5.41% of the listed summary. Timing and cause require intermediate imagery and local records rather than the endpoint map by itself.
Sources and Reference Data
- MRLC Annual NLCD Data – official access point for annual land-cover and comparison products
- USGS Annual NLCD Land Cover Classification – definitions and guidance for agriculture, forest, developed land, water, and related classes
- U.S. Census Bureau TIGER/Line Shapefiles – official county-boundary reference for Decatur County
- Decatur County, Indiana – History – official county context identifying Greensburg as the county seat and the I-74/State Road 3 setting
- Purdue Extension – Decatur County Agriculture & Natural Resources – local agriculture, natural-resource, soil-sampling, and educational information
- Decatur County Area Plan – county planning, zoning, stormwater, highway, and permitting resources
Map File Information
The ZIP contains four original JPG maps for comparing Decatur County agriculture, forest, Greensburg-area development, impervious surfaces, and 1985–2025 endpoint class differences.
- Included Files: General land cover, forest and farmland, impervious/developed surface, and land-cover change maps
- File Type: Four original JPG map files bundled in one ZIP archive
- Intended Use: Printing, education, presentations, and map-based projects
Related Maps
- Adams County Indiana Land Cover Map
- Allen County Indiana Land Cover Map
- Bartholomew County Indiana Land Cover Map
Green Map creates custom-edited map images using open geographic data sources such as geoBoundaries, Natural Earth, OpenStreetMap, and government open data. These maps are edited visual materials, not raw data files, and are provided for education, documents, presentations, and graphic reference.