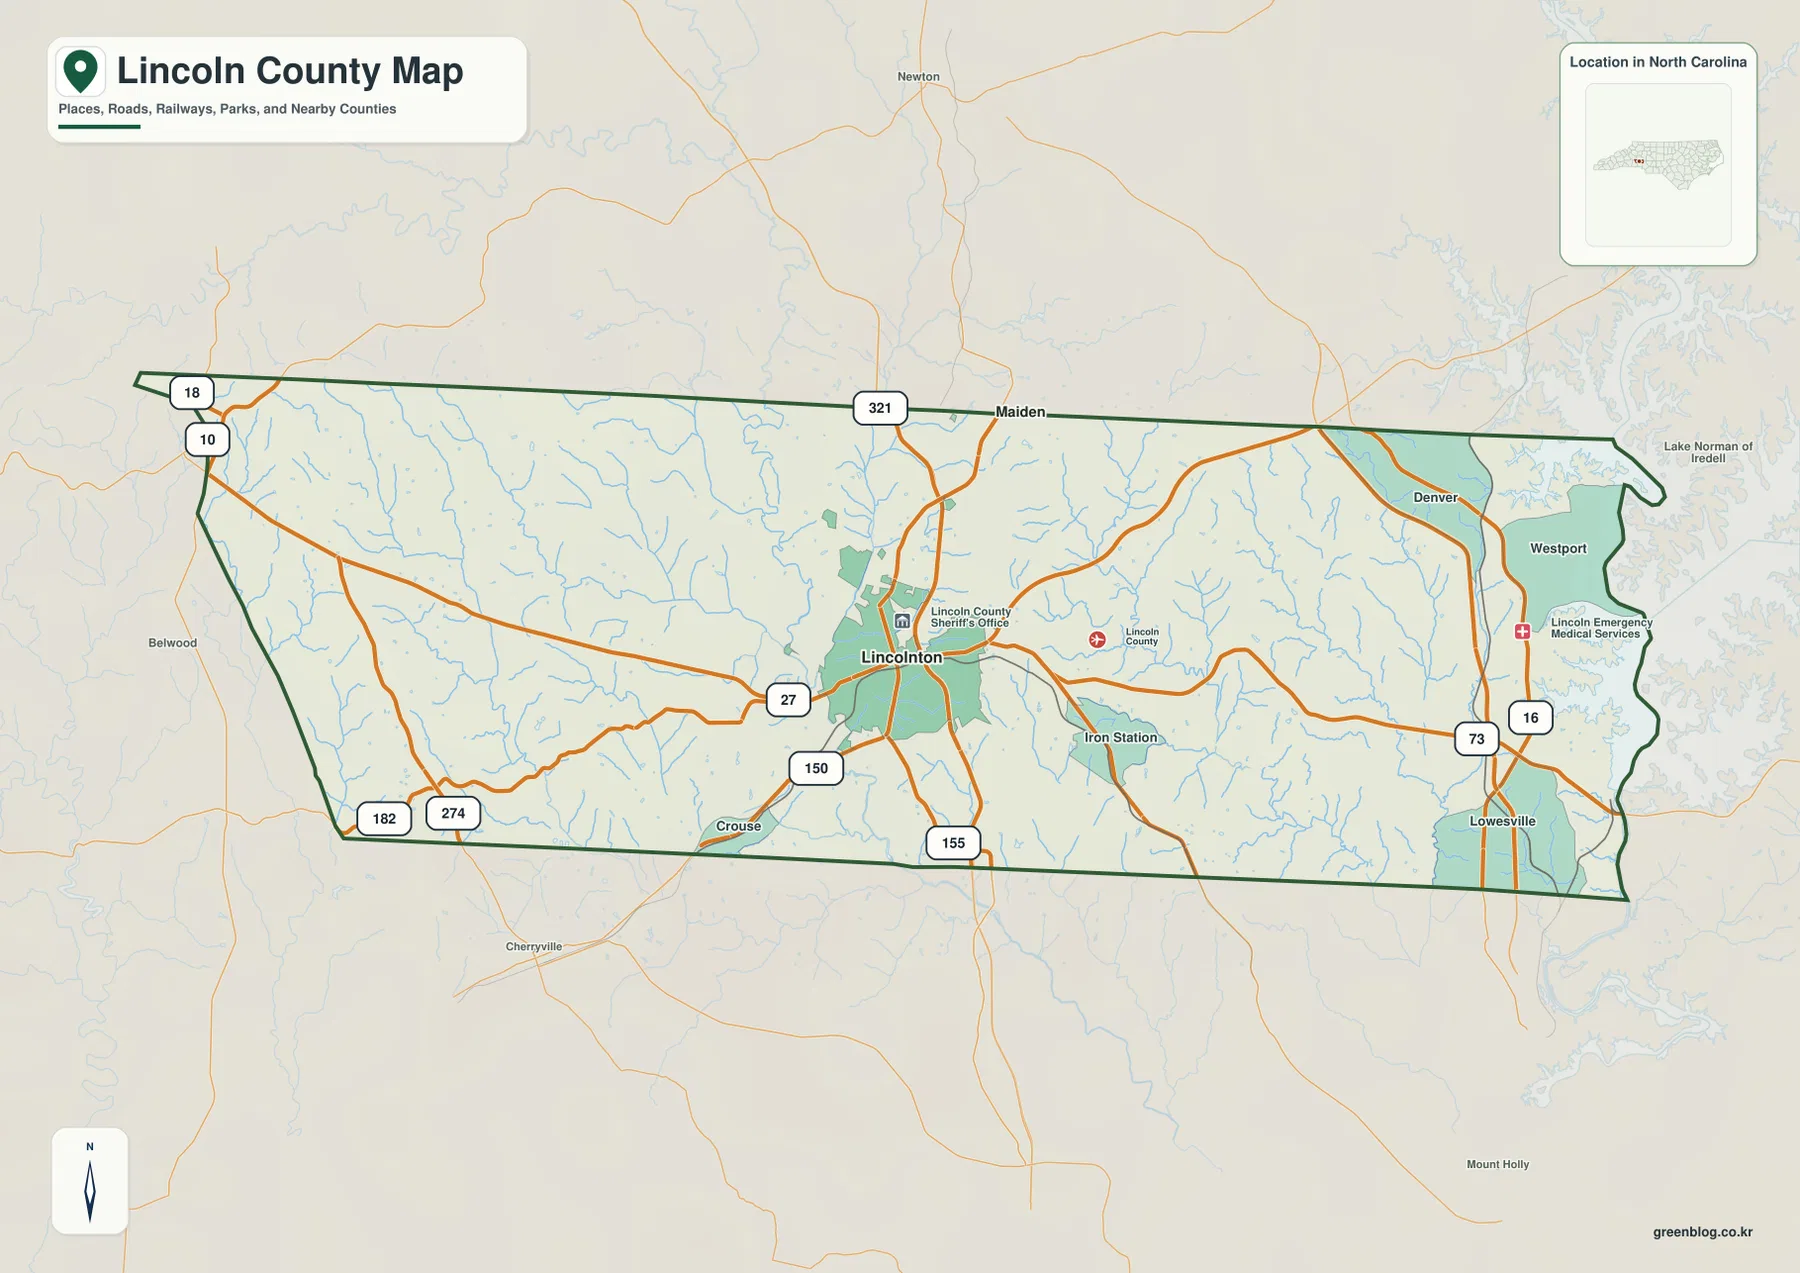
The Lincoln County North Carolina Map is most useful when you start with Lincolnton and then follow the county east toward Denver, Lake Norman, and the Catawba River. The general county map combines place names, county boundaries, waterways, and labeled roads, while the city map strips the view down to the county’s ranked major city. A third map gives rivers, creeks, lakes, and terrain relief more visual weight. High-resolution JPG versions of these same map types are available in the ZIP download near the end of the article.
Lincoln County is not a place where one label explains the whole map. Lincolnton sits in the west-central part of the county and serves as the county seat, while Denver lies much farther east near Lake Norman. Iron Station falls between those two reference points, and Lowesville and Westport help define the southeastern and eastern side. Reading the county in that order makes the internal differences easier to understand: the inland road network gathers around Lincolnton, but the eastern edge is increasingly shaped by the large Catawba River and Lake Norman water boundary.
The supplied package contains only the county map, city map, and terrain-and-water map, so the discussion stays within what those images show. There is no separate land-cover map, parcel map, flood map, or numerical elevation map in this set. That distinction matters because the maps are intended for general geographic reference. They can help a reader place communities, compare roads, and follow waterways, but they should not be treated as engineering, legal-boundary, or hazard-analysis products.
Table of Contents
Lincolnton gives the county a clear inland reference point
Lincolnton is the first place to establish when reading the maps. The current county information identifies it as the county seat, and the city map ranks Lincolnton as the single major city in its index. On the detailed county map, the Lincoln County Sheriff’s Office is labeled immediately north of the built-up Lincolnton area, reinforcing the administrative role of this part of the county. Lincolnton is not located at the far western edge; it sits closer to the west-central interior, which leaves a substantial stretch of county between the seat and the Lake Norman side.
The surrounding county names provide a broader frame. The supplied article data lists Catawba, Cleveland, Gaston, Iredell, and Mecklenburg as neighboring counties. The detailed map also leaves several outside places visible in the background, including Newton and Maiden to the north, Cherryville toward the southwest, and Mount Holly to the southeast. Those outside labels are best used for orientation rather than for detailed navigation, because the mapped product is centered on Lincoln County and does not attempt to document every road or municipal boundary beyond it.
- County seat: Lincolnton
- Mapped place references: Lincolnton, Denver, Iron Station, Lowesville, Westport, and Crouse
- Major eastern water reference: Lake Norman and the Catawba River
- Maps in this package: county reference map, city map, and terrain-and-water map
Road 27 links the Lincolnton area to a different eastern road pattern
On the detailed county map, the road labeled 27 is one of the easiest lines to follow across the middle of Lincoln County. It passes through Lincolnton and continues east toward the Iron Station side before meeting the denser group of roads near the southeastern part of the county. Around Lincolnton, roads 150 and 155 extend southward, while 321 runs north from the area toward Maiden. This concentration of labeled routes helps explain why Lincolnton works so well as a starting point: it is both an administrative reference and a practical road-map reference.
The eastern side looks different. Denver appears close to the Lake Norman shore, Westport sits in the eastern projection of the county, and Lowesville is positioned farther south near roads 16 and 73. Iron Station lies between Lincolnton and this southeastern group, making it a useful intermediate place when comparing the inland county with the Lake Norman side. The map does not need a separate metropolitan-growth diagram to show that these locations face a different geographic setting; the large lake and the north-south road pattern are already visible beside them.
Western Lincoln County has its own set of road references. Labels 182 and 274 appear near the southwestern border, while 10 and 18 are shown near the northwest corner. Crouse lies close to the southern boundary, with Bellwood and Cherryville visible outside the county as nearby reference places. This part of the map has no large reservoir dominating the edge. Instead, smaller streams cut across the interior, so the combination of roads and drainage lines gives the western side a more inland appearance than the Lake Norman-facing east.
The city index intentionally reduces the county to Lincolnton
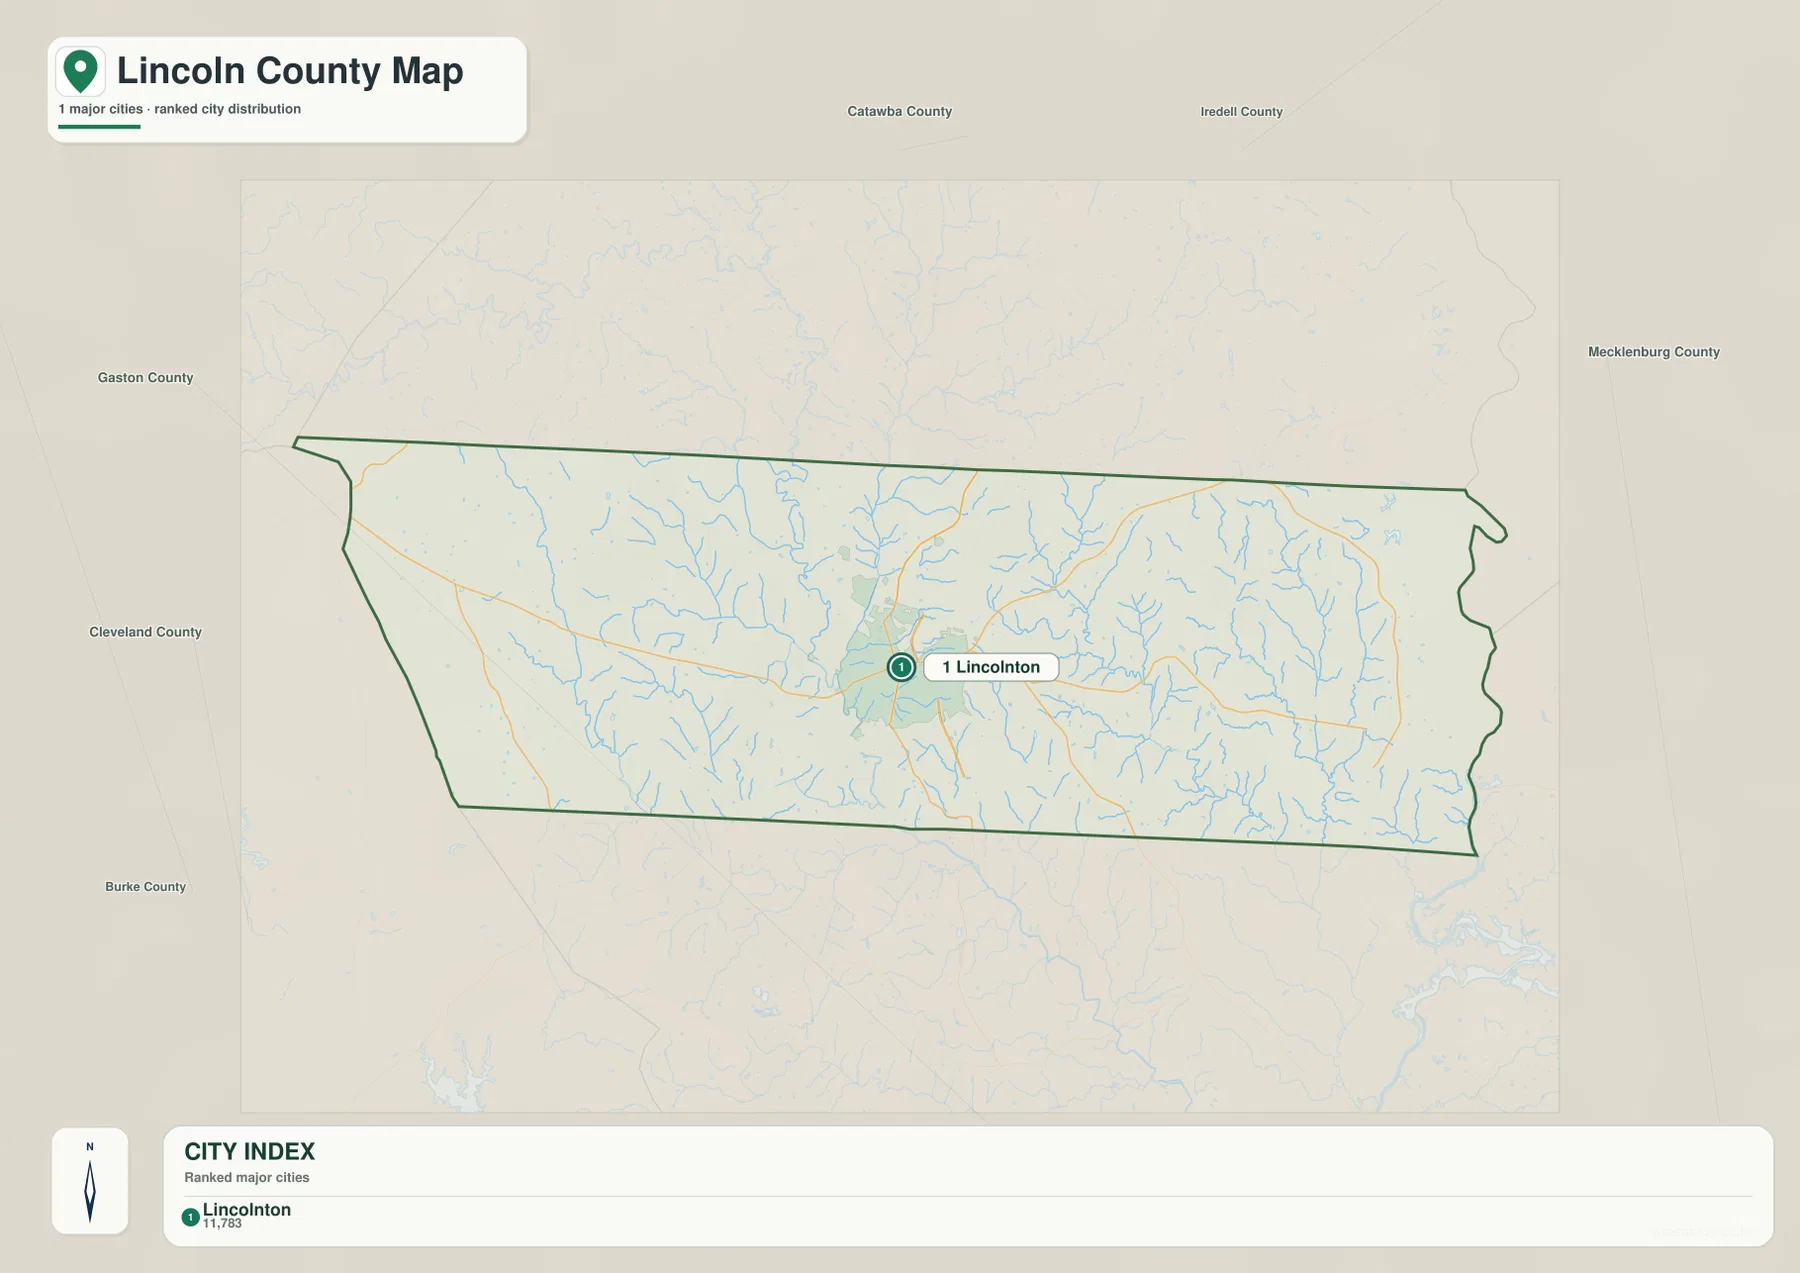
The city map is deliberately simpler than the detailed reference map. It keeps the Lincoln County outline and a light background of roads and streams, but it ranks only one major city: Lincolnton. The CITY INDEX at the bottom shows Lincolnton in the number-one position and displays the value 11,783 with the label. That means the map should be read as a ranked-city summary, not as a complete inventory of every community in Lincoln County.
That simplified design is useful when the main question is, “Where is the county’s principal mapped city?” The Lincolnton marker sits in the west-central interior, with much of Lincoln County extending east of it. Roads and streams remain faintly visible, so the city is not floating without context, but the image avoids the extra labels that appear on the detailed map. For a presentation slide, school reference, or quick county overview, this version gives Lincolnton strong visual emphasis without requiring the reader to sort through Denver, Iron Station, Lowesville, and other place names.
The outside county labels also make the position easier to place within the region. Catawba County and Iredell County are shown above, while Mecklenburg, Gaston, and Cleveland county names appear around other sides of the frame. These surrounding labels are contextual. If the goal is to understand Lincoln County’s eastern communities or to compare the lake shore with the inland seat, the detailed county map and the water map carry far more information than the city index alone.
Lake Norman dominates the east, but the interior creek network adds the detail
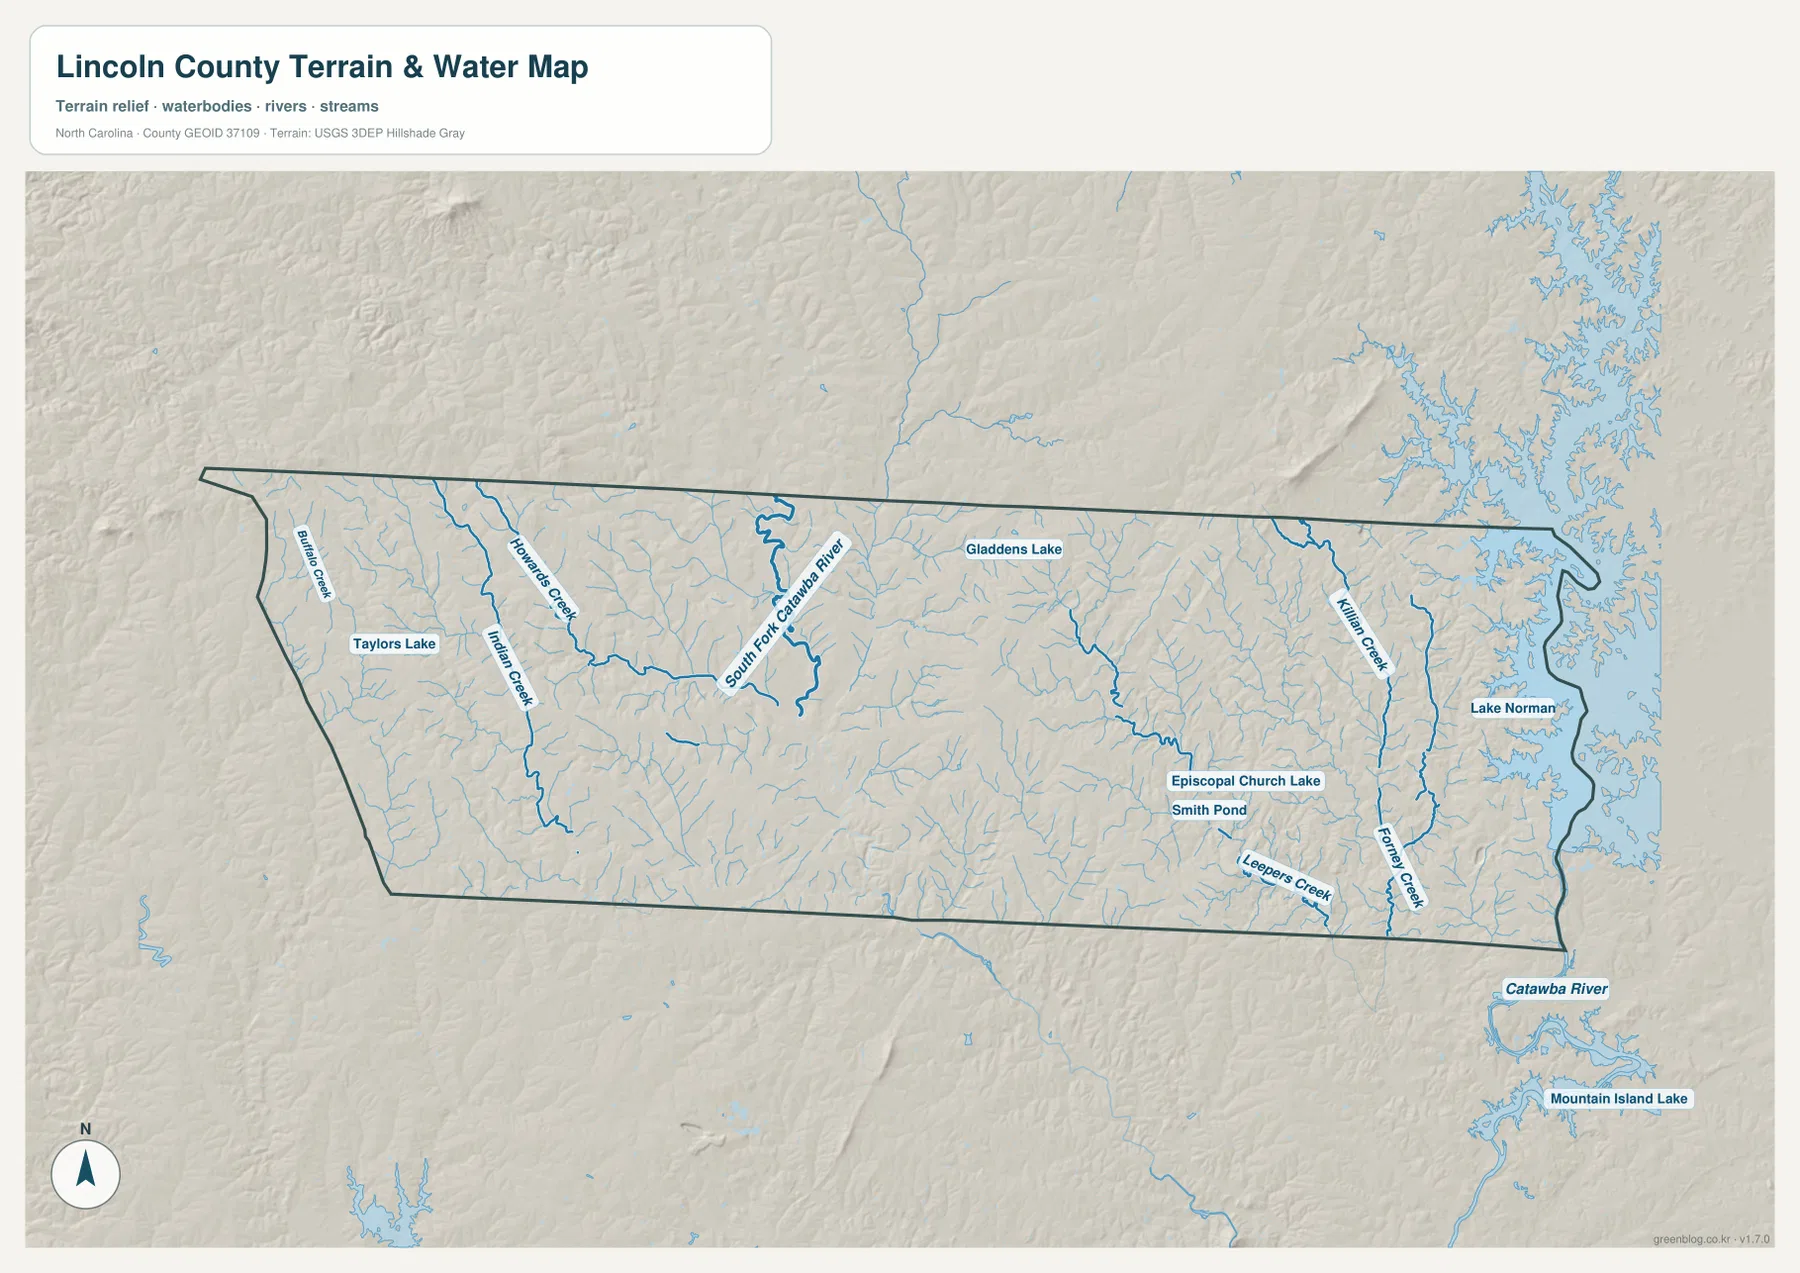
The terrain-and-water map makes the eastern water boundary impossible to miss. Lake Norman occupies the large water body immediately east of Lincoln County, with a branching shoreline that reaches toward the county edge. The Catawba River label continues south of the lake, and Mountain Island Lake is shown farther downstream outside the county. Denver’s location on the general map makes more sense when this water view is placed beside it: the community sits close to a major reservoir landscape rather than in the same interior setting as Lincolnton.
The smaller named waterways are equally useful for understanding the interior. Buffalo Creek appears along the western side, with Indian Creek and Howards Creek running through the western half. The South Fork Catawba River is labeled in the north-central to western interior and stands out more strongly than many of the smaller tributaries. On the eastern side, Killian Creek and Forney Creek are labeled, while Leepers Creek appears farther south. These names show that Lincoln County is crossed by many local drainage lines even where the large lake is not nearby.
Several smaller water bodies are labeled as well. Taylors Lake sits in the west, Gladdens Lake appears toward the north-central part of the county, and Episcopal Church Lake and Smith Pond are marked in the southeastern interior. Their size is modest compared with Lake Norman, but they help break the county into recognizable local reference areas. A reader trying to understand the water map should therefore look at two scales: the Catawba River–Lake Norman system on the east and the network of creeks, ponds, and smaller lakes spread through the interior.
The shaded background adds a general sense of relief. Low ridges and rolling terrain are visible across the inland county, with narrow valleys following many of the streams. The effect is especially clear where waterways cut through the textured surface. However, the image does not provide survey-grade elevation values, contour measurements, or engineering data. It is a visual terrain reference that helps explain why the drainage network branches the way it does, not a substitute for a dedicated elevation product.
This distinction also matters for water-related use. The blue lines and water polygons identify mapped rivers, streams, ponds, and lakes, but they do not show flood probability, navigable depth, parcel ownership, or a legal shoreline. Anyone making a safety, construction, property, or boating decision should use the appropriate official dataset for that purpose. For ordinary county orientation, though, the water map clearly shows the contrast between the large eastern reservoir and the much finer creek network inside Lincoln County.
Choose the map by the question instead of forcing one image to do everything
Use the detailed county map when you need several communities, roads, county boundaries, and streams in one view. It is the strongest choice for comparing Lincolnton with Denver, Iron Station, Lowesville, Westport, or Crouse, and it includes the road labels needed to understand how those places relate to one another. The city map is better when the page or presentation needs only a clean county outline with Lincolnton highlighted as the ranked major city. Its value comes from simplicity rather than detail.
The terrain-and-water map answers a different set of questions. It makes Lake Norman and the Catawba River much more prominent, identifies South Fork Catawba River and several named creeks, and uses hillshade to make the rolling inland surface easier to see. If your focus is the county’s eastern water edge or the way smaller streams cross the interior, this is the map to open first. Switching between the three views is more informative than expecting the city map to explain waterways or the water map to carry every road label.
For printing or offline use, the downloadable archive contains three high-resolution JPG files corresponding to the supplied map set. The body images on this page are web previews, so the JPG versions are the better choice when you need a larger working image. Keep the labels and map context intact when resizing, and remember that these are general reference maps rather than parcel, flood, or survey products.
Frequently Asked Questions
Which map shows the difference between Lincolnton and Denver most clearly?
Start with the detailed county map. It places Lincolnton in the west-central interior and Denver close to Lake Norman on the east, with Iron Station between the two. If the water setting is important to your comparison, follow it with the terrain-and-water map so the Lake Norman and Catawba River edge becomes more prominent.
Why does the city map show only Lincolnton?
The supplied city map is a ranked major-city summary rather than a complete settlement map. Its CITY INDEX contains only Lincolnton, so other mapped communities such as Denver, Iron Station, Lowesville, and Westport do not appear as ranked cities there. Use the detailed county map when you need those additional place names.
Can the terrain-and-water map be used to judge flood risk or exact elevation?
No. It is a general reference map showing waterways and shaded terrain, not a flood-hazard or survey-grade elevation product. Lake Norman, Catawba River, South Fork Catawba River, and smaller creeks can be located on it, but flood probability, legal boundaries, water depth, and precise elevation require purpose-built official sources.
Sources and reference data
- NCpedia – Lincoln County: county-specific background and historical reference.
- U.S. Census Bureau TIGER/Line Shapefiles: official geographic reference for boundaries and mapped features.
- USGS National Hydrography: official reference for rivers, streams, lakes, and related hydrographic data.
Map File Information
The ZIP contains high-resolution JPG versions of the county reference map, city map, and terrain-and-water map shown on this page.
- Included Files: Use only the versions confirmed in the article and supplied images
- File Type: Use the confirmed download contents
- Intended Use: Printing, education, presentations, and map-based projects
Related Maps
Green Map creates custom-edited map images using open geographic data sources such as geoBoundaries, Natural Earth, OpenStreetMap, and government open data.
These maps are edited visual materials, not raw data files, and are provided for education, documents, presentations, and graphic reference.