This page provides four Warren County Georgia maps that you can view online and download as high-resolution A3 JPG files. Warrenton serves as the county seat and the clearest road hub, while Camak lies northeast of Warrenton and Norwood sits to the northwest. The general map adds major route numbers and the county boundary, the water map follows the Ogeechee River and a network of named creeks, and the elevation map shows rolling relief from about 54 to 206 meters. Use the download box below to get the county, city, water, and elevation maps together in one ZIP for printing, classroom work, local research, or presentations.
The county is easier to understand when roads, water, and terrain are read together. Warrenton occupies the central area where several routes spread toward the north, east, south, and southwest. West of that road hub, the Ogeechee River follows the county’s lower western edge, while smaller streams cut into the interior hills. The elevation layer reports a mean of about 151 meters and shows some of the broadest higher ground in the west and northwest, separated by lower green valleys. Those contrasts give the county a rolling appearance even though its total relief is far less dramatic than the mountains of northern Georgia.
These are county-scale reference maps rather than parcel, survey, flood-risk, or turn-by-turn navigation products. They do not label every unincorporated community or local road, and the water layer does not make a flood determination. Their value is in showing the county boundary, the relative positions of Warrenton, Camak, and Norwood, major road connections, named streams and small waterbodies, and the broad pattern of higher ridges and lower valleys.
Table of Contents
Warrenton as the road hub inside Warren County’s irregular boundary
The general county map makes Warrenton the easiest place to use as an orientation point. Several numbered roads meet or pass near the town, then spread in different directions across the county. Route 80 runs north toward Camak, Route 12 crosses the northern interior near Norwood, and labels for 20, 278, 223, and 402 appear farther north. South of Warrenton, the map includes routes 16, 17, 17C, 123, and 171 along different branches. This is not a complete road atlas, but it clearly shows why Warrenton works as the main reference point for moving between the northern towns and the longer southern half of the county.
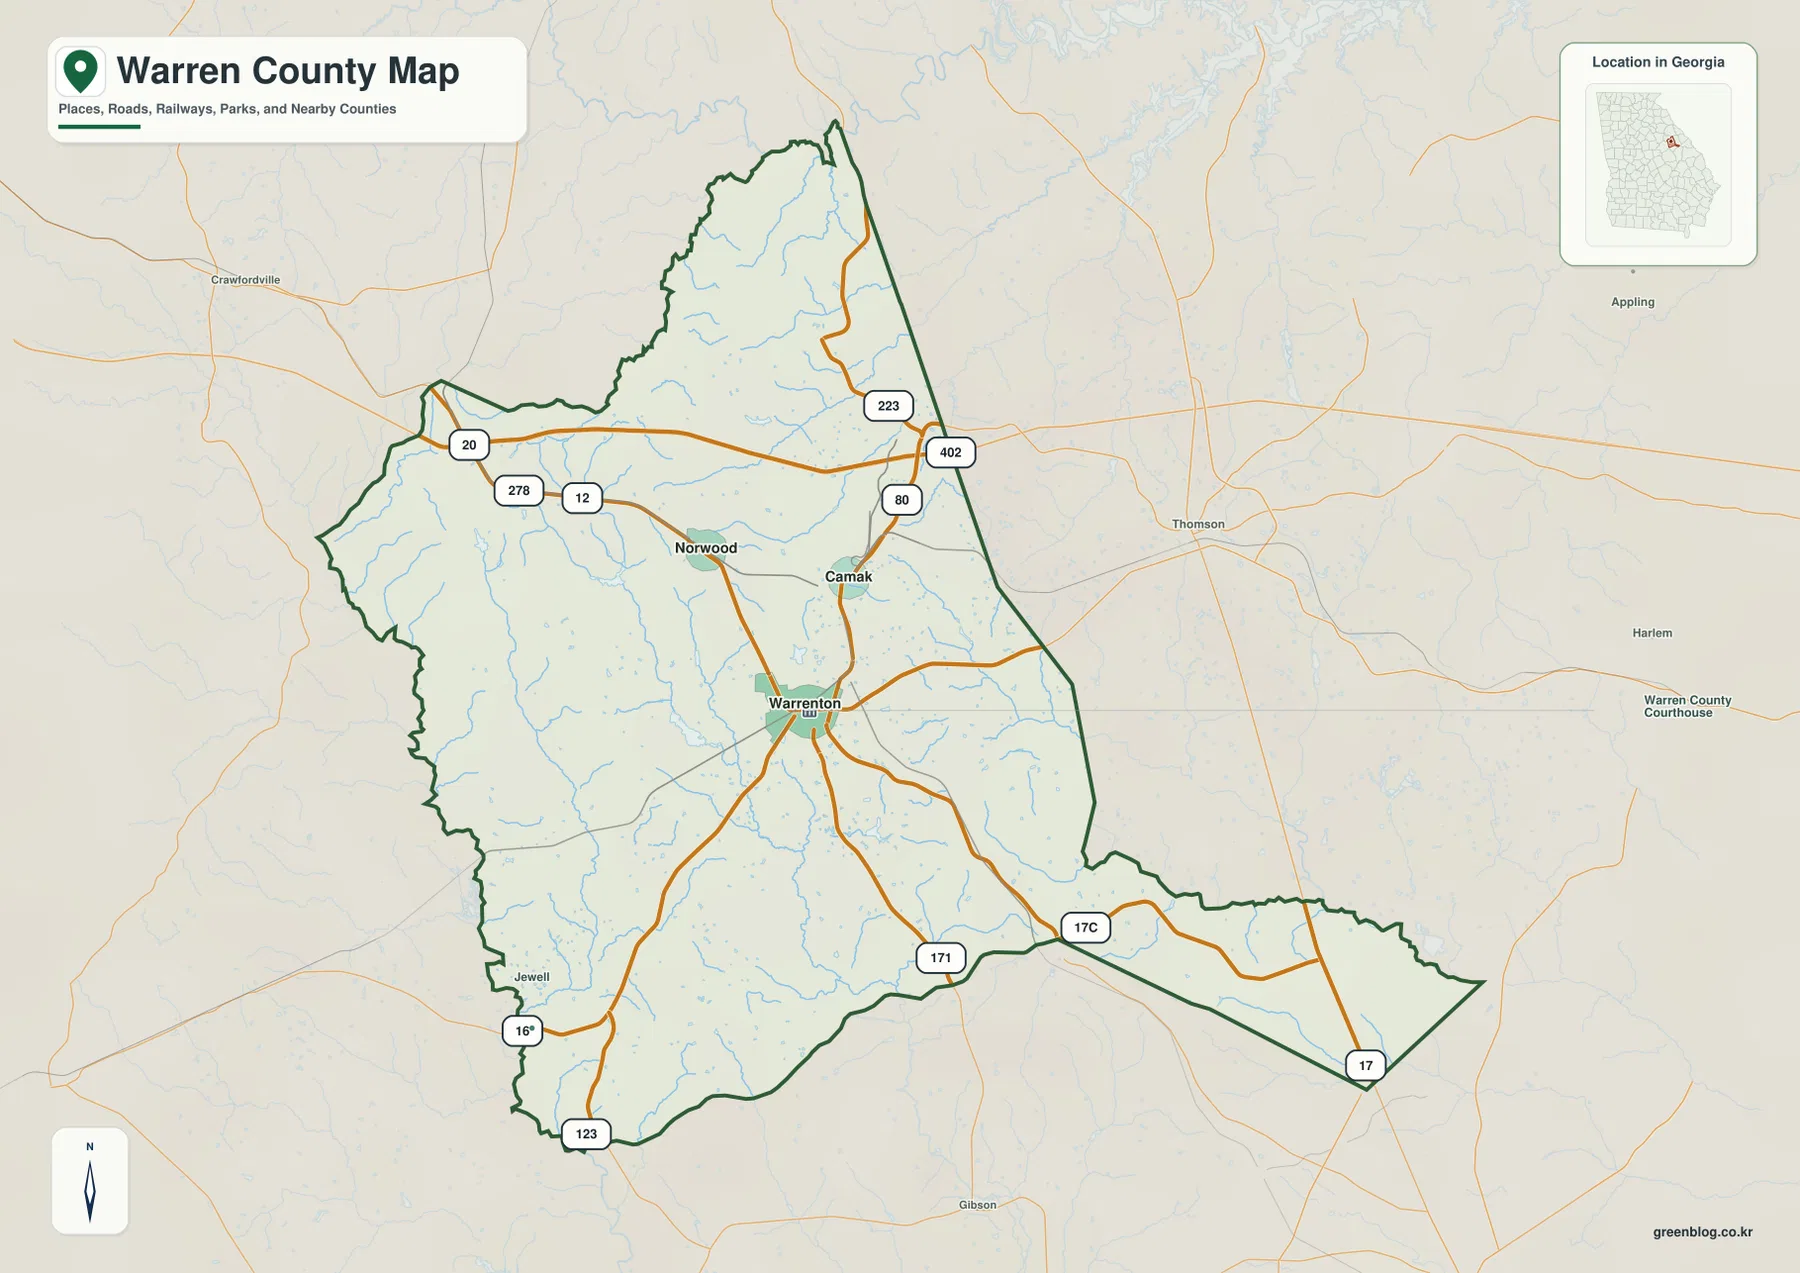
Camak lies northeast of Warrenton near the north-south road corridor, while Norwood is northwest along the northern road network. Their positions are close enough to compare easily, yet they occupy different sides of the county’s upper interior. South of Warrenton, named towns become less prominent on the map and the long southeastern extension of the county draws attention instead. The outline narrows, bends, and then projects eastward, so a simple rectangular mental picture of Warren County would be misleading.
The city map adds surrounding county names that help place Warren County within the larger region. Wilkes County appears to the north, Taliaferro County to the northwest, Hancock County to the west, and Glascock County to the southwest. McDuffie County and Jefferson County are shown on the eastern side. Nearby labels such as Crawfordville, Thomson, and Gibson also provide useful outside reference points. These boundaries are appropriate for regional orientation, but legal property or jurisdiction decisions should be based on current official boundary data rather than a general reference graphic.
The existing county material identifies Warren County as established in 1793. That historical fact provides useful background, but the map set is designed primarily around the county’s present geographic layout. Once Warrenton, Camak, and Norwood are located, the same points can be used to compare the stream network and terrain. Warrenton is particularly useful because it sits close to the center of the mapped road pattern and near several named water features.
A simple city view of Warrenton, Camak, and Norwood
The city map deliberately removes much of the background detail and gives the three highlighted towns numbered markers. Warrenton is number 1 near the center, Camak is number 2 to the northeast, and Norwood is number 3 to the northwest. With fewer labels competing for attention, the map makes the branching pattern north of Warrenton very easy to explain. It also shows that the southeastern extension of the county lies well beyond the main cluster of labeled towns.
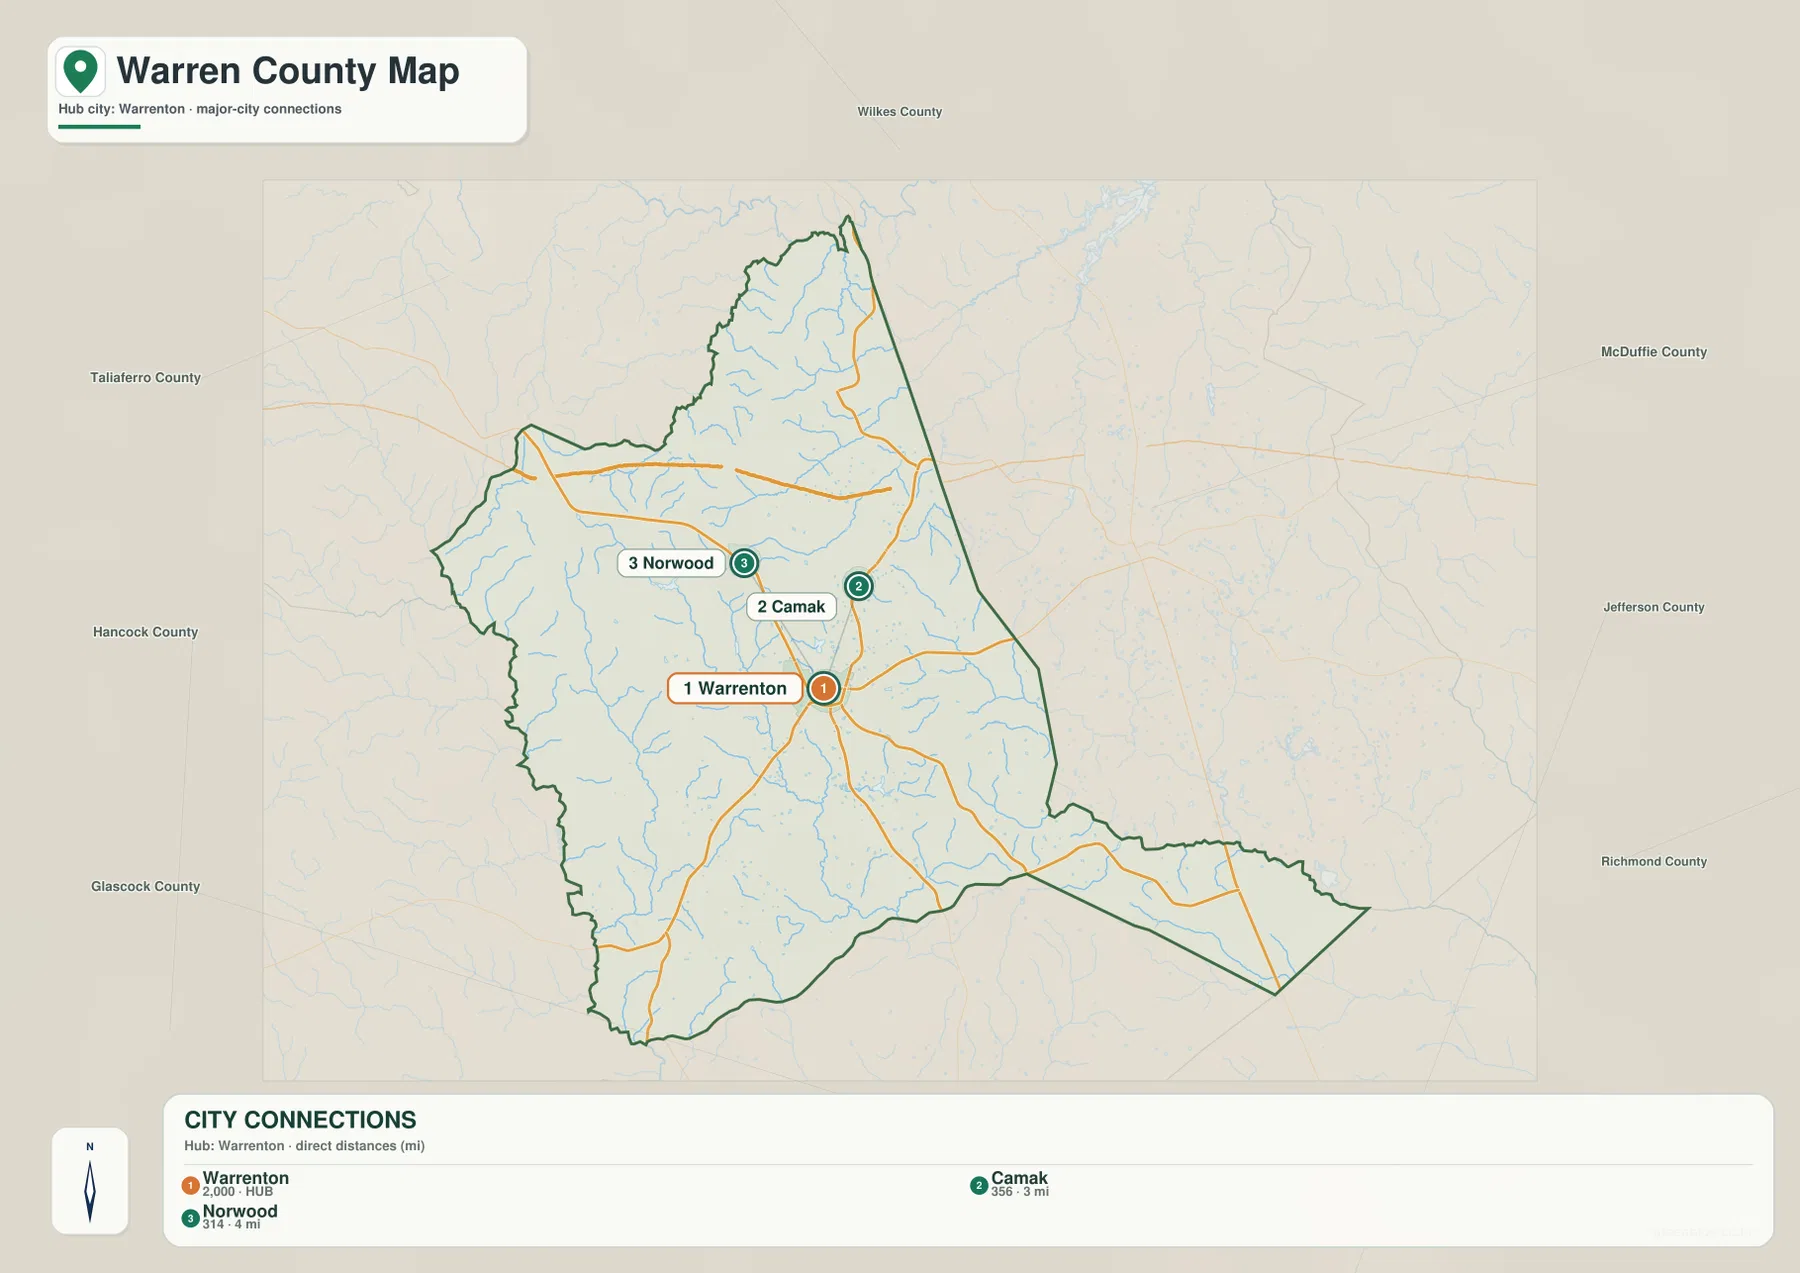
The index printed on the map shows 2,000 for Warrenton, 356 for Camak, and 314 for Norwood. Because the preview does not state a reference year for those figures, they are best treated as values included in the map rather than as a claim about the latest population estimate. Within the graphic, however, the difference is useful: Warrenton is presented as the clearly larger hub, which matches the general map’s denser convergence of roads around the town.
This stripped-down view is useful for questions that do not require every route or stream. A classroom slide about the county seat can point directly to Warrenton. A local-history presentation can show that Camak and Norwood sit north of the county seat on opposite sides of the upper interior. If the question shifts to how those towns connect by road, the general county map adds the needed route numbers; if the question is about creeks or relief, the water and elevation maps are more informative.
The contrast between the city map and the full county outline also prevents an easy misconception. Warren County is not just the small area around its three named towns. A substantial part of the county extends southward and then southeastward beyond the main settlement cluster. That distinction matters when reading the water map, because several tributaries and lower valleys continue through areas where no large town label is present.
Ogeechee River on the west and a dense network of interior creeks
The most prominent water feature on the Warren County water map is the Ogeechee River along the western and southwestern edge of the county. It provides a strong natural reference line that is easy to find even when the smaller tributaries become dense. Inside the county, Williams Creek is labeled in the northwest, Hart Creek crosses the northern interior, and Briar Creek appears near the eastern side. Middle Creek, Little Briar Creek, and Rocky Comfort Creek add more named branches, showing how thoroughly the rolling terrain is divided by small valleys.
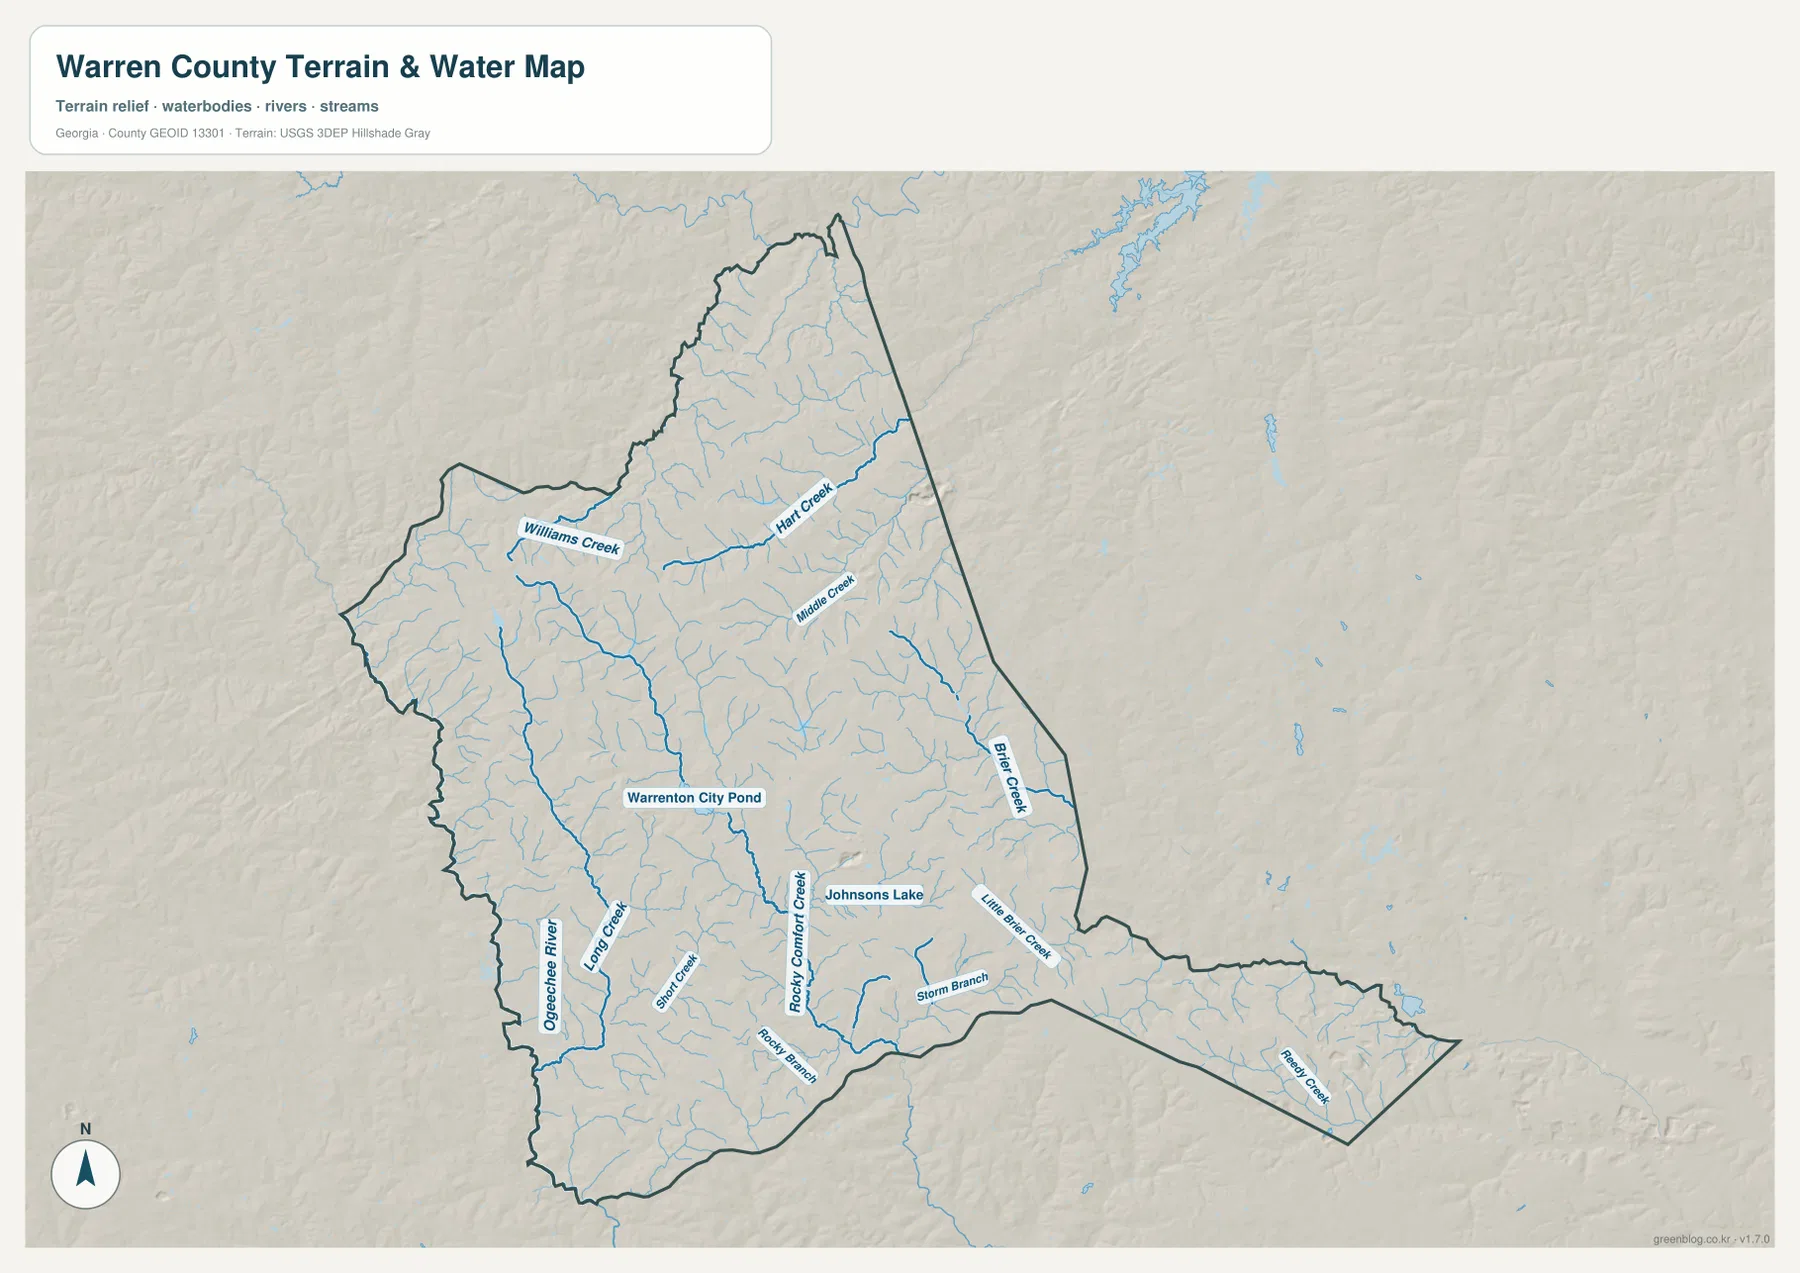
Small waterbodies provide more precise reference points near the central settlement area. Warrenton City Pond is labeled just west of the town’s broader location, while Johnsons Lake appears farther east in the central county. Storm Branch is marked in the southern interior, and smaller blue tributaries continue into the long southeastern extension. No single lake dominates the county, so the value of this map comes from the combination of many creeks, branches, ponds, and the larger Ogeechee River.
Reading the stream network from west to east also shows that the county is not drained by one straight channel. Long Creek trends toward the Ogeechee River in the southwest, while Rocky Comfort Creek and other branches occupy the central and southern interior. Hart Creek and Middle Creek cross the north, and Briar Creek follows the eastern side. The pattern is easiest to understand as a set of narrow valleys cut between rolling ridges rather than as a flat surface crossed by isolated blue lines.
The water map is appropriate for locating rivers, creeks, ponds, and their relative directions, but it is not a flood-hazard or water-quality map. Being close to the Ogeechee River or Rocky Comfort Creek on this overview does not establish that a parcel lies in a flood zone. Questions about flood probability, stream condition, or water use should be checked against the appropriate current agency data. Here, the emphasis is on geographic position and the way the drainage network relates to the terrain shown in the elevation layer.
54–206 meters of relief across ridges and stream valleys
The elevation map reports an actual range of about 54 to 206 meters and a mean of about 151 meters. Broad areas of brown and orange higher terrain are most noticeable in the west and northwest, with additional ridges extending through the central and northern interior. Lower green terrain appears along the western Ogeechee River corridor and in branching valleys elsewhere in the county. The result is a rolling landscape made of repeated ridges and drainage cuts rather than a single uniform slope.
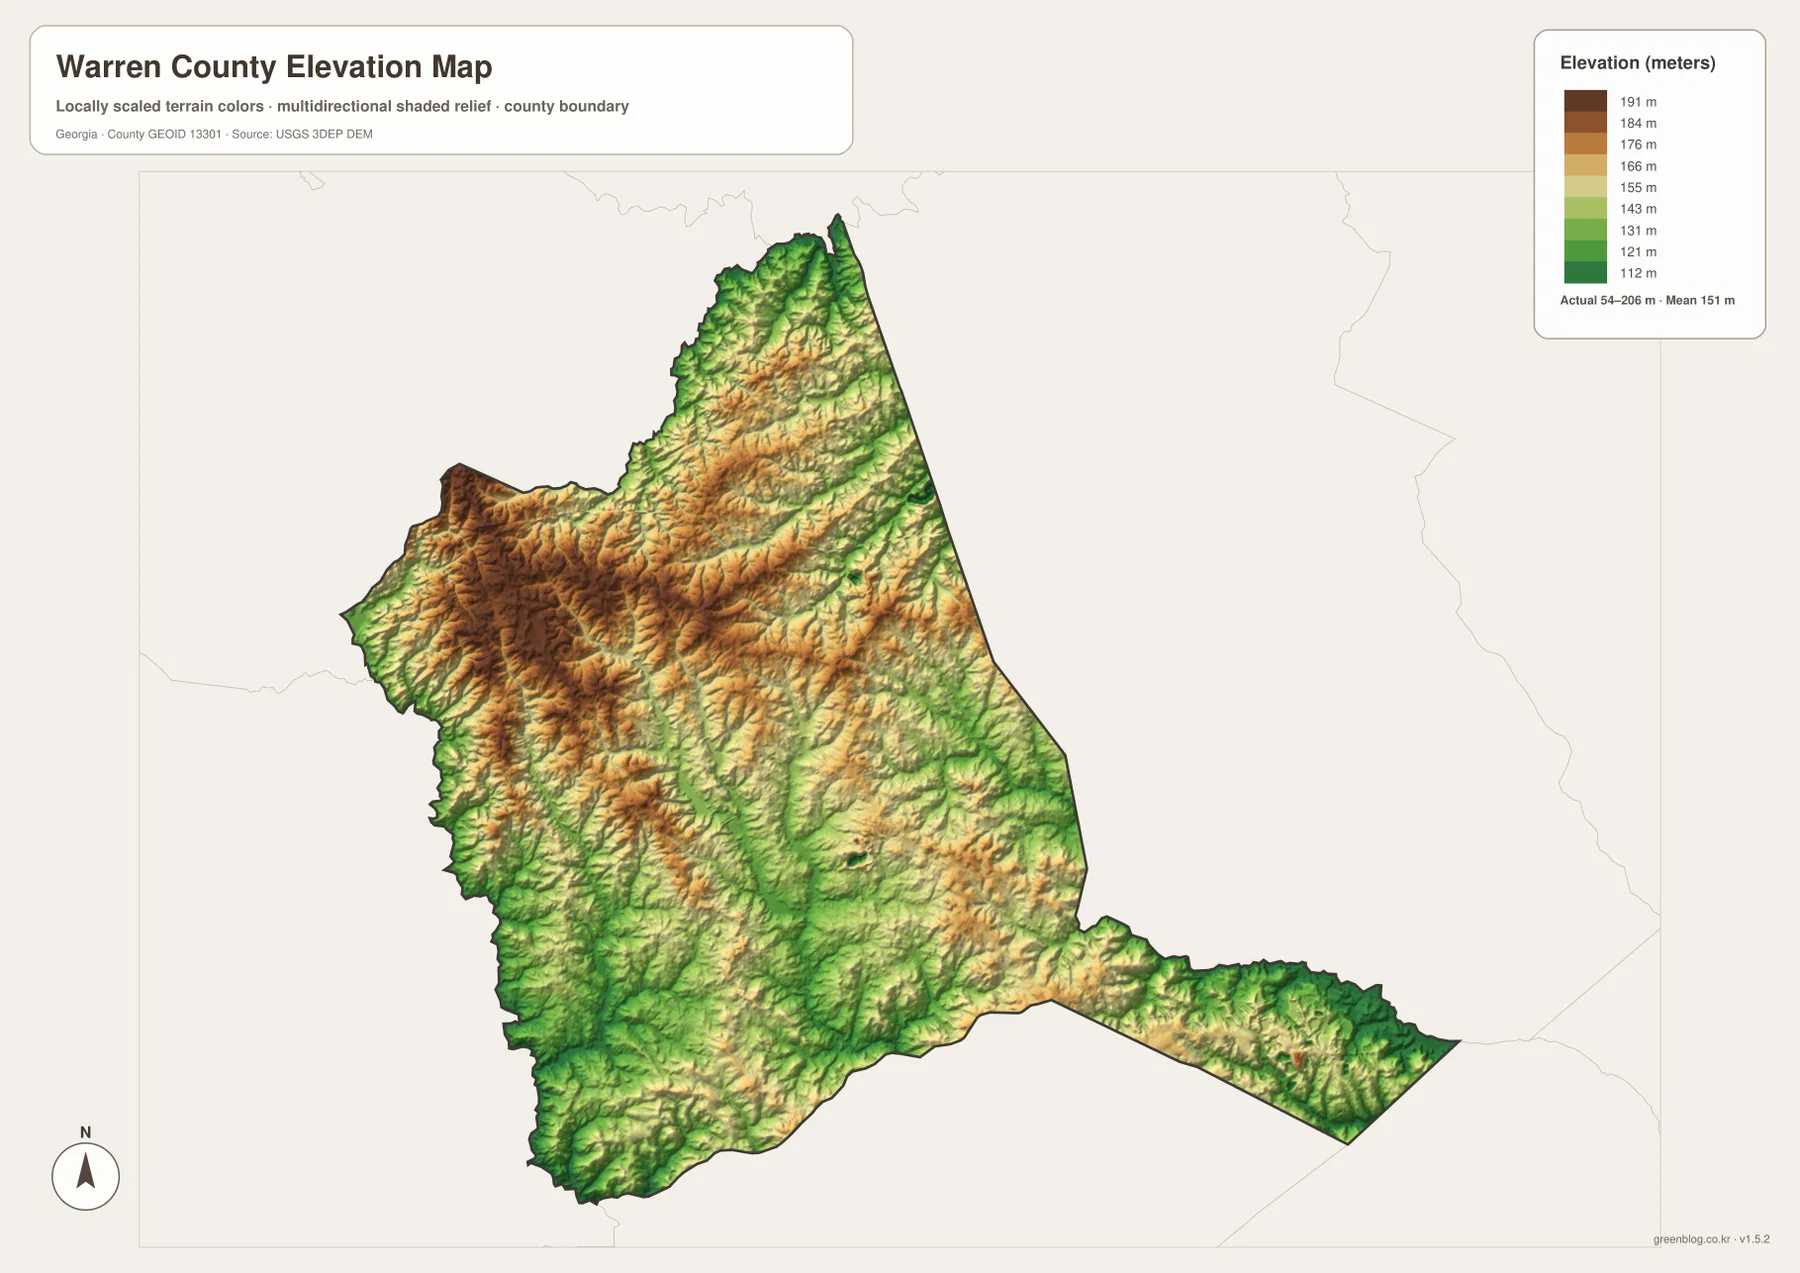
The western half contains some of the strongest local contrast. Higher ridges rise close to lower green corridors that lead toward the Ogeechee River, so elevation changes occur over relatively short distances. In the northwest, narrow valleys cut into the higher terrain around the same area where Williams Creek and other tributaries appear on the water map. Farther south, the colors alternate between middle elevations and lower drainage lines rather than settling into one broad low plain.
The long southeastern projection of the county is also useful to compare. Its surface is generally lower to moderate than the highest western ridges, but it still contains a textured sequence of small highs and lows. That means the narrow shape on the boundary map should not be mistaken for a flat extension. Tributaries continue through the area, and the shaded relief shows that their valleys remain tied to local changes in elevation.
Elevation colors are best used here for relative comparison, not for survey measurements. The 54–206 meter range describes the county as a whole, while the color scale helps identify broad higher and lower zones. It cannot replace a site-specific elevation value, a road-grade measurement, or engineering data. For county-scale geography, however, the map clearly explains why the Ogeechee River and named creeks follow lower corridors between surrounding hills.
Connecting roads, water, and terrain from the same reference points
Warrenton is the most practical place to begin a cross-map comparison. On the general map, it is the central road hub. On the city map, it is the number 1 location and has the largest printed index value. The water map places Warrenton City Pond just to the west and several branching streams around the broader central area, while the elevation layer shows a mixture of moderate ridges and lower channels. Those layers explain more about the setting than any one map can provide alone.
Camak and Norwood offer a second useful comparison. Camak is northeast of Warrenton near the north-south road corridor, while Norwood is northwest in the more strongly ridged western side. Hart Creek and Middle Creek occupy the northern interior east of Norwood, and Williams Creek is visible farther northwest. The elevation map shows why those water lines twist through the hills: each follows lower ground between nearby ridges rather than cutting across a flat surface.
The southern half is a different case because fewer town labels dominate the page. Here, physical geography provides the better organizing structure. The Ogeechee River remains a strong western reference, Rocky Comfort Creek and Storm Branch mark interior valleys, and the elevation layer shows the succession of low channels and higher ground around them. In the long southeastern extension, the combination of boundary shape, small tributaries, and shaded relief is more informative than a city-only view.
Choose the map according to the question you need to answer. The county map works best for Warrenton, Camak, Norwood, route numbers, and the overall outline. The city map is the cleanest way to compare the three highlighted towns. The water map is the direct choice for the Ogeechee River, Williams Creek, Hart Creek, Rocky Comfort Creek, ponds, and lakes. The elevation map is useful when the goal is to explain the approximately 54–206 meter relief and the contrast between higher western ridges and lower drainage corridors.
- County map: county boundary, Warrenton, Camak, Norwood, major roads, and surrounding place context
- City map: a simplified comparison of the three highlighted towns and their positions
- Water map: Ogeechee River, named creeks, Warrenton City Pond, Johnsons Lake, and smaller tributaries
- Elevation map: the roughly 54–206 meter range, western ridges, and lower river and creek valleys
The WEBP images in the article are lighter previews intended for quick on-page viewing. The ZIP below contains four separate high-resolution A3 JPG files, one each for the county, city, water, and elevation maps. The larger files are better suited to printing, classroom displays, reports, presentations, and closer inspection of labels, and each map can be used independently when only one topic is needed.
These maps are geographic reference products, not legal surveys, parcel maps, flood determinations, or live navigation tools. The water layer does not state flood probability or water quality, and the elevation layer should not be used as a survey-grade value for a particular property. When exact jurisdiction boundaries, current road conditions, hydrology, or site elevation matter, consult the appropriate official dataset or local agency in addition to these county-scale graphics.
Frequently Asked Questions
Where are Warrenton, Camak, and Norwood located within Warren County?
Warrenton is near the center of the county and serves as the main road hub. Camak is northeast of Warrenton, while Norwood is northwest. The city map makes that branching northward arrangement especially clear and also shows how far the county continues south and southeast beyond the main town cluster.
What can I learn by comparing the Ogeechee River with the elevation map?
The Ogeechee River follows the western and southwestern side of Warren County, and the elevation map shows lower green terrain along much of the same corridor. With a county-wide range of about 54 to 206 meters, the map also shows higher western and northwestern ridges beside lower stream valleys. The comparison helps explain the river’s terrain setting but does not establish flood risk for any property.
What files are included in the Warren County map download?
The ZIP contains four high-resolution A3 JPG files: a general county map, city map, water map, and elevation map. The WEBP images embedded in the article are lighter previews, while the JPG files are intended for larger viewing and printing.
Sources and reference data
The following sources provide additional county background and the public boundary, hydrography, and elevation data used for more precise reference. Consult the current source dataset whenever a project requires detail beyond a county-scale overview map.
- U.S. Census Bureau QuickFacts — county statistics and background
- New Georgia Encyclopedia: Warren County — county history and local context
- U.S. Census Bureau TIGER/Line Shapefiles — boundary and road reference data
- USGS National Hydrography — stream and waterbody reference data
- USGS 3D Elevation Program — elevation and terrain reference data
Map File Information
The ZIP contains four Warren County maps as high-resolution A3 JPG files: county, city, water, and elevation. Use the separate files for printing, classroom geography, local research, reports, and presentations.
- Included Files: County map, city map, water map, elevation map
- File Type: ZIP containing four high-resolution A3 JPG files
Related Maps
- Warren County Tennessee map | McMinnville and Collins River
- A Clinch County Map
- A Closer Look at the Decatur County Georgia Map
Green Map creates custom-edited map images using open geographic data sources such as geoBoundaries, Natural Earth, OpenStreetMap, and government open data. These maps are edited visual materials, not raw data files, and are provided for education, documents, presentations, and graphic reference.