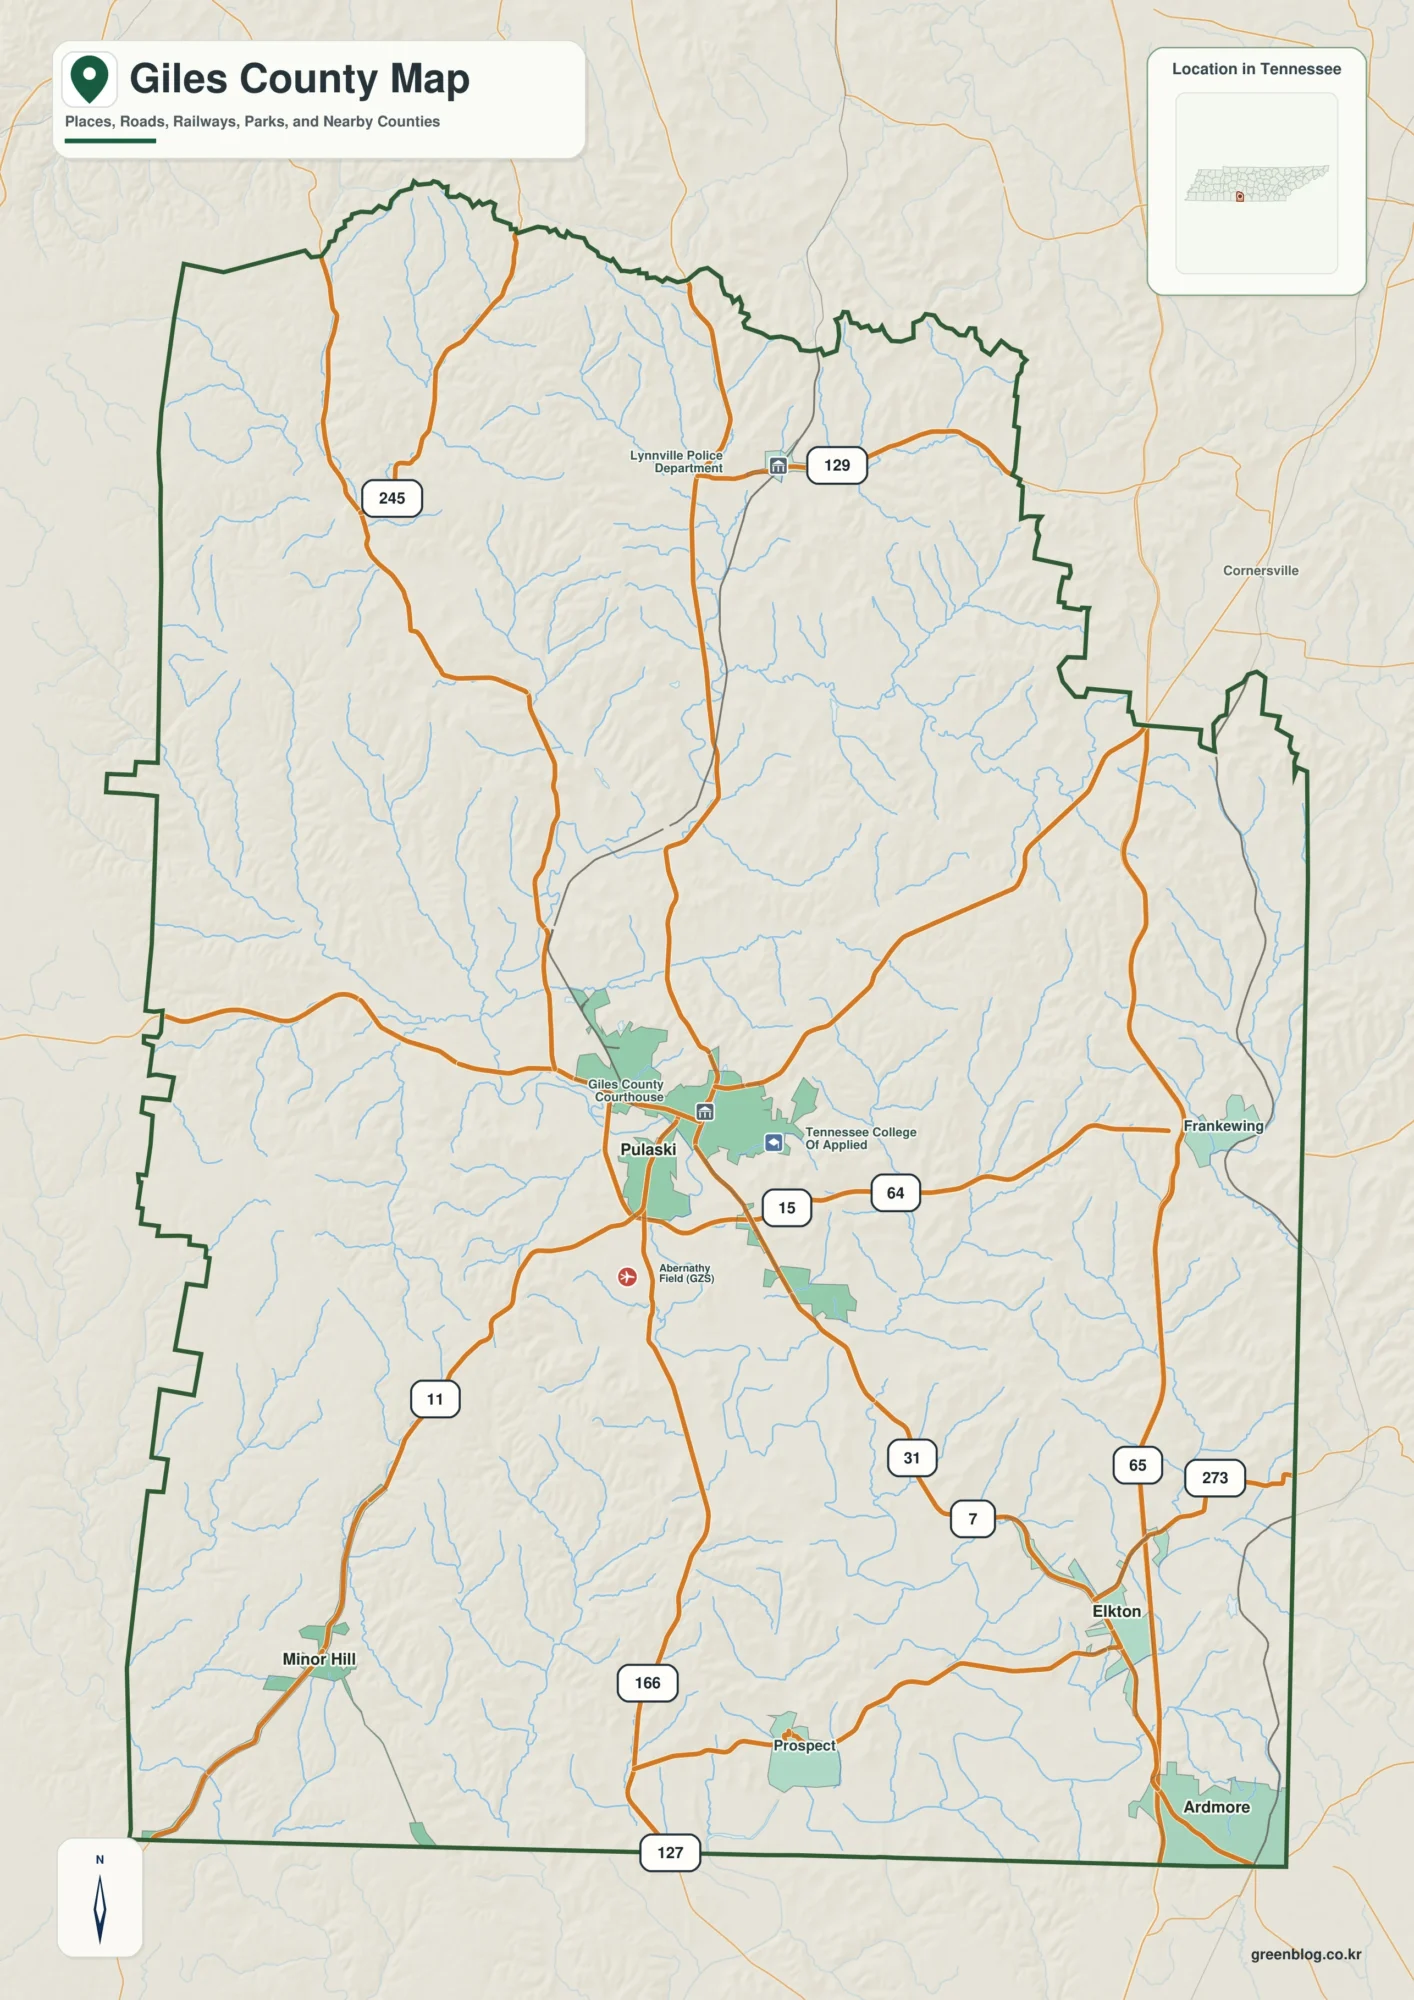
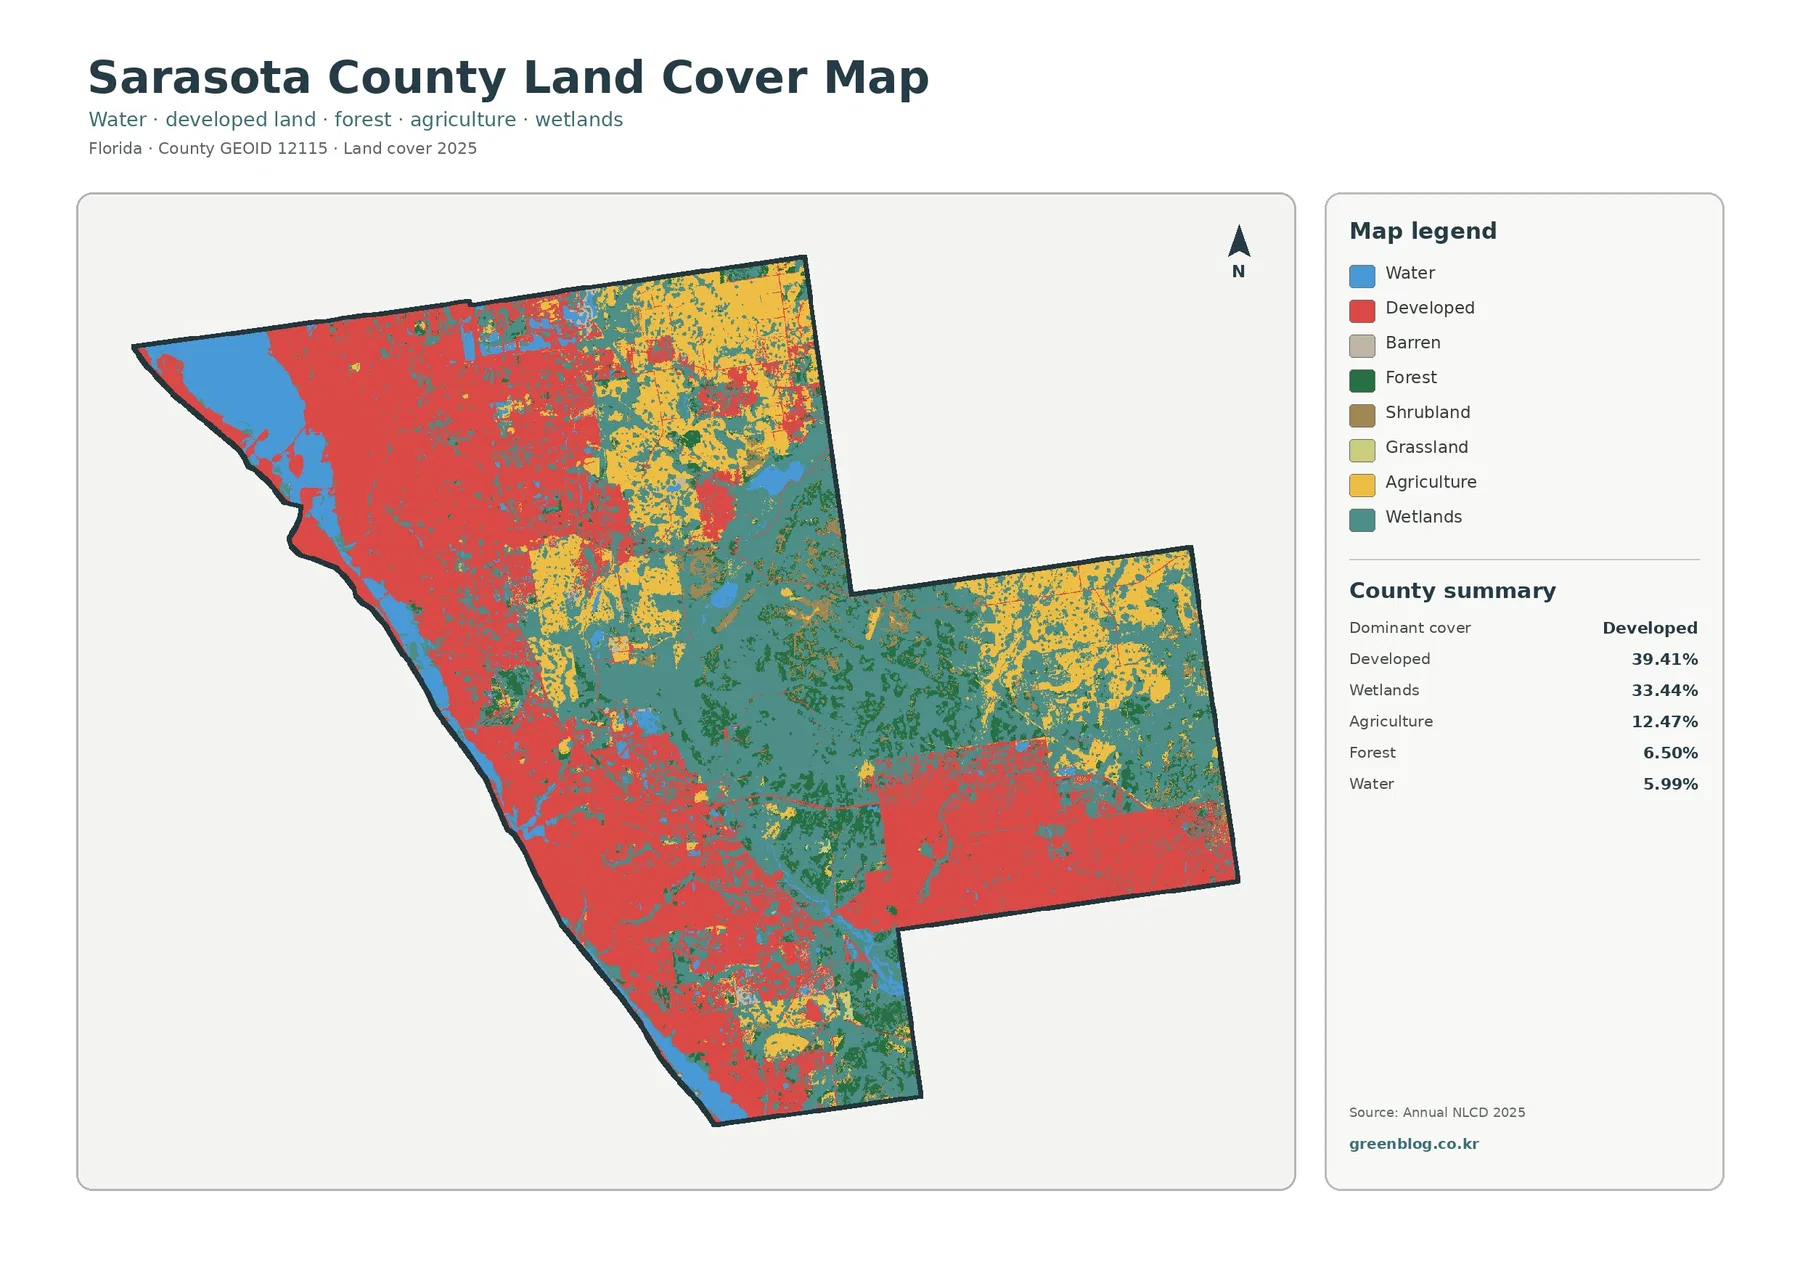
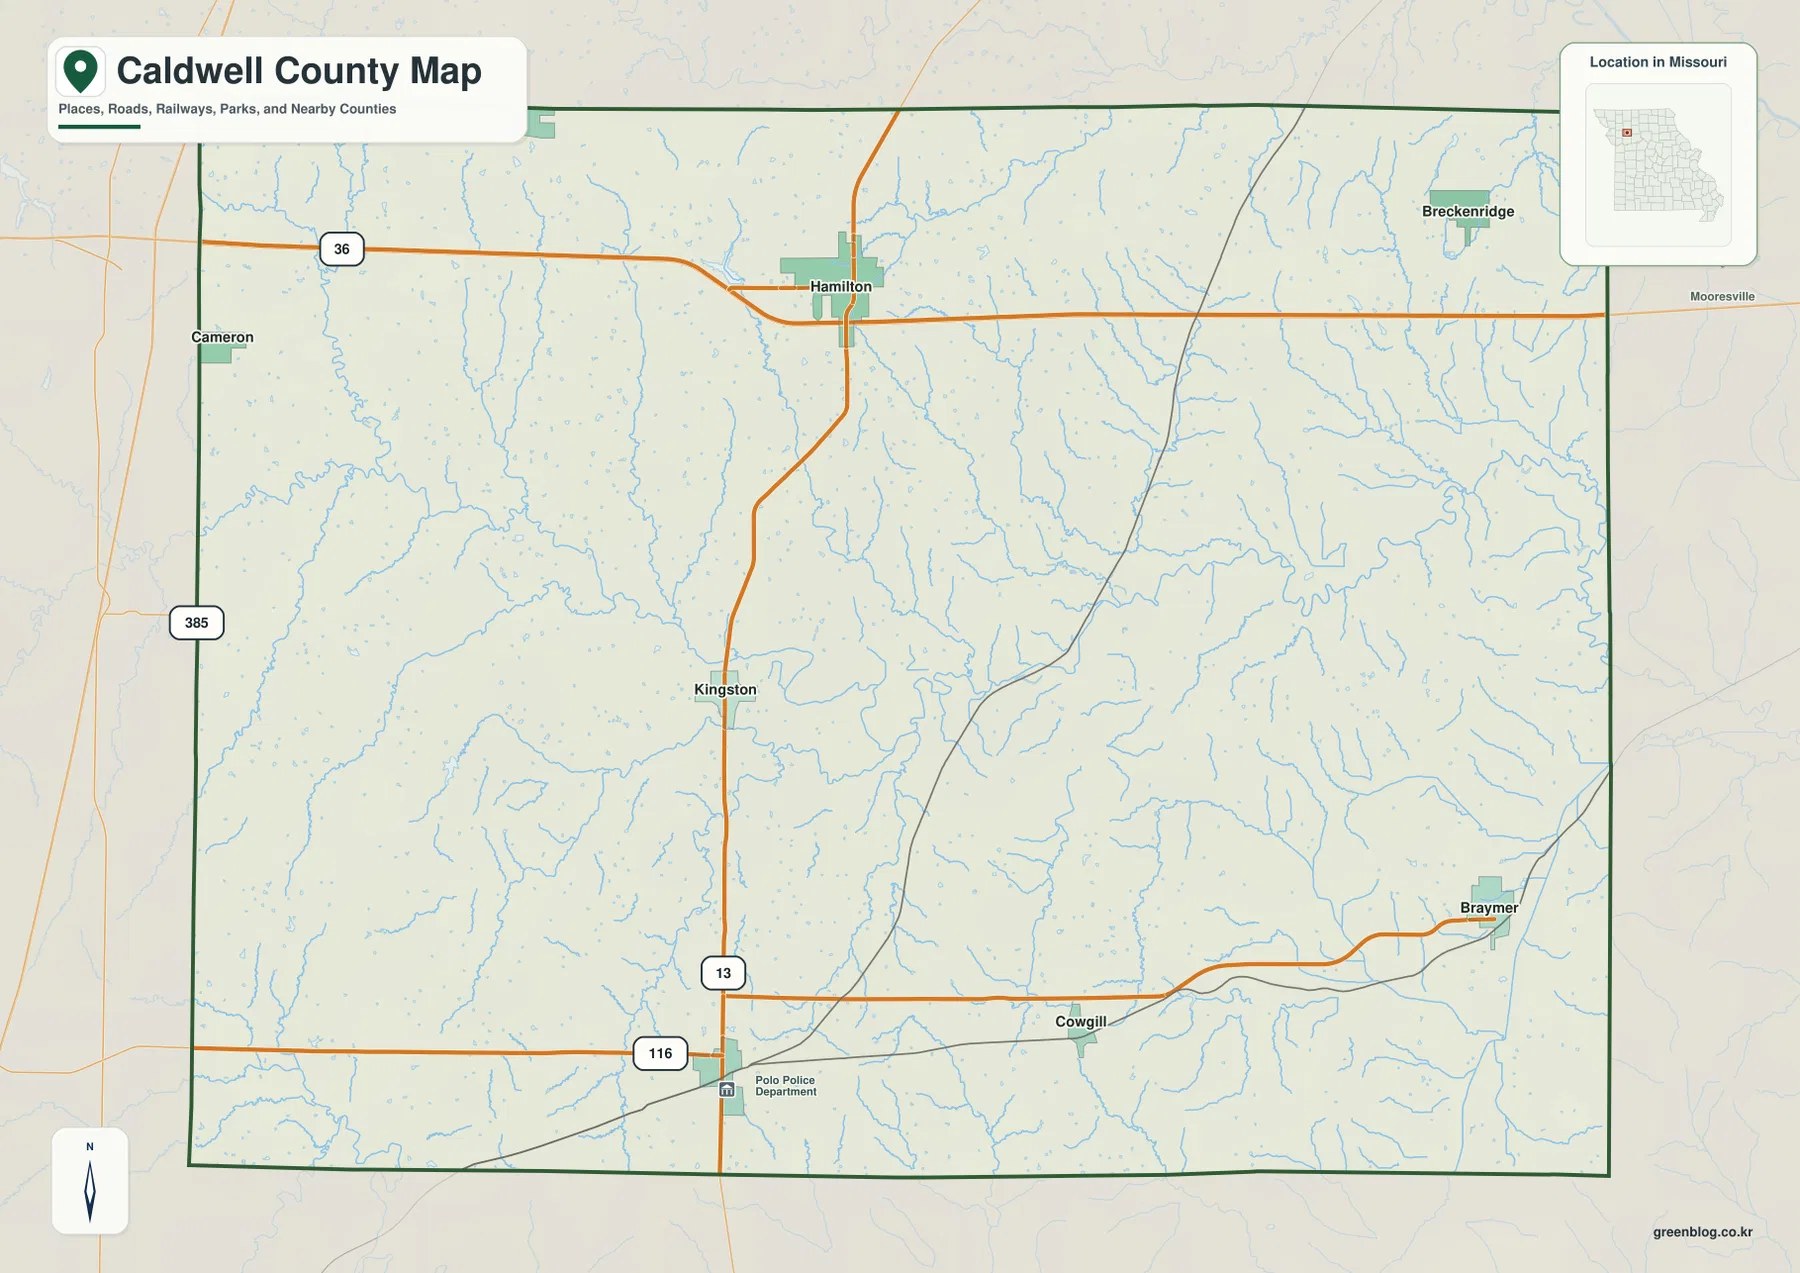
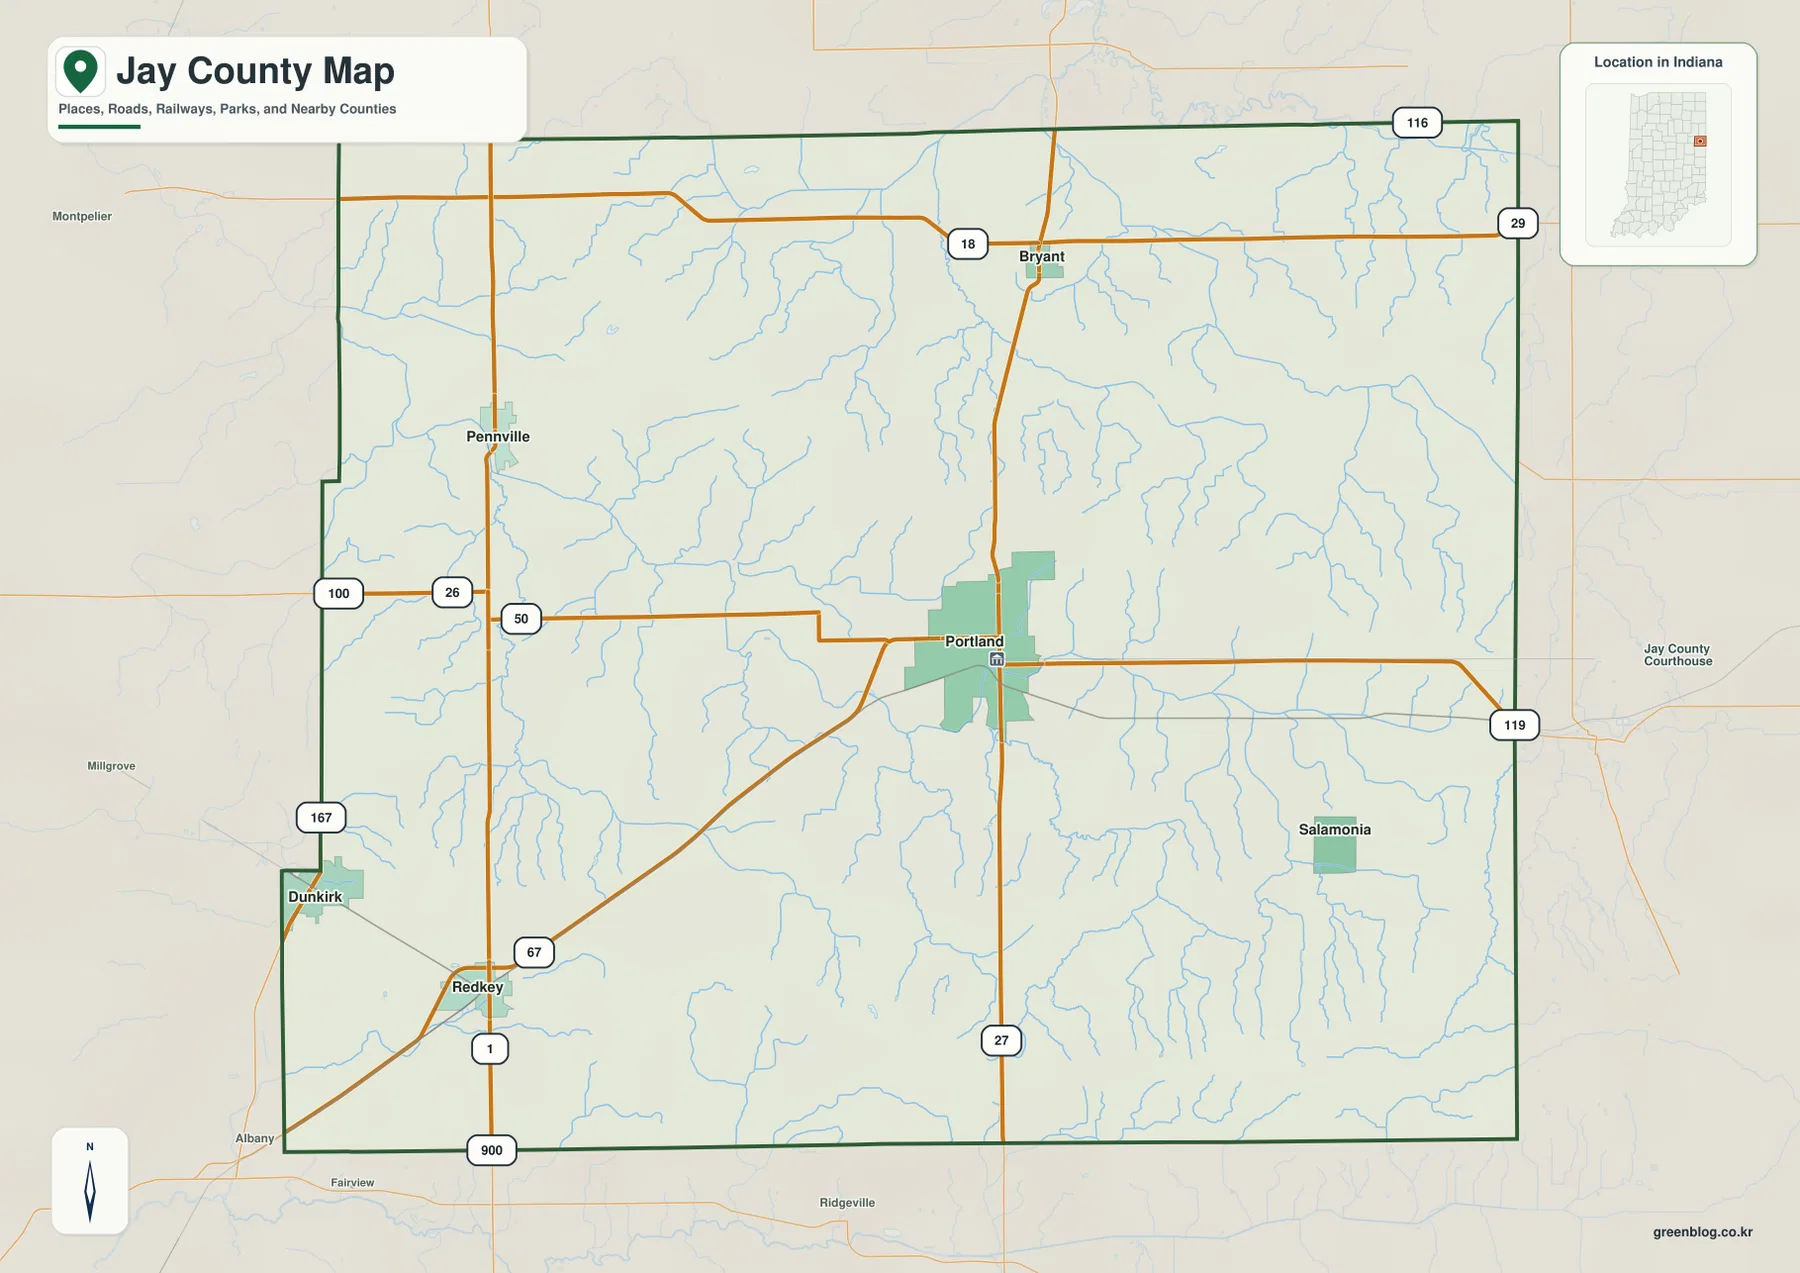
Montgomery County in southeastern Georgia is a long, narrow county where small incorporated places are spread from Tarrytown in the north to Uvalda in the south. Mount Vernon, the county seat, sits near Ailey in the west-central part of the county, while Higgston lies toward the eastern side. The maps on this page show that settlement pattern together with major roads, creeks, terrain, and elevation. You can download all four maps as high-resolution A3 JPG files in one ZIP after reviewing the WebP previews.
The county is easier to understand when the four views are compared rather than treated as interchangeable. The general county map makes the road network and boundary easy to follow, the city map separates the six mapped towns, the water map reveals a dense network of creeks, and the elevation map shows a clear contrast between lower land along much of the western and southern edge and higher rolling ground across the central and eastern interior. Each view adds a different piece of the same local geography.
Table of Contents
Mount Vernon at the center of the road and boundary view
The county map places Mount Vernon and Ailey close together in the west-central area. From there, Routes 30 and 280 run east toward Higgston and the Vidalia side of the region, while Routes 15 and 29 descend from the northeast and connect with the county’s north-south road pattern. Farther south, Routes 56, 221, and 135 provide the clearest labeled links around Uvalda and the lower part of the county. This network explains why the incorporated places do not form one compact cluster: several are tied to different road corridors at substantial distances from one another.
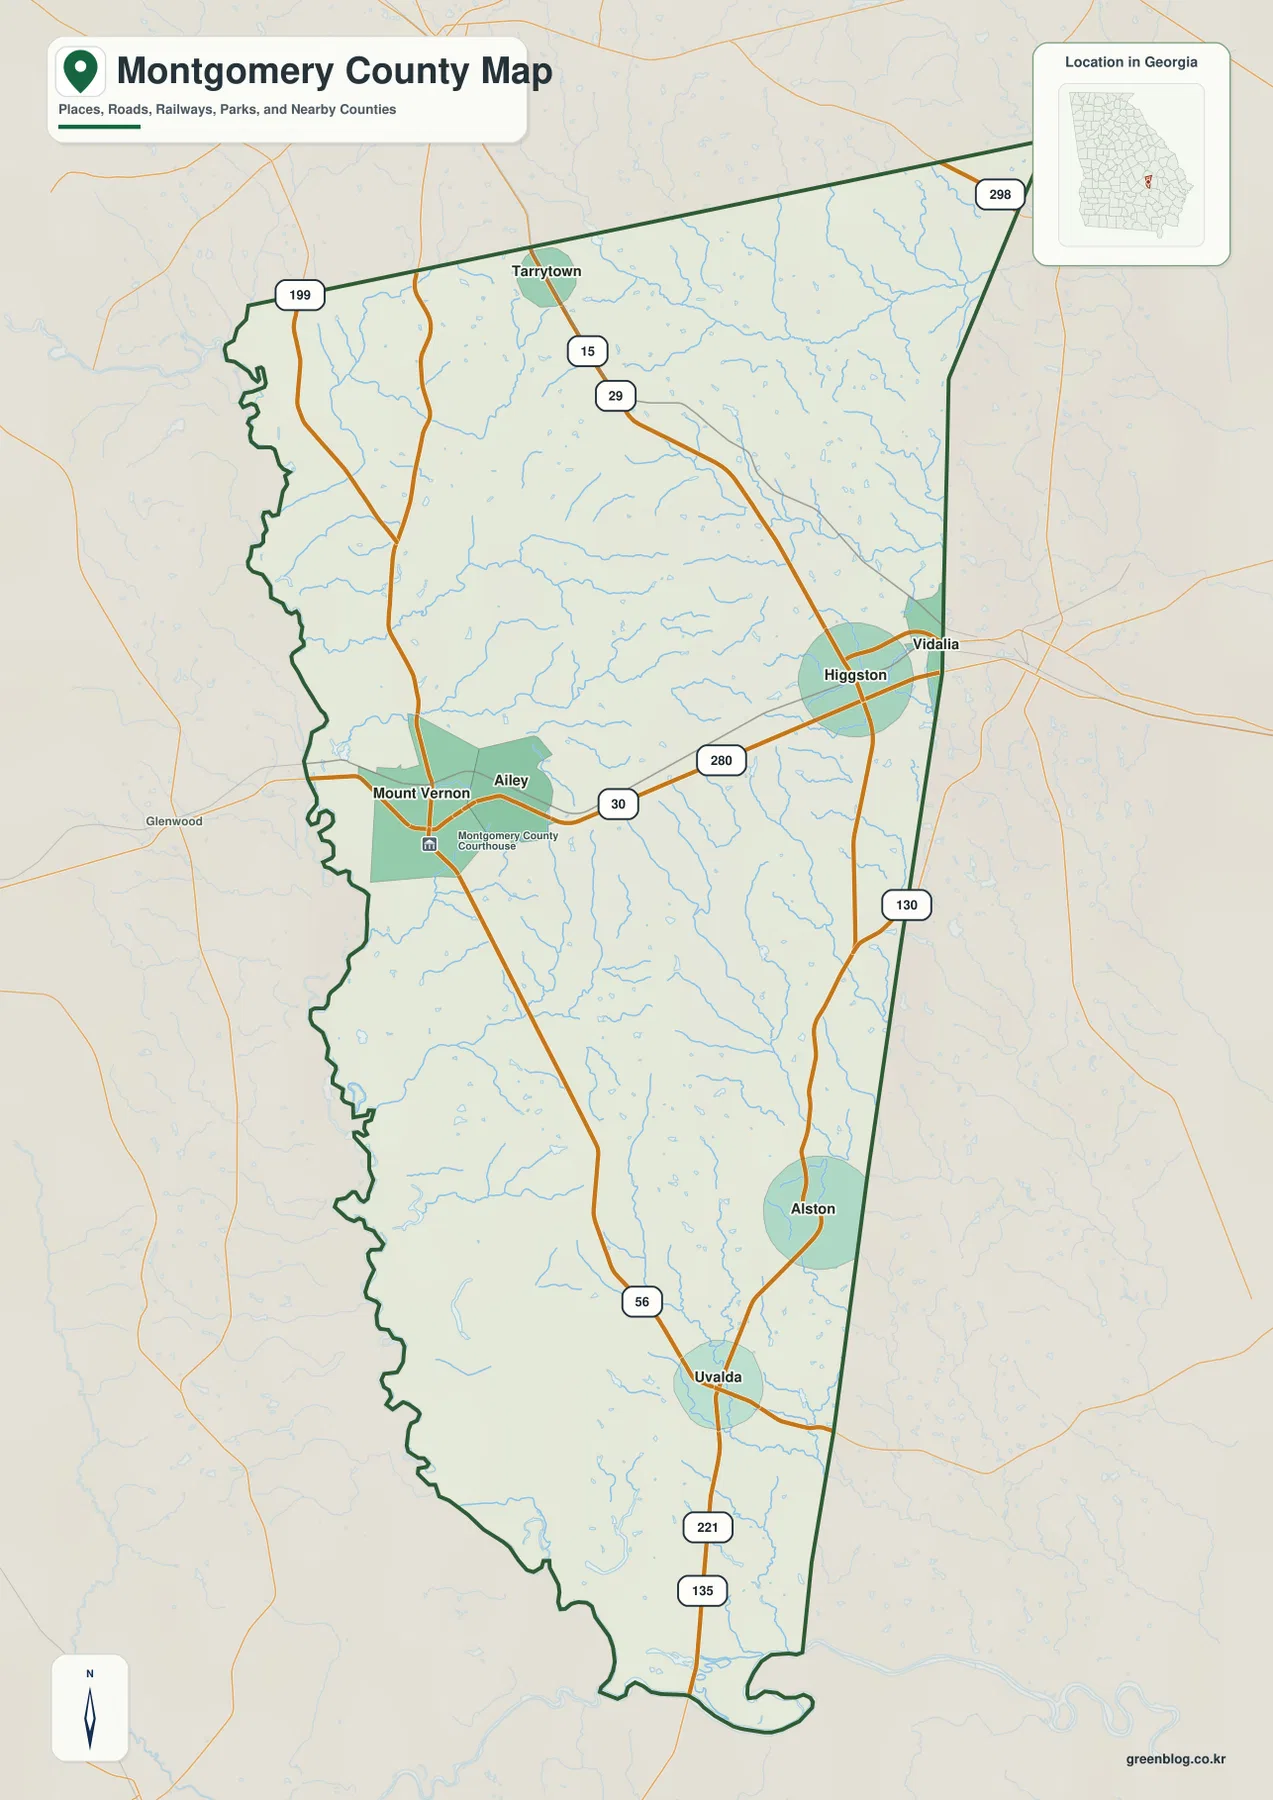
The shape of the boundary is also informative. Much of the western side is irregular and sinuous, while the eastern line is comparatively straight as it runs south. The companion city map labels Treutlen County to the north, Toombs and Appling Counties to the east, Telfair County to the southeast, and Wheeler, Jeff Davis, and Emanuel Counties along the western side. Vidalia appears just beyond the eastern edge on the general map, giving a useful outside reference for the Higgston area and eastbound roads.
Six mapped towns spread from Tarrytown to Uvalda
The city map makes the north-south spread of Montgomery County especially clear. Tarrytown is the northernmost of the six labeled places. Mount Vernon and Ailey form a close pair near the middle-left of the county, Higgston is near the eastern boundary, Alston sits farther south on the east side, and Uvalda is positioned near the lower portion of the county. Because the county itself is elongated, this distribution gives the map a very different feel from a county where most towns sit around one metropolitan center.
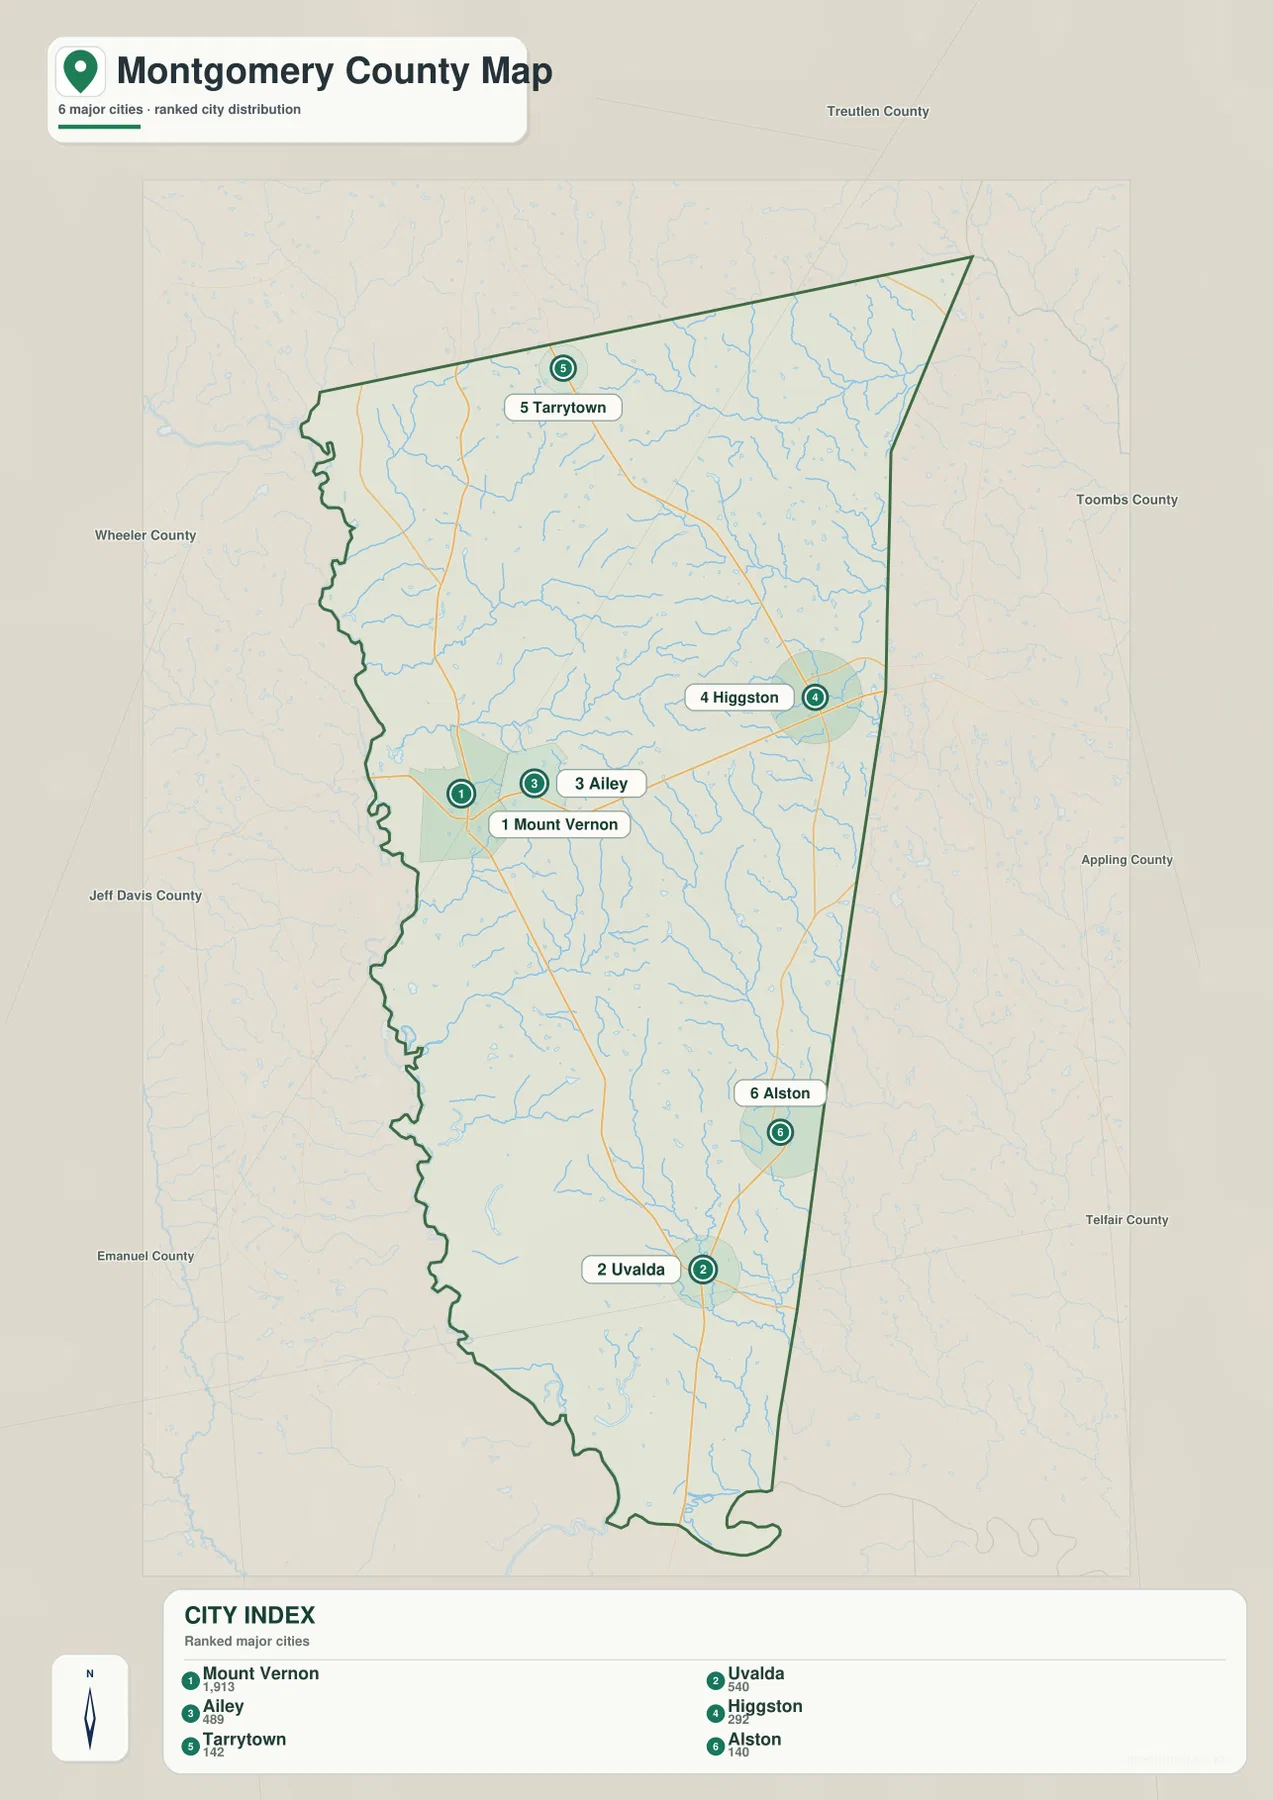
The city index printed on the map lists Mount Vernon at 1,913, Uvalda at 540, Ailey at 489, Higgston at 292, Tarrytown at 142, and Alston at 140. The map does not assign a date to those displayed figures, so they are best treated as part of the map’s town-ranking reference rather than as a substitute for current Census estimates. What matters most for orientation is the relative scale and position: Mount Vernon is the largest labeled center, yet the other small towns are dispersed across the full length of the county.
| Area on the map | What stands out |
|---|---|
| Mount Vernon and Ailey | Close west-central pair and the clearest administrative/road focus |
| Higgston | Eastern town near routes leading toward the Vidalia side |
| Tarrytown | Northernmost labeled town |
| Alston and Uvalda | Southern places that emphasize the county’s long north-south shape |
Creeks divide the interior from Cypress Creek to Dead River
The terrain-and-water map removes most road detail and makes the drainage network the main subject. Cypress Creek is labeled in the northwest, Tiger Creek crosses the northern and northeastern part of the county, and Bear Creek and Flat Creek run through the west-central area. Swift Creek appears on the east side, while many smaller unnamed tributaries branch between the labeled streams. The result is a fine-grained water network that cuts the county into many small ridges and valleys rather than one broad, flat surface.
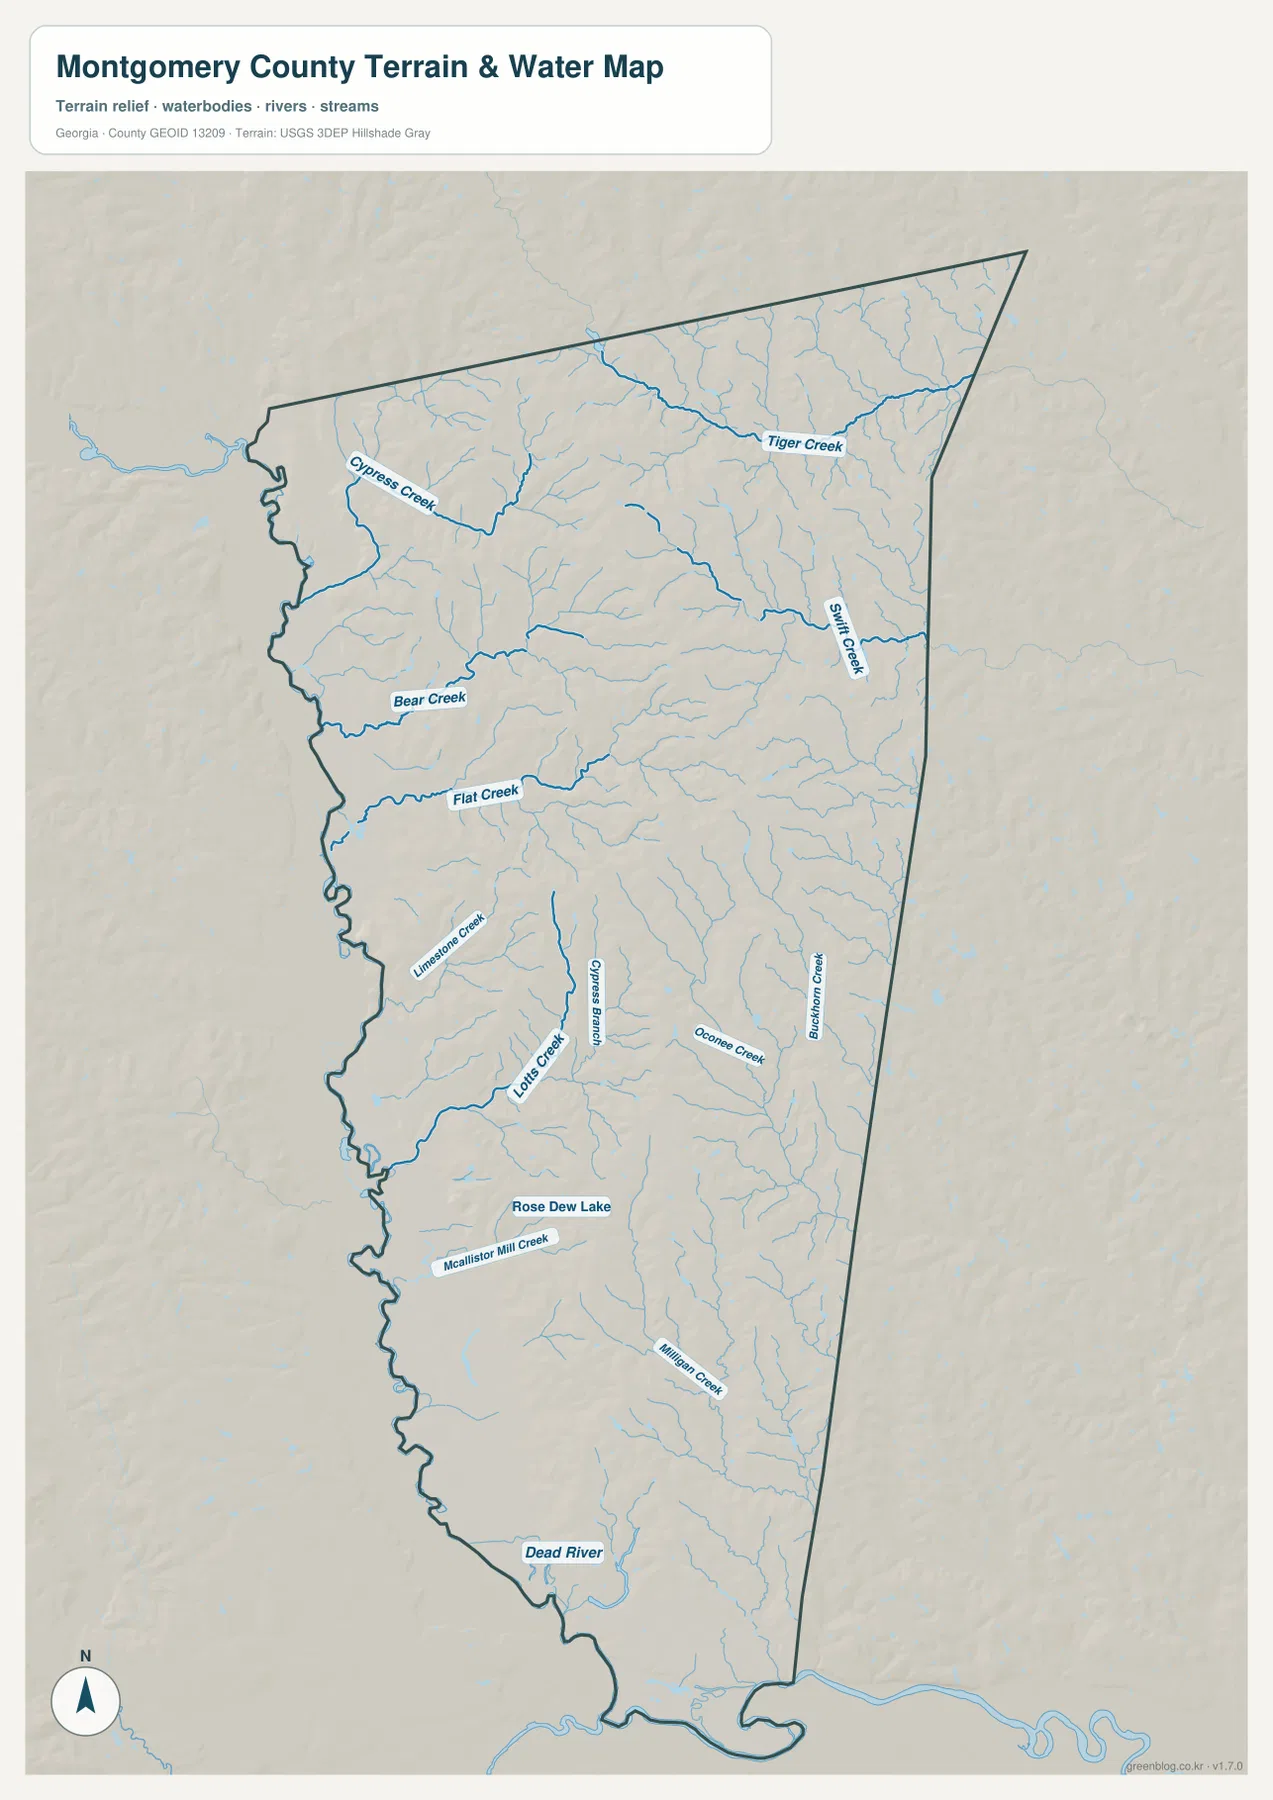
Rose Dew Lake is labeled in the southwestern half of the county, with small streams nearby, and Dead River is shown near the southwest side of the southern tip. When this map is compared with the county outline, the irregular western boundary makes more sense as part of a low, water-influenced edge. This is not a flood-hazard or navigation map, and it does not show legal riparian boundaries. Its value is in showing where streams, a small lake, terrain relief, and the county outline sit relative to one another.
Elevation rises from the western low ground into the central and eastern uplands
The elevation map gives Montgomery County its clearest topographic contrast. The legend reports an actual range of about 25 to 101 meters and a mean elevation of roughly 65 meters. Green shades dominate much of the western edge and the southern end, indicating lower ground, while tan and brown areas become more common across the center, north, and east. Numerous short ridges and shallow valleys are visible in the shaded relief, especially across the northern half and the east-central interior.
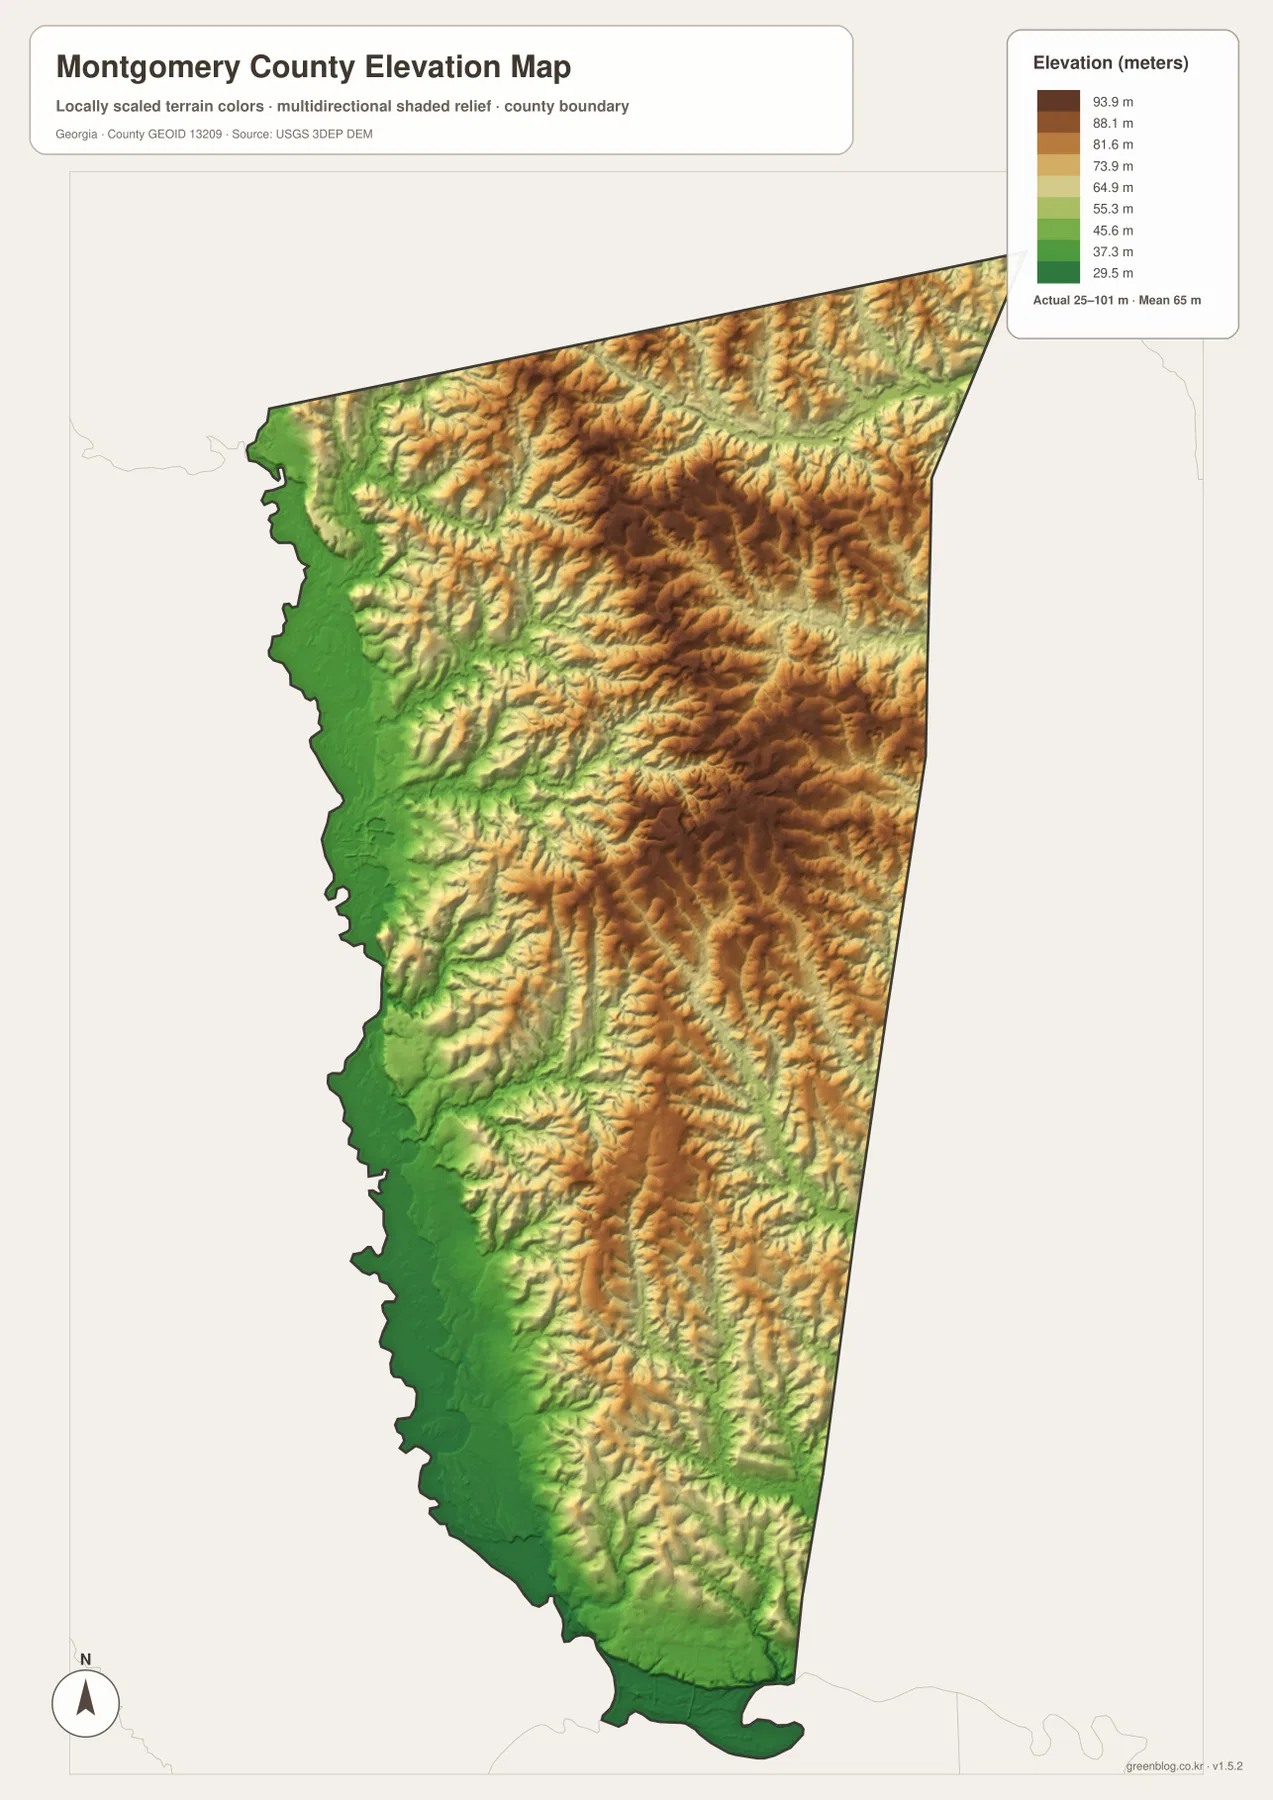
This generalized elevation surface is appropriate for county-scale comparison, not for surveying, engineering, or determining the exact height of a property. Its strongest use is comparative. A reader can see that the many creeks on the water map occupy a landscape of repeated small rises and depressions, and that the lower western corridor differs from the rolling interior. Adding the road map back into the comparison helps place Mount Vernon, Higgston, or Uvalda within those broader elevation zones.
What changes when roads, towns, water and relief are compared
For basic orientation, the county map is the fastest place to start because it combines the outline, towns, roads, and nearby references. The city map becomes more useful when the question is how the six incorporated places are distributed. The water map is better for following named creeks and the irregular western edge, while the elevation view explains why some of those drainage lines occupy lower corridors between rolling ridges. No single map has to carry every label; the set works best when the same area is checked across two or more views.
One useful example is the west-central Mount Vernon–Ailey area. The county map first shows its road connections, the city map shows how close the two places are, and the elevation map places them near the transition between lower western land and more broken interior relief. Looking east toward Higgston, higher terrain becomes more prominent. Looking south toward Uvalda, the map again approaches lower ground and a denser set of small drainage lines. Those local changes are easy to miss in a simple outline map but become obvious when the four images are compared.
A rural county established in 1793 near the Vidalia area
The supplied county background identifies Montgomery County as a Georgia county established in 1793, with Mount Vernon serving as the county seat. Its settlement pattern remains small-town and rural on the maps. The existing county material also places it within the broader southeastern Georgia area associated with Vidalia onion agriculture. Vidalia itself is outside the Montgomery County boundary on the map, but its position immediately to the east provides a familiar regional reference for Higgston and the eastbound road network.
These maps are therefore most useful for county-level geography: understanding where the incorporated places sit, how the main labeled roads connect them, where creeks and small water bodies cross the landscape, and how elevation changes across the county. They are not parcel maps, municipal legal-boundary maps, real-time travel maps, flood studies, or survey products. Those tasks require the appropriate official or specialized datasets.
Frequently Asked Questions
Which towns are shown on the Montgomery County city map?
The city map labels Mount Vernon, Uvalda, Ailey, Higgston, Tarrytown, and Alston. Mount Vernon and Ailey are close together in the west-central part of the county, while the other towns are spread north, east, and south.
Where is the lowest and highest terrain on the supplied elevation map?
The map shows much of the western edge and southern end in the lower elevation colors, while higher rolling terrain is more common through the central and eastern interior. The legend gives an overall range of about 25 to 101 meters, with a mean near 65 meters.
What is included in the downloadable ZIP?
The ZIP contains four high-resolution A3 JPG files: the county map, city map, water map, and elevation map. The WebP versions on the page are lighter previews, while the JPG files are intended for larger viewing and print reference.
Map File Information
For larger files than the WebP page previews, download one ZIP containing four high-resolution A3 JPG maps.
- File Type: four JPG files in one ZIP archive
Related Maps
Sources and references
The following sources provide county background or authoritative geographic data related to the boundary, waterways, and elevation used for county-scale reference. The maps on this page are general geographic guides and should not be treated as legal or survey documents.
- Montgomery County government overview
- U.S. Census Bureau TIGER/Line Shapefiles
- U.S. Census Bureau QuickFacts
- New Georgia Encyclopedia: Montgomery County
- USGS National Hydrography
- USGS 3D Elevation Program
Green Map creates custom-edited map images using open geographic data sources such as geoBoundaries, Natural Earth, OpenStreetMap, and government open data. These maps are edited visual materials, not raw data files, and are provided for education, documents, presentations, and graphic reference.