Macon County is easier to understand when the Flint River, the towns, and the terrain are viewed together rather than as separate features. Oglethorpe, the county seat, sits very close to Montezuma near the river, while Marshallville lies to the northeast and Ideal is farther west. The maps on this page show the county boundary, the main labeled roads and communities, direct city-to-city distances, named waterways, and the broad elevation pattern. You can also download the four original high-resolution JPG maps together in one ZIP file for printing, presentations, or closer inspection.
The Flint River forms the clearest geographic thread through the county. A low corridor follows the river from the north toward the southern boundary, and smaller creeks approach it from both sides. The road map shows Oglethorpe and Montezuma clustered near this central river corridor, with routes extending west toward Ideal and northeast toward Marshallville. The elevation map adds another layer: the river valley is lower, while rolling uplands rise on the western and eastern sides. Reading these features together gives a much more useful picture of Macon County than a simple outline alone.
Table of Contents
The Flint River gives Macon County its clearest geographic reference
The county map shows an irregular boundary surrounding a broad rural area in south-central Georgia. Oglethorpe and Montezuma are close together in the south-central part of the county, while Marshallville is separated to the northeast and Ideal lies well to the west. That arrangement matters because the county does not read as a single large urban center with suburbs spreading evenly around it. Instead, the map shows several small communities connected by longer rural road segments, with the Flint River running through the middle of the county’s overall layout.
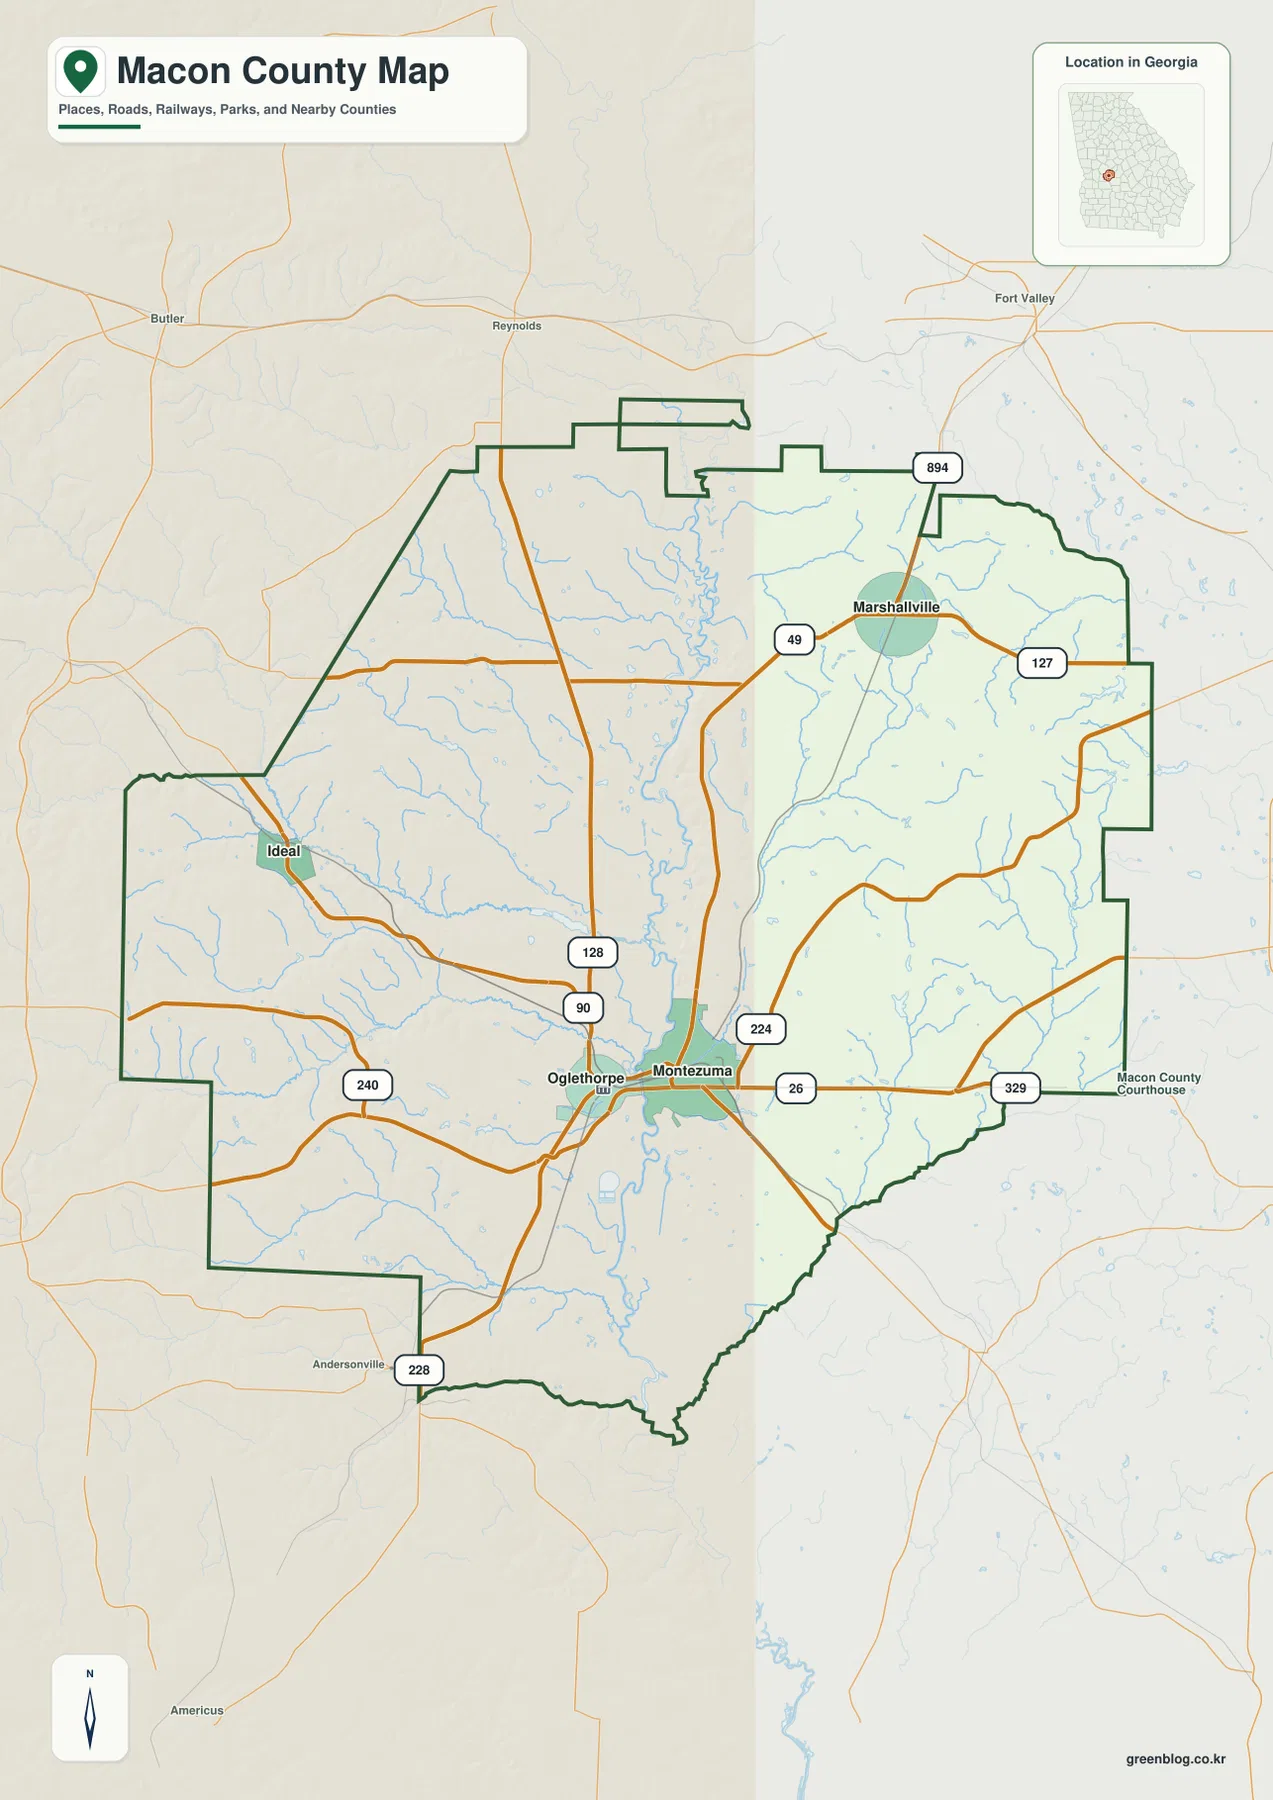
Several numbered roads stand out on the map, including 26, 49, 90, 127, 128, 224, 240, 329, and 228. The densest set of connections appears around Oglethorpe and Montezuma, where multiple routes meet near the river. Route 49 is visually important between the central area and Marshallville, while the east-west route marked 26 continues from the Oglethorpe-Montezuma area toward the eastern side of the county. Ideal is reached from the west through a different set of roads, helping show how widely the four labeled communities are spread.
The city map also provides useful orientation to neighboring counties. Taylor County is shown to the north, Crawford County to the northeast, Schley County to the east, Houston County to the southeast, Peach County to the southwest, Sumter County to the west, and Dooly County to the northwest. Those labels make it easier to understand where the roads leaving Macon County are headed. The map is not intended to replace a current navigation service, but it works well for learning the county’s position and for seeing how the local road network connects to the surrounding part of Georgia.
Oglethorpe and Montezuma form the closest pair among the labeled communities
The city-connections map uses Montezuma as the hub for comparison. Oglethorpe is shown only about 2 miles away, while Ideal is about 11 miles from Montezuma and Marshallville about 12 miles away. These are straight-line distances between the mapped points, not driving distances along the road network. They are best used to compare relative spacing: Oglethorpe and Montezuma are a very close pair, whereas Ideal and Marshallville sit on opposite sides of the county and create a much wider east-west and southwest-to-northeast spread.
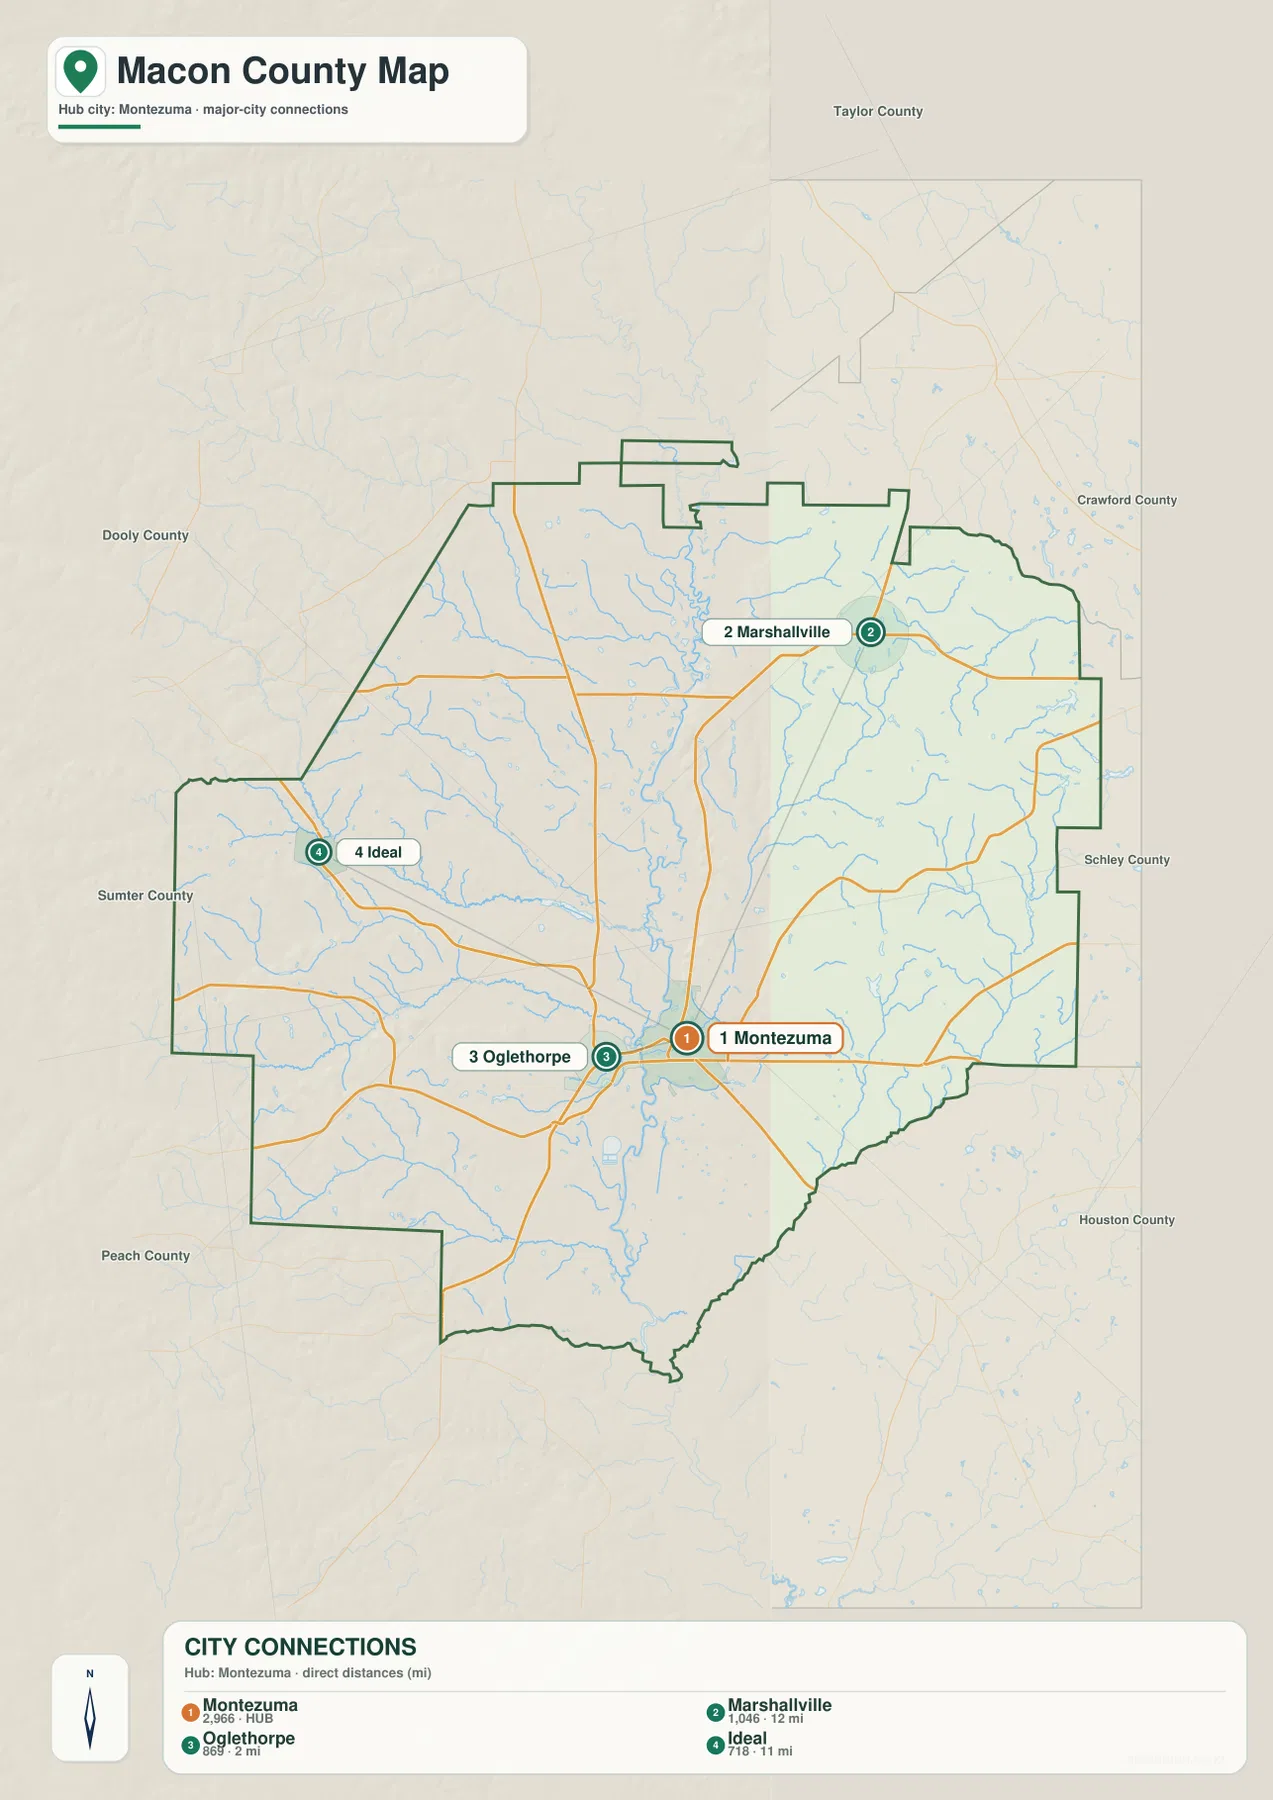
The map also displays population figures alongside the four city labels: Montezuma 2,966, Marshallville 1,046, Oglethorpe 869, and Ideal 718. On this page, those values are useful mainly as a quick visual cue to the relative size of the mapped communities. They should not be treated as a substitute for a current demographic table. Anyone who needs the latest population estimate, household characteristics, or other detailed statistics should check the Census source listed below rather than relying on the labels alone.
Oglethorpe and Montezuma serve different purposes in the map set. Oglethorpe is identified in the source article as the county seat, while Montezuma is chosen as the hub on the city-connections graphic. Because the two communities are so close, they can look almost like one central cluster at county scale, yet the map keeps them as separate labeled places. Marshallville and Ideal then show how far the settlement pattern extends beyond that central pair.
The road pattern connects a central river cluster with towns to the west and northeast
A useful way to read the general map is to start at Oglethorpe and Montezuma and follow the marked roads outward. The routes around the central pair fan west, north, east, and south, while Marshallville is tied into the network near the route numbers 49 and 127. Ideal sits farther west near the routes marked 90 and 128. Other labels such as 224, 240, 228, and 329 help establish additional directions through the county. The exact classification and full route descriptions are beyond the purpose of this page, but the network clearly explains why the central towns appear better connected than the more distant communities.
Roads and waterways should also be read together. The Flint River occupies the middle of the county, so some of the most important connections have to cross or approach its valley. The map does not show every bridge, local street, or access point, and it should not be used as a turn-by-turn navigation product. Its strength is broader orientation: it shows where the four labeled communities sit, which directions the larger routes take, and how those routes relate to the county boundary and river corridor.
The water map shows a Flint River spine with creeks entering from both sides
The terrain-and-water map makes the Flint River much more prominent than the general county map. It enters from the north, follows a winding path through the central part of Macon County, and continues toward the southern boundary. Smaller named streams are distributed on both sides. Whitewater Creek and Buck Creek are clearly labeled in the western half, Camp Creek appears farther south, and Beaver Creek and Hogcrawl Creek are shown on the eastern side. Together they make the county look like a set of small drainage valleys feeding a single larger river corridor.
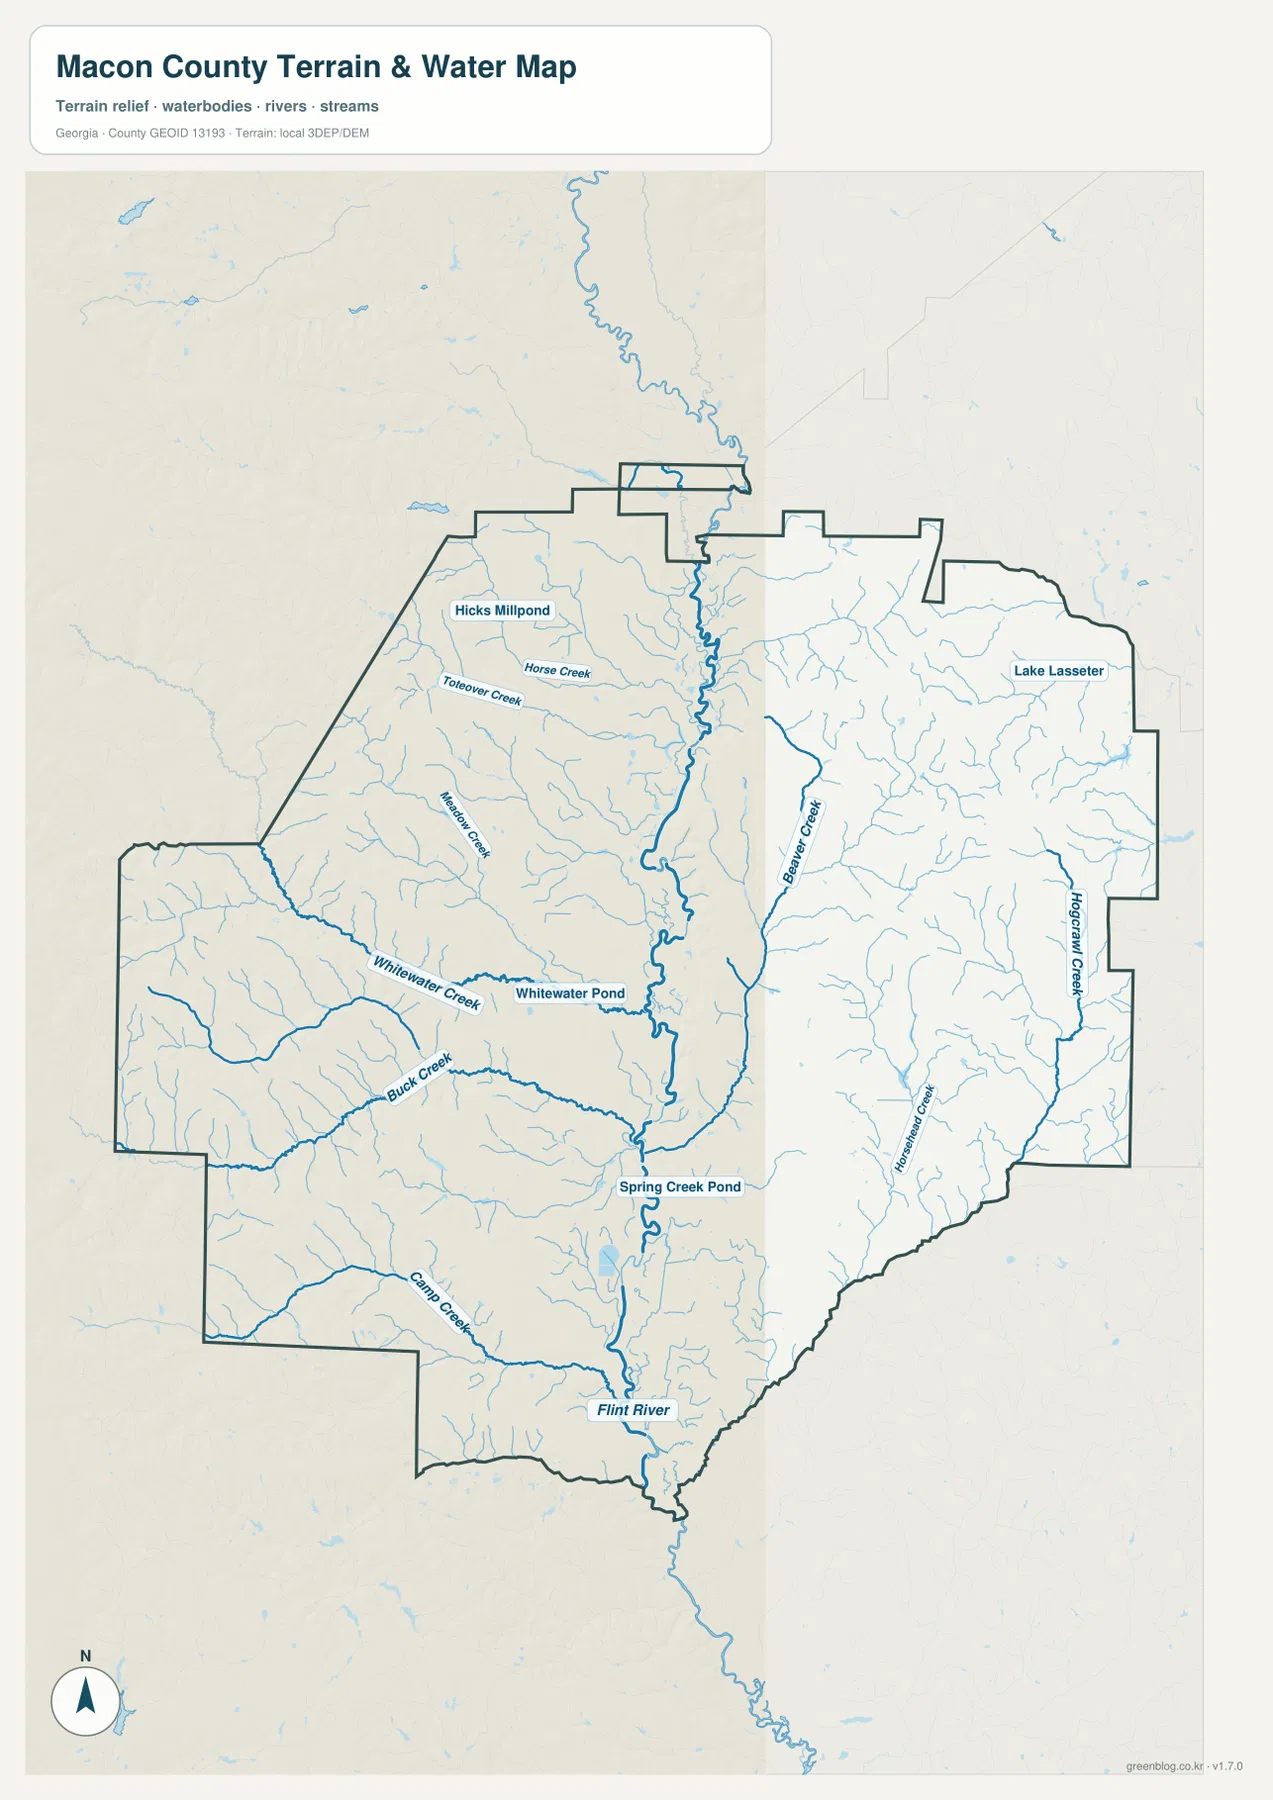
Several smaller water bodies are labeled as well. Hicks Millpond appears in the northwestern area, Whitewater Pond lies west of the river, Spring Creek Pond is shown farther south near the central part of the county, and Lake Lasseter is labeled on the eastern side. These labels are helpful for locating water features relative to the towns and county boundary, but the map is not a flood-hazard map, a navigation chart, or a legal access map. It does not tell a user whether land is publicly accessible, how deep a water body is, or whether a location is safe during high water.
Comparing the water map with the elevation map reveals why many of the creeks bend through narrow low areas. Whitewater Creek and Buck Creek occupy lower channels cut into the western uplands before they approach the Flint River. The eastern creeks likewise follow lower terrain between higher ridges. This relationship is visible without needing technical hydrology: the blue stream lines tend to occupy the green or lower-colored valleys on the elevation map, while the browner uplands stand above them.
The elevation map separates the low Flint River corridor from higher uplands
The elevation map uses locally scaled terrain colors to show broad height differences across Macon County. Its legend lists an actual range of about 77 to 167 meters and a mean of 116 meters. The lowest green zone follows the Flint River through the middle and southern portion of the county. On both sides of that low corridor, the terrain rises into yellow, tan, and brown areas. The contrast is especially strong where western creek valleys cut through higher ground and where more elevated ridges occupy the northeastern and eastern sections.
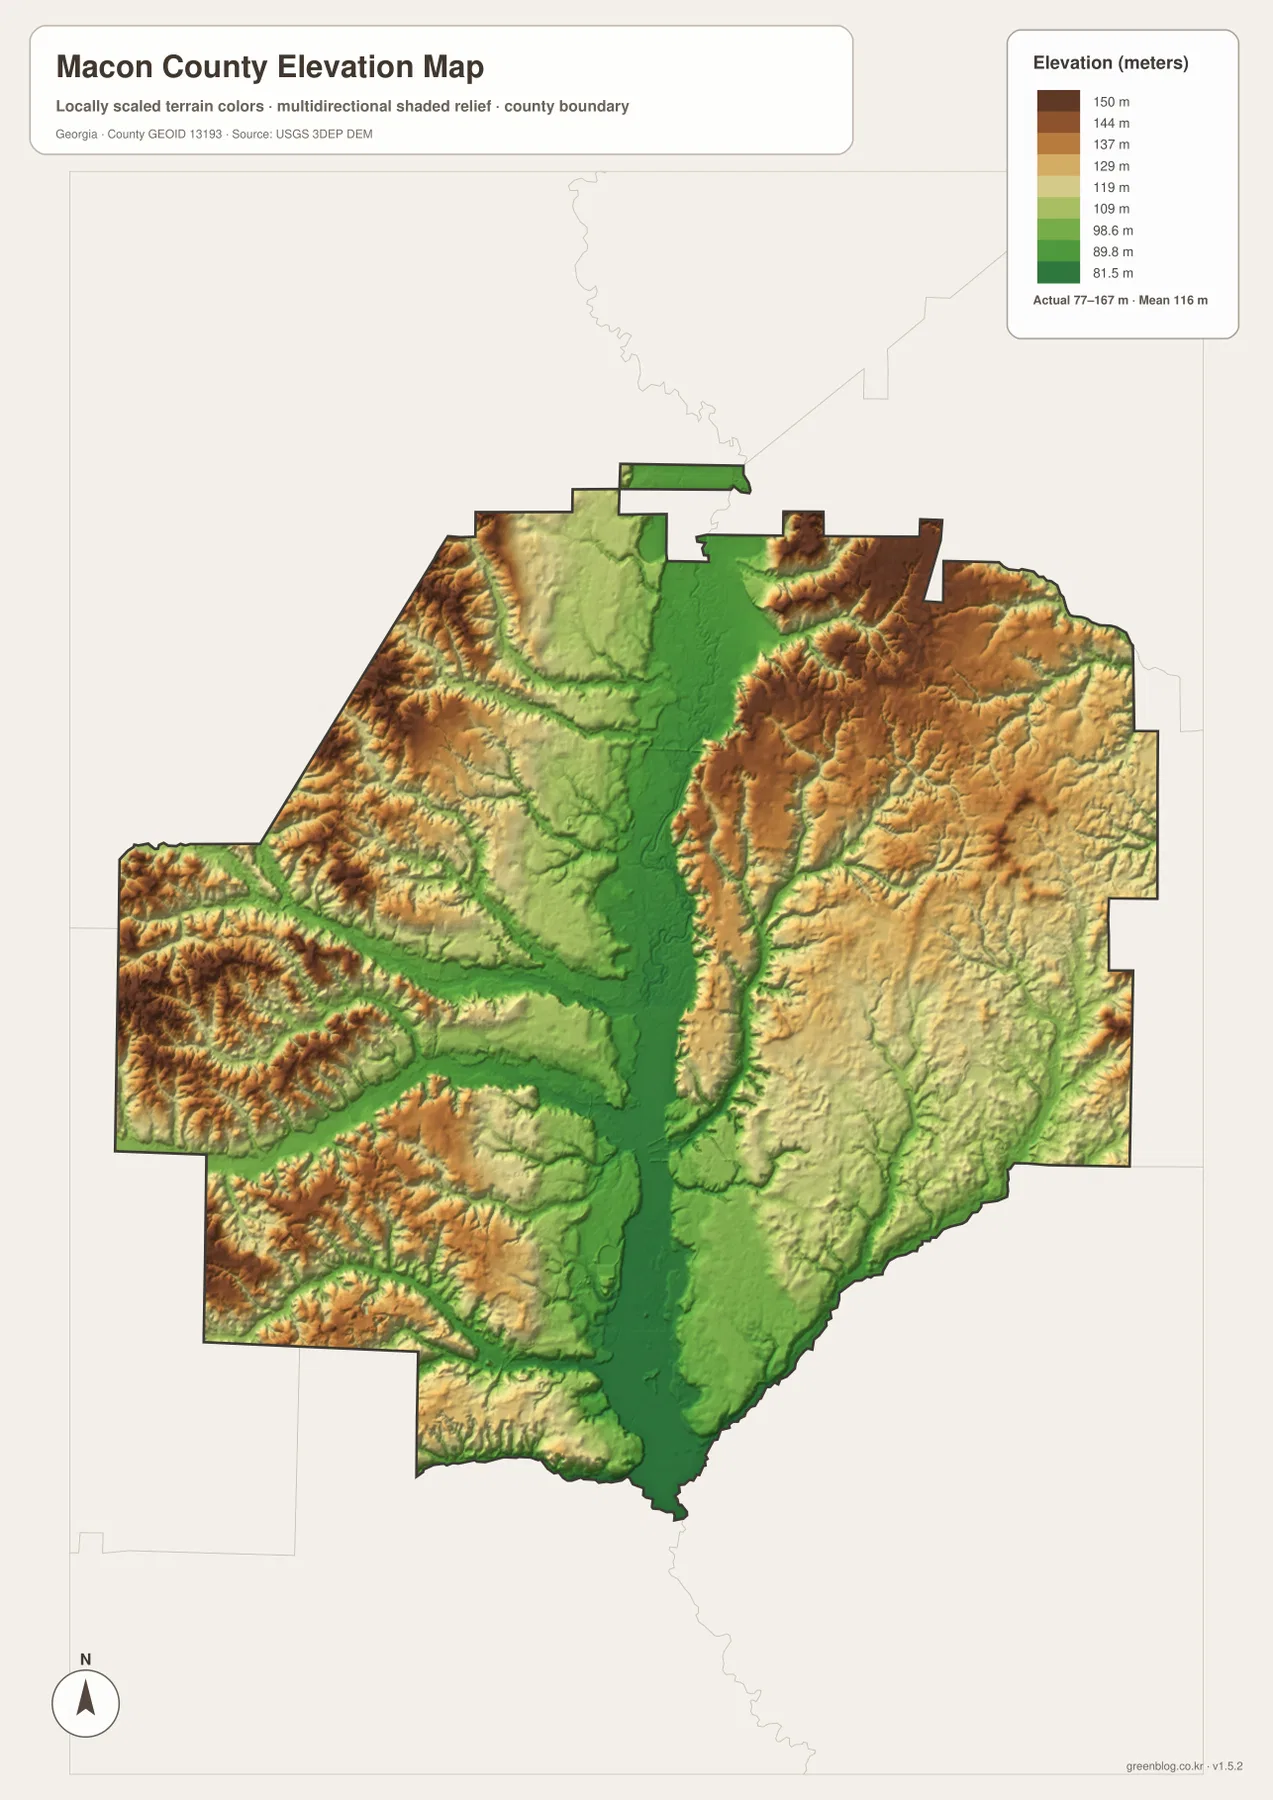
The western half is not uniformly high. Instead, ridges and valleys alternate as smaller streams cut toward the river. A similar pattern appears to the east, where higher ground is broken by the valleys of Beaver Creek, Hogcrawl Creek, and other unnamed drainage lines. The central river corridor remains the most continuous low feature from north to south. That broad difference helps explain the water map: the Flint River occupies the main low route, while tributaries descend from the surrounding uplands.
This elevation surface is designed for county-scale comparison, not engineering or surveying. A colored pixel on the map should not be treated as a precise site elevation for construction, drainage design, road grading, or property decisions. For those purposes, users need detailed elevation data and, where appropriate, professional field measurements. Here, the map is most useful for showing the large pattern: low river land through the center and higher rolling ground to the west and east.
Choose the map by the question you need to answer
For a quick county overview, start with the general map because it combines the boundary, roads, communities, and some water features in one view. Use the city-connections map when the main question is how Oglethorpe, Montezuma, Marshallville, and Ideal are spaced, remembering that its mileage is straight-line distance. The water map is better when the Flint River, named creeks, ponds, and Lake Lasseter are the focus. The elevation map is the clearest choice when you need to explain why the river corridor is low and why the surrounding terrain rises on both sides.
In a classroom report, the general map and elevation map can work as a useful pair because one shows named places and the other shows the land underneath them. A local-history or genealogy project may begin with the community map to orient modern locations before consulting historical records. A watershed discussion can use the water map to identify named streams and then compare those streams with the elevation surface. None of these maps replaces current navigation, parcel, flood, or survey products, but each is useful when its limits are respected.
The downloadable archive contains the four original high-resolution JPG maps represented by the previews on this page. Each image is 2572 × 3638 pixels, giving you more detail than the lighter web preview when you need to print, zoom in, or place a map in a document.
Frequently Asked Questions
How close are Oglethorpe and Montezuma on the city map?
The city-connections map places Oglethorpe about 2 miles from Montezuma. That number is a straight-line distance between the mapped points, so a real driving route can be longer.
Which water feature is the main reference on the Macon County water map?
The Flint River is the dominant feature because it runs through the central part of the county toward the south. Creeks such as Whitewater Creek, Buck Creek, and Beaver Creek connect smaller valleys to that larger river corridor.
Can the 77–167 meter elevation range be used for surveying?
No. The elevation map is a generalized county-scale surface for comparing higher and lower terrain. Surveying, engineering, drainage design, and site-specific work require more detailed data and appropriate field measurements.
What is included in the downloadable ZIP?
The archive contains four high-resolution JPG files: the county reference map, city-connections map, water map, and elevation map. The web page uses lighter previews, while the ZIP provides the larger original map images.
Map File Information
The ZIP includes the Macon County reference map, city-connections map, water map, and elevation map as high-resolution JPG files.
- Printable Size: 2572 × 3638 px each
- File Type: JPG
Related Maps
Sources and References
The following sources can be used to check county information or obtain the underlying types of boundary, water, and elevation data represented in the map set. The maps on this page are designed for readable geographic reference; users needing the newest official data should consult the source agencies directly.
- U.S. Census Bureau QuickFacts for Macon County, Georgia
- New Georgia Encyclopedia: Macon County
- U.S. Census Bureau TIGER/Line Shapefiles
- USGS National Hydrography
- USGS 3D Elevation Program
Green Map creates custom-edited map images using open geographic data sources such as geoBoundaries, Natural Earth, OpenStreetMap, and government open data. These maps are edited visual materials, not raw data files, and are provided for education, documents, presentations, and graphic reference.